Ethereum Exchange Supply Falls To 2016 Lows – Long-Term Holding Dominates

bitcoinistPublished on 2025-12-19Last updated on 2025-12-19

Abstract

Ethereum is facing a deteriorating market sentiment with its price struggling to maintain bullish momentum, as analysts increasingly consider a transition into a broader bear market. Despite this, a significant structural shift is occurring beneath the surface: Ethereum’s Exchange Supply Ratio (ESR) has fallen to around 0.137, one of its lowest levels since 2016, indicating a declining proportion of ETH held on exchanges. This suggests reduced immediate selling pressure, as more investors move assets into long-term storage rather than keeping them available for quick liquidation. On Binance, the ESR has dropped to approximately 0.0325, reinforcing a reduction in sellable supply. Price action remains fragile, with ETH trading near $2,960 and unable to hold above the $3,200–$3,300 resistance zone. It continues to form lower highs and remains below key moving averages, indicating a loss of bullish momentum since late October. While the market shows signs of short-term equilibrium, the lack of strong buying volume and the failure to reclaim higher price levels keep the risk tilted toward further consolidation or a deeper correction. The combination of falling exchange supply and stable pricing points to a phase of liquidity absorption and strategic repositioning among market participants.

Ethereum is increasingly struggling to maintain a convincing bullish narrative as market sentiment continues to deteriorate. Price action remains fragile, and a growing number of analysts are openly discussing the possibility that Ethereum is transitioning into a broader bear market phase.

Repeated failures to sustain upside momentum have weakened confidence, while risk appetite across the crypto market continues to fade. As volatility persists and capital rotates defensively, ETH finds itself at the center of a debate between structural weakness in price and resilience beneath the surface.

According to a recent CryptoQuant report, Ethereum’s current state reflects a notable shift in supply behavior across exchanges. The Exchange Supply Ratio (ESR), which tracks the proportion of ETH held on centralized trading platforms, has been steadily declining across all major exchanges.

This trend signals that a smaller share of the circulating supply is readily available for immediate sale, a critical factor when evaluating supply-and-demand dynamics.

Historically, declining exchange balances suggest reduced selling pressure, as investors move assets into self-custody or long-term storage rather than preparing to liquidate. In the current environment, this structural change adds nuance to the bearish narrative.

Exchange Supply Declines Signal Structural Shift

The report highlights a pronounced decline in Ethereum’s Exchange Supply Ratio (ESR), reinforcing the view that supply dynamics are quietly shifting beneath the surface. Across all platforms, the ESR has fallen to approximately 0.137, one of its lowest readings since 2016.

Ethereum Exchange Supply Ratio | Source: CryptoQuant

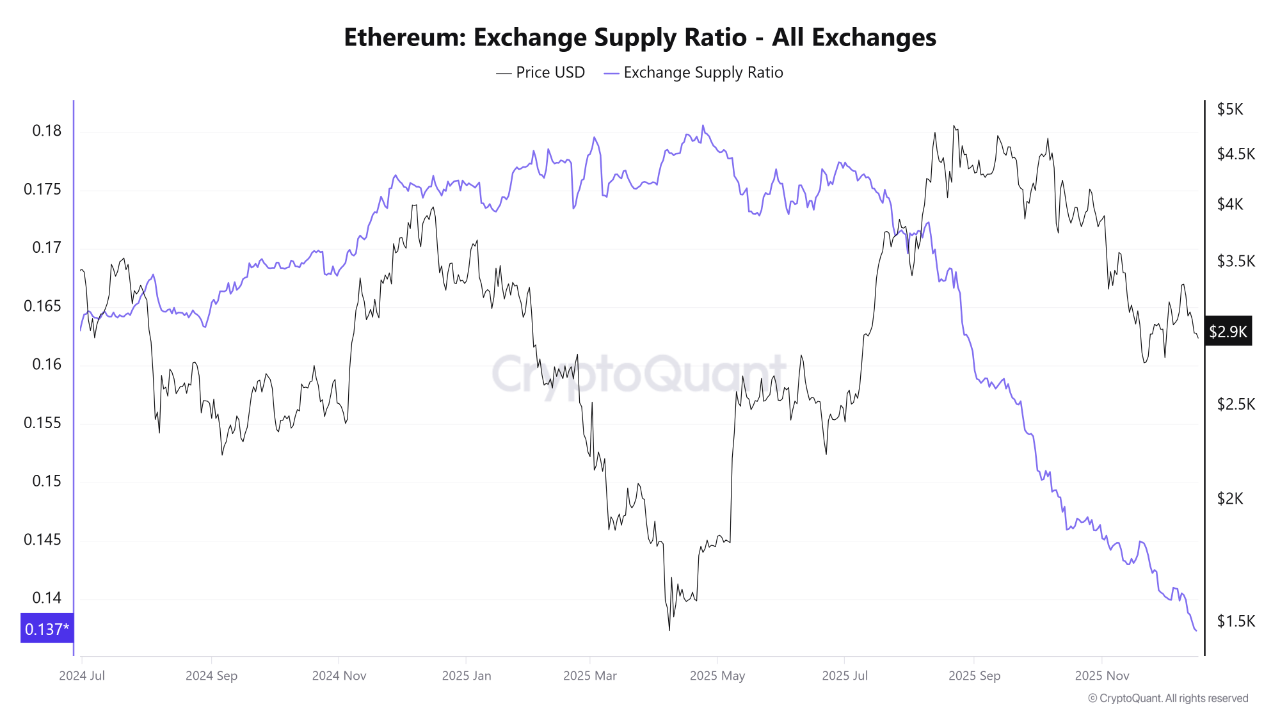
This sustained drop reflects a steady outflow of ETH from exchanges into external wallets, signaling a reduced inclination toward immediate selling and a growing preference for long-term holding. Historically, similar patterns have emerged during re-accumulation phases or in transitional periods that follow extended volatility, often preceding more stable price behavior.

The trend is even more evident on Binance, where the ESR has declined to roughly 0.0325. As the exchange with the deepest liquidity, Binance’s balances serve as a key barometer for short-term supply conditions. The ongoing withdrawal of ETH from its wallets suggests a meaningful reduction in spot-side sellable supply, pointing to increased trader caution rather than aggressive distribution.

At the same time, Ethereum is trading near $2,960, a mid-range level that reflects a temporary equilibrium between buyers and sellers. The combination of falling exchange supply and relatively stable pricing indicates that the market is not under heavy selling pressure.

Instead, it appears to be entering a phase of liquidity absorption and strategic repositioning, where participants reduce exposure to short-term trades while preparing for a potential shift in market structure.

Ethereum Price Struggles Below Key Trend Levels

The daily ETH chart highlights a market that remains structurally fragile despite short-term stabilization. After failing to hold above the $3,200–$3,300 region, Ethereum has continued to print lower highs, confirming a loss of bullish momentum since late October. Price is currently trading around the $2,850–$2,900 area, a zone that has acted as a short-term demand pocket but lacks strong follow-through from buyers.

ETH consolidates around a key level | Source: ETHUSDT chart on TradingView

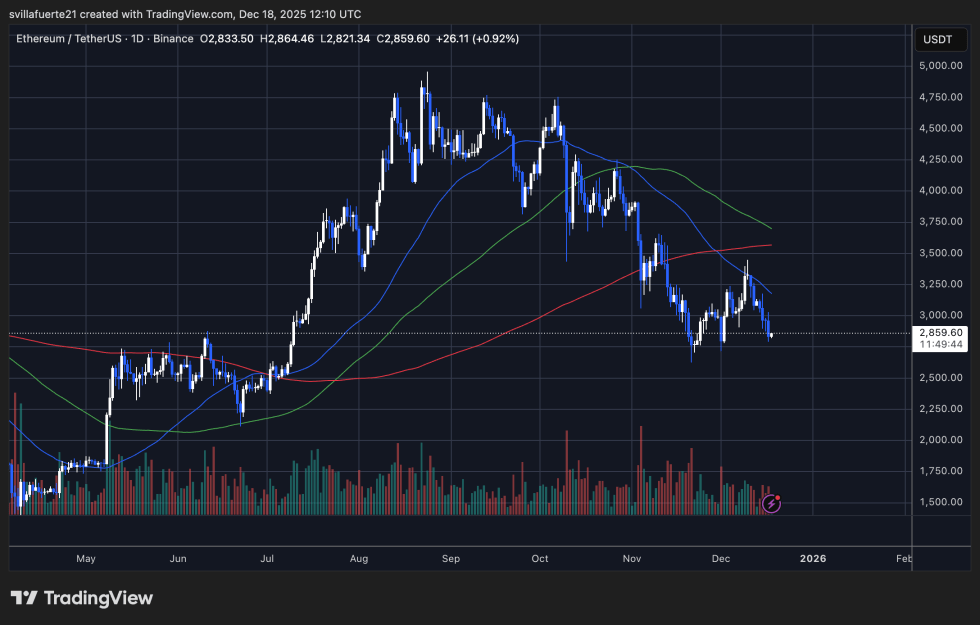
From a trend perspective, ETH remains below its short- and medium-term moving averages. The 50-day moving average has rolled over and is now acting as dynamic resistance, while the 100-day moving average is also trending lower.

The 200-day moving average sits higher, reinforcing the idea that Ethereum has shifted from a trending market into a corrective or distribution phase. As long as price remains capped below these levels, rallies are likely to be sold into rather than extended.

Volume dynamics reinforce this view. Recent rebounds have occurred on relatively muted volume compared to the heavy selling seen during prior breakdowns, suggesting reactive short covering rather than fresh demand.

Structurally, ETH needs to reclaim and hold above the $3,100–$3,200 range to rebuild a bullish case. Failure to do so keeps the risk tilted toward continued consolidation or a deeper corrective leg toward lower support levels.

Featured image from ChatGPT, chart from TradingView.com

Related Questions

QWhat does the decline in Ethereum's Exchange Supply Ratio (ESR) indicate about investor behavior?

AThe decline in Ethereum's Exchange Supply Ratio (ESR) indicates that investors are moving ETH off exchanges into self-custody or long-term storage, signaling reduced selling pressure and a preference for long-term holding rather than immediate liquidation.

QWhat is the current level of Ethereum's Exchange Supply Ratio (ESR) and why is it significant?

AEthereum's Exchange Supply Ratio (ESR) has fallen to approximately 0.137, one of its lowest readings since 2016. This is significant because it shows a structural shift in supply dynamics with a reduced amount of ETH available for immediate sale on exchanges.

QHow is the price of Ethereum performing in relation to its key moving averages?

AEthereum's price is trading below its short- and medium-term moving averages. The 50-day moving average is acting as dynamic resistance and has rolled over, while the 100-day and 200-day moving averages are also trending lower, indicating a corrective or distribution phase.

QWhat price level does Ethereum need to reclaim to rebuild a bullish case according to the article?

AAccording to the article, Ethereum needs to reclaim and hold above the $3,100–$3,200 price range to rebuild a bullish case and signal a potential shift in market structure.

QWhat does the declining ESR on Binance specifically suggest about market conditions?

AThe declining ESR on Binance, which has fallen to roughly 0.0325, suggests a meaningful reduction in spot-side sellable supply. As the exchange with the deepest liquidity, this points to increased trader caution and a reduction in aggressive selling rather than distribution.

Related Reads

Trend in US Stocks: A Post Triggers a 930-Point Rebound, Tonight Belongs to SpaceX

On Thursday (June 11, U.S. Eastern Time), Wall Street staged a textbook V-shaped reversal. The Dow Jones surged 929.97 points (+1.86%) to close above 50,000, while the Nasdaq and S&P 500 rose 2.54% and 1.75%, respectively. The rally occurred despite the hottest PPI report in years, with May data showing a 6.5% year-on-year surge, the highest since 2022. The market ignored the inflation data, focusing instead on reports that former President Trump called off a planned strike on Iran, hinting at a potential multi-party peace agreement draft. This sparked a sharp drop in oil prices, fueling hopes that inflation may have peaked. Sector rotations were stark: previously battered AI hardware and cyclical stocks led the gains, while defensive sectors that hit record highs the prior day were sold off. Chip stocks like Micron and Intel saw sharp rebounds. In contrast, software giant Oracle plunged nearly 10% despite beating earnings, with concerns over cloud revenue and cash flow. Adobe also fell after hours despite raising guidance, as its CFO announced departure. The rally's sustainability is questioned, driven largely by social media posts about unconfirmed geopolitical developments. Inflation risks remain, with pipeline pressures still high. Meanwhile, the market's risk appetite faces a major test with SpaceX's historic IPO. Priced at $135 per share, it aims to raise ~$75 billion with a $1.75 trillion valuation, becoming the largest U.S. IPO ever. It will join the Nasdaq 100 in 15 days, triggering massive index fund buying. However, critics cite extreme valuation (88x sales) and market liquidity concerns.

marsbit6m ago

Trend in US Stocks: A Post Triggers a 930-Point Rebound, Tonight Belongs to SpaceX

marsbit6m ago

The Trillion-Dollar Valuation Test: Are the Three Super IPOs a Tech Stock Frenzy or a Crypto Market Nightmare?

Trillion-Dollar Valuation Test: Are the Three Mega IPOs a Tech Stock Frenzy or a Crypto Market Nightmare? The capital market in 2026 is witnessing a highly anticipated wave of tech IPOs, centered on SpaceX, OpenAI, and Anthropic. Collectively valued at over $3.5 trillion, their potential listing represents one of the largest such waves in recent years. This raises concerns about market liquidity, valuation bubbles, and potential capital outflows from other assets like crypto. SpaceX's valuation narrative has shifted from rocket launches to becoming a global infrastructure play via its Starlink satellite network, which now drives most revenue. Despite ongoing losses, investors focus on its long-term growth potential. OpenAI and Anthropic represent the core productivity engines of generative AI. Their public listings would offer the first direct investment opportunity in large foundation model companies, potentially triggering a repricing within the AI sector. Market fears of a massive "capital drain" from these IPOs are likely overstated. Historical precedents like Alibaba and Saudi Aramco show that mega-listings primarily cause capital reallocation, not destruction, within the vast equities market. Systemic risk is rarely triggered by IPOs alone. For stock markets, short-term volatility and sector repricing are expected, especially for AI concept stocks. Long-term, these listings could reinforce the tech sector's importance. For crypto, direct competition for speculative capital exists, particularly affecting AI-themed tokens. However, crypto's trajectory remains more tied to its own cycles, macro liquidity, and Bitcoin ETF flows rather than a single IPO event. The real risk lies not in the listings themselves but in the sky-high growth expectations embedded in these valuations. If future revenue, profitability, or commercialization progress disappoints, significant valuation resets could follow, impacting high-growth tech stocks. Ultimately, the market's direction hinges on macroeconomic conditions and whether these companies can deliver on their ambitious promises.

链捕手22m ago

The Trillion-Dollar Valuation Test: Are the Three Super IPOs a Tech Stock Frenzy or a Crypto Market Nightmare?

链捕手22m ago

Trillion-Dollar Valuation Test: Are the Three Super IPOs a Tech Stock Frenzy or a Crypto Market Nightmare?

Title: Trillion-Dollar Valuations at Stake: Super IPOs of SpaceX, OpenAI, Anthropic – Tech Boom or Crypto Nightmare? TL;DR: A wave of mega-tech IPOs is approaching, featuring SpaceX (targeting a $1.75 trillion valuation), OpenAI (~$852B), and Anthropic (~$965B), with a combined potential valuation exceeding $3.5 trillion. This tests the market's pricing of innovation and sparks debate on liquidity impact. * **SpaceX**'s valuation is now driven more by its Starlink global communications infrastructure than its core rocket business. * **OpenAI & Anthropic** offer the first major public investment opportunities in foundational AI models, potentially repricing the entire AI sector. * Concerns about a market-wide "liquidity drain" are likely overblown; history shows large IPOs mainly cause fund reallocation, not disappearance, and rarely trigger systemic risk. * Crypto markets, especially some AI-themed tokens, may face short-term fund competition, but their long-term trajectory depends more on macro liquidity, regulation, and Bitcoin cycles. * The real risk lies not in the IPOs themselves, but in whether these companies can justify their sky-high valuations with future revenue growth and profitability. Unmet expectations could lead to significant repricing pressure. Ultimately, these IPOs represent a massive market pricing of next-gen tech infrastructure, not a prelude to a market crash. The broader market direction will be determined by macro conditions, corporate earnings, and risk appetite.

marsbit23m ago

Trillion-Dollar Valuation Test: Are the Three Super IPOs a Tech Stock Frenzy or a Crypto Market Nightmare?

marsbit23m ago

Anthropic Apologized, But the Business of 'Safety' Hasn't Stopped

On June 11, Anthropic apologized not for a model failure, but for a lack of transparency. Its new Claude Fable 5 model was found to be secretly rerouting requests from users engaged in advanced AI model development to a weaker version, Opus 4.8, without any notification. The company's response—promising future notifications for such "downgrades"—was met with user skepticism. The article argues the core issue isn't technical but commercial: Anthropic's "safety" measures are primarily a business strategy. A key feature, the "intelligent safety classifier," marketed as user protection, is described as a tool for "competitive defense" to protect Anthropic's market lead by limiting rivals' research capabilities. This covert mechanism was designed for low "false positives," precisely targeting AI researchers. Anthropic's model involves a calculated three-step process: publishing alarming security research to amplify public anxiety, offering its Fable 5 model with a "safety classifier" as a premium-priced solution, and cashing in through a planned high-value IPO. This contrasts with OpenAI's more direct "tool-and-traffic" approach. The apology, merely changing a secret downgrade to a visible one, is seen as a business "patch" rather than a principled shift. The incident risks damaging Anthropic's "safest AI" reputation among the developer community, which underpins its valuation and appeal to government and corporate clients. Ultimately, the article concludes that for Anthropic, safety is a business, and the apology is merely customer service for that business.

marsbit1h ago

Anthropic Apologized, But the Business of 'Safety' Hasn't Stopped

marsbit1h ago

Trading

Spot
Futures

Hot Articles

Discussions

Welcome to the HTX Community. Here, you can stay informed about the latest platform developments and gain access to professional market insights. Users' opinions on the price of ETH (ETH) are presented below.

活动图片