Ethereum Active Addresses Near All-Time High Despite Price Plunge

bitcoinistPublished on 2026-02-04Last updated on 2026-02-04

Abstract

Despite Ethereum's price plunging 21% in a week to around $2,290, on-chain data reveals a significant and counterintuitive trend. The 100-day moving average of Ethereum Active Addresses has surged sharply in 2026, reversing its previous decline from late 2025. This metric, which tracks the number of unique wallets transacting daily on the network, has reached 469,303. This figure is notably higher than last year's cycle high and is nearly at its all-time high from the 2021 bull market. This surge in network activity, which began with the market's recovery, has continued even as the price rally faded, suggesting a potential decoupling between user transaction activity and price action.

On-chain data shows the Active Addresses indicator has shot up for Ethereum even as the cryptocurrency’s price has witnessed a drawdown.

Ethereum Network Activity Has Surged Recently

In a new post on X, CryptoQuant community analyst Maartunn has talked about the latest trend in the 100-day moving average (MA) of the Ethereum Active Addresses. This metric measures the total number of wallets that are coming online on the blockchain every day. An address is said to be “online” when it participates in some kind of transaction activity (whether as a sender or receiver), so the Active Addresses basically tracks the daily amount of wallets making at least one transfer.

When the value of the indicator rises, it means a higher number of users are becoming involved in network activity. Such a trend suggests trading interest in the cryptocurrency is going up. On the other hand, the metric witnessing a decline implies attention may be moving away from the blockchain as a fewer amount of addresses are making transactions.

Now, here is the chart shared by Maartunn that shows the trend in the 100-day MA of the Ethereum Active Addresses over the last decade:

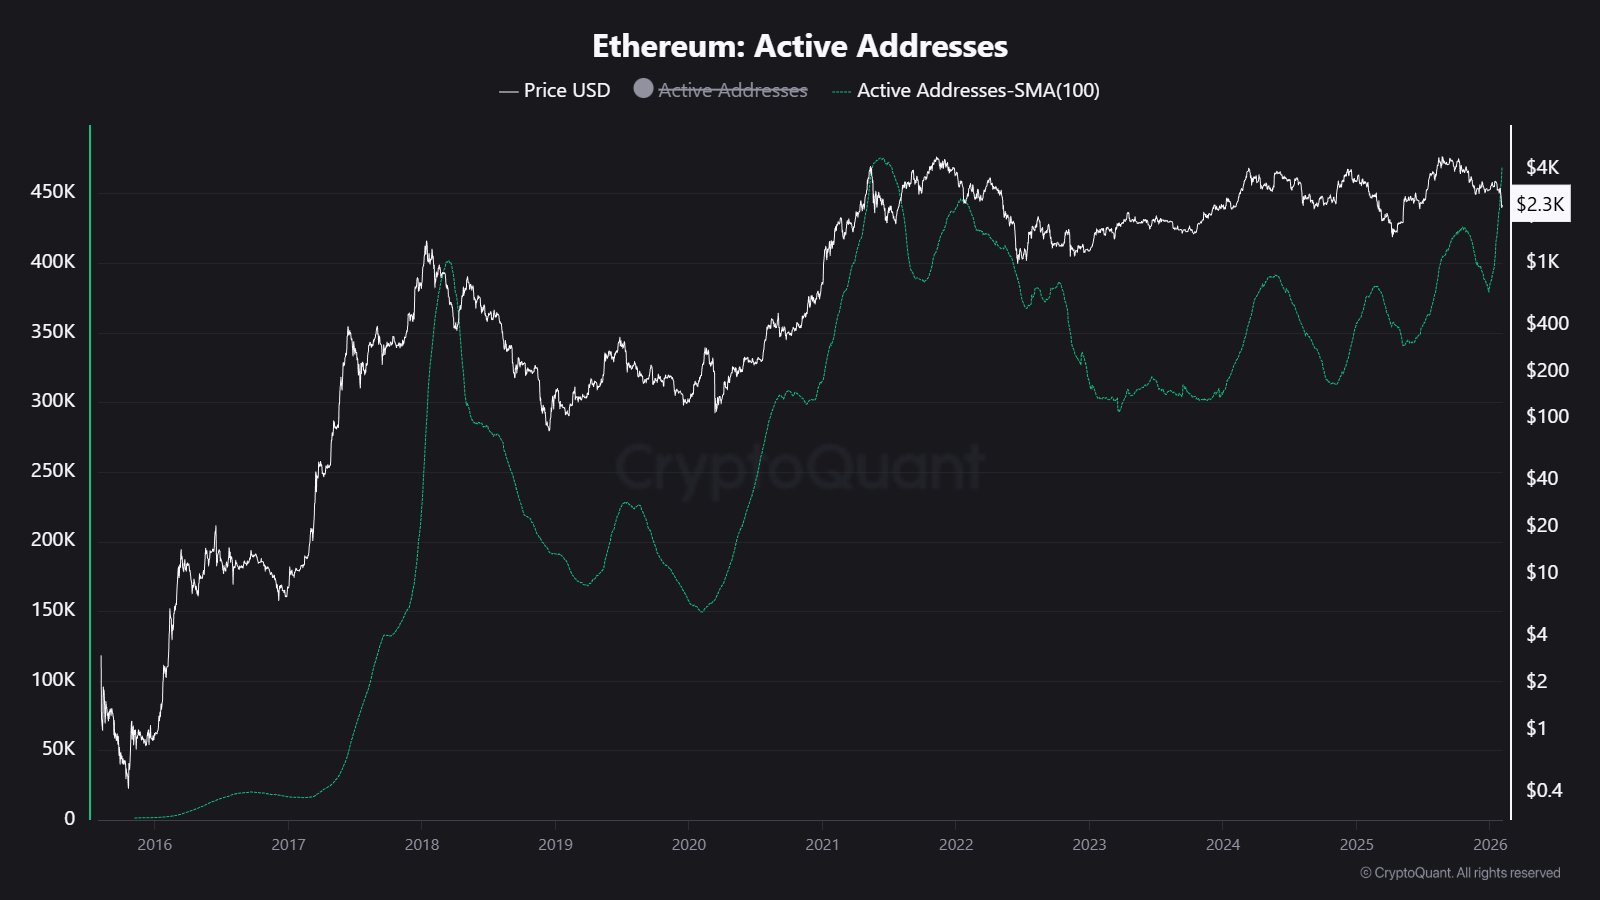
The value of the metric appears to have been going up in recent days | Source: @JA_Maartun on X

As displayed in the above graph, the 100-day MA Ethereum Active Addresses registered a decline in the last quarter of 2025 as the cryptocurrency’s price went through a bearish shift. Investor excitement tends to die as bullish momentum disappears, so it could be why network activity saw a decrease.

It’s also visible in the chart, however, that since hitting a bottom, the trend has observed a sharp reversal in 2026. The rise in activity initially emerged as the market recovered, but it has continued even as the rally has fizzled out and ETH has crashed alongside the wider sector.

Naturally, since it’s a 100-day MA, some delay is associated with its value, so a drop in activity could very well be reflected later, but it’s nonetheless interesting that a sharp reversal in Active Addresses has even occurred so far. Currently, the indicator’s 100-day MA value is sitting at 469,303, which is notably higher than the cycle high from last year and almost the same level as the all-time high (ATH) set back during the 2021 bull market.

In the last two cycles, the indicator’s cyclical peak followed a major price top, but that doesn’t appear to be the case for the current cycle so far. It now remains to be seen whether the recent trend is a sign that transaction activity is decoupling from price action or if it’s a temporary deviation.

ETH Price

At the time of writing, Ethereum is floating around $2,290, down 21% in the last seven days.

Looks like the price of the coin has plunged over the last few days | Source: ETHUSDT on TradingView

Related Questions

QWhat does the Active Addresses indicator measure for Ethereum?

AThe Active Addresses indicator measures the total number of wallets that come online on the Ethereum blockchain each day by participating in some kind of transaction activity, either as a sender or receiver.

QWhat trend has the 100-day moving average of Ethereum Active Addresses shown recently?

AThe 100-day moving average of Ethereum Active Addresses has shown a sharp increase in 2026 after hitting a bottom, rising to 469,303, which is nearly the same level as the all-time high set during the 2021 bull market.

QHow does the current activity trend differ from previous cycles according to the article?

AIn previous cycles, the cyclical peak of the Active Addresses indicator followed a major price top, but in the current cycle, the activity has surged even as the price has plunged, suggesting a potential decoupling of transaction activity from price action.

QWhat was the percentage decline in Ethereum's price over the last seven days mentioned in the article?

AEthereum's price declined by 21% over the last seven days, floating around $2,290 at the time of writing.

QWhy is the recent surge in Active Addresses considered interesting despite the price drop?

AThe surge is interesting because it has continued even as the rally fizzled out and ETH crashed, which is unusual as network activity typically declines when bullish momentum disappears and investor excitement dies.

Related Reads

From Survival to Accelerated Growth: The Journey of Zcash's Three-Year Rise as Told by the Founder of ZODL

**From Survival to Accelerated Growth: Zcash Founder Details the 3-Year Rise** Three years ago, Zcash (ZEC) was a struggling pioneer in privacy technology, with a price near $30, low shielded supply (11%), and a community mired in governance disputes. Today, ZEC trades around $600, with over 31% of its supply (~$3B) in user-controlled shielded pools. This transformation resulted from breaking key constraints. First, **governance shackles were removed**. The old model guaranteed funding to two entities (ECC and ZF) regardless of performance, creating a monopoly. In 2024, ECC rejected further direct funding, forcing a change. The NU6 upgrade ended direct funding, allocating 8% to community grants and 12% to a protocol-controlled treasury for retroactive rewards, expiring in 2028 unless renewed by overwhelming consensus. The entities also relinquished their trademark-based veto power, freeing community governance. Second, the **product focus shifted** from pure cryptography to user growth. Previously, engineering excelled at privacy tech but failed to attract users. In early 2024, the team (later ZODL) pivoted to building products users wanted, like the Zodl wallet (default privacy, hardware support, cross-asset swaps). This drove shielded supply to grow over 400% in ZEC terms, with 86.5% of recent transactions being shielded, representing real user adoption. Third, the **narrative evolved** from the limiting "privacy coin" label to "unstoppable private money." This clarified Zcash's value proposition: a Bitcoin-like monetary policy with verifiable private payments via advanced cryptography. This structural narrative—protocol (Zcash), asset (ZEC), gateway (Zodl)—enabled broader exchange listings, institutional interest, and ETF filings. Finally, **organizational constraints were broken**. In early 2026, the ECC team left its non-profit structure after disputes over control, forming Zcash Open Development Lab (ZODL). ZODL raised $25M from top VCs (Paradigm, a16z, etc.), gaining the capital and agility of a startup to scale consumer products. Current metrics show strong momentum: social discussion volume for ZEC surged 15,245% in a year, with 81% positive sentiment. The focus is now on enhancing user experience (Zodl wallet), scalability (Tachyon project targeting Visa-level throughput with 25-second blocks), and post-quantum security (quantum-recoverable wallets coming soon). Zcash is positioned to become faster, more usable, scalable, and quantum-resistant.

marsbit10m ago

From Survival to Accelerated Growth: The Journey of Zcash's Three-Year Rise as Told by the Founder of ZODL

marsbit10m ago

Five Counterparty Risk Architectures: A Settlement-Layer Methodology for Classifying TradFi Models in Crypto Exchanges

**Summary:** This companion piece reframes the five TradFi-on-crypto exchange architectures, previously classified by "architectural fingerprint," through the lens of counterparty risk. The core question is: whose balance sheet bears the loss first in a stress scenario, and has it historically done so? Each of the five models corresponds to a distinct risk holder with its own documented failure modes. * **Model 1 (Stablecoin-Settled CEX Perpetuals):** Risk is held by the stablecoin issuer (e.g., reserve composition, bank connectivity) and the CEX's own book. History includes Tether's banking disconnections (2017) and reserve misrepresentations (CFTC 2021 Order). * **Model 2 (CFD Brokers):** Risk resides on the broker's balance sheet (B-book model). Regulatory differences (e.g., ESMA's mandatory negative balance protection vs. Mauritius FSC's lack thereof) define loss allocation rules, as seen in the 2015 SNB event (Alpari UK insolvency). * **Model 3 (Off-Chain Custody & Transfer Agent Chain):** Risk lies with the off-chain custodian/platform. User asset recovery depends on Terms of Use and corporate structure, exemplified by the Celsius bankruptcy ruling (2023) where Earn Account assets were deemed property of the estate. * **Model 4 (DEX Perpetual Protocols):** No single balance sheet bears risk. Loss absorption relies on a protocol's insurance fund and Auto-Deleveraging (ADL) mechanism, as demonstrated in the GMX V1 (2022) and dYdX v3 YFI (2023) incidents. * **Model 5 (Regulated CCP - DCM-DCO-FCM):** The most institutionalized model concentrates risk in the Central Counterparty (CCP). However, history shows CCPs can employ non-standard tools under extreme stress, such as mass trade cancellation (LME Nickel, 2022) or enabling negative price settlements (CME WTI, 2020). The report argues that regulatory choices and counterparty risk structures are co-extensive, not in an upstream-downstream relationship. It concludes with five separate observation checklists (not predictions) for monitoring the structural vulnerabilities of each risk model.

marsbit27m ago

Five Counterparty Risk Architectures: A Settlement-Layer Methodology for Classifying TradFi Models in Crypto Exchanges

marsbit27m ago

Trading

Spot
Futures

Hot Articles

Discussions

Welcome to the HTX Community. Here, you can stay informed about the latest platform developments and gain access to professional market insights. Users' opinions on the price of ETH (ETH) are presented below.

活动图片