ETH Staking Data Reversal: Exits Drop to Zero VS Entries Surge by 1.3 Million—When to Buy the Dip?

Odaily星球日报Published on 2026-01-07Last updated on 2026-01-07

Abstract

Ethereum's staking dynamics have recently undergone a notable shift. As of January 7, the exit queue for ETH staking has been fully cleared, indicating that the prolonged period of withdrawal pressure has been absorbed. Concurrently, the entry queue has surged significantly, with approximately 1.3044 million ETH now waiting to be staked—a stark contrast to the situation in mid-September when over 2.66 million ETH were queued to exit amid higher prices. This reversal, while reflecting improved market structure, is largely driven by institutional reallocation rather than broad retail momentum. Notably, BitMine, a major digital asset treasury, staked around 771,000 ETH in recent weeks, accounting for a substantial portion of the new entries. This suggests the trend is influenced more by long-term yield strategies than immediate bullish sentiment. Beyond staking, Ethereum's fundamentals show signs of broader improvement: Q4 2024 saw a record 8.7 million smart contracts deployed, stablecoin transfer volume exceeded $8 trillion, and gas fees hit all-time lows. Exchange reserves of ETH remain near multi-year lows, reducing immediate sell-side pressure. Additionally, the significant disparity between Ethereum’s TVL dominance (59%) and its market cap share (~14%) may indicate undervaluation relative to its economic activity. In summary, while the staking shift alone may not signal a price turnaround, it aligns with other strengthening on-chain metrics, suggesting Ethereum is underg...

Original | Odaily Planet Daily (@OdailyChina)

Author | Ding Dang (@XiaMiPP)

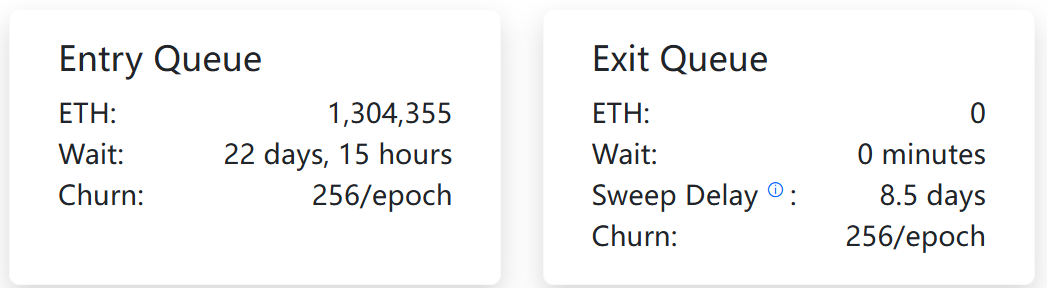
On January 7, the exit queue for Ethereum's Proof-of-Stake (PoS) mechanism officially cleared. At least from on-chain data, the sustained exit pressure over the past months has finally been fully digested, with no new large-scale redemption requests currently observed.

At the same time, the size of the staking entry queue has significantly increased, now reaching approximately 1.3044 million ETH, with a waiting time of about 22 days and 15 hours. This situation is a complete reversal compared to mid-September last year.

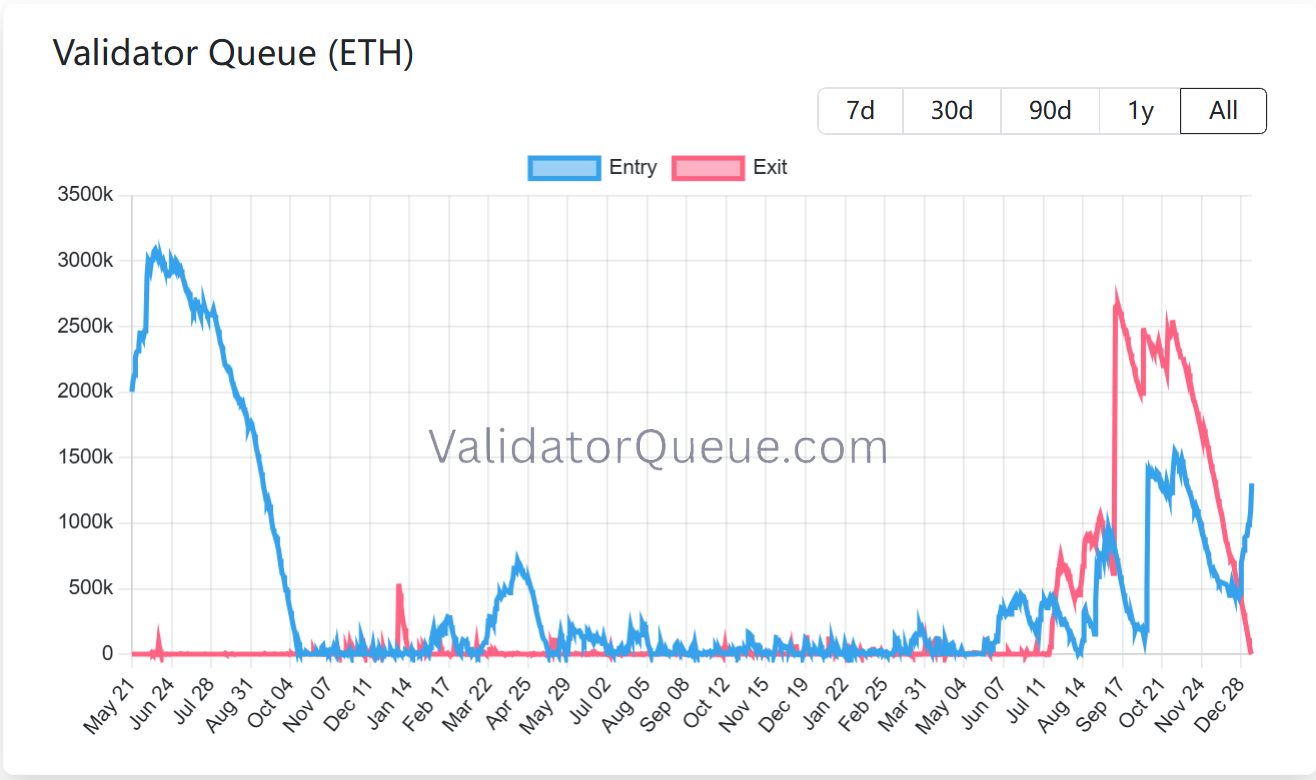
At that time, ETH's price was at a阶段性高点 of around $4,700, and market sentiment was high, but the staking side showed a different attitude: 2.66 million ETH chose to exit staking, with exit queue wait times一度 exceeding 40 days. In the following three and a half months, ETH's price fell by about 34%, dropping from $4,700 to $3,100.

Now, after a deep price correction, the exit queue has finally been fully digested.

Staking Queue as a "Sentiment Indicator," But Not a Price Signal?

Typically, changes in the validator queue are seen as an important barometer for gauging market sentiment. The logic behind this is that Ethereum's PoS, to ensure consensus stability, does not allow nodes to enter or exit arbitrarily. Instead, it uses a flow control mechanism to regulate the pace of staking and exit behaviors.

Therefore, when ETH's price is at a high stage, exit demand tends to accumulate. Some stakers may choose to cash out profits, but the potential selling pressure is not released instantly; instead, it is "stretched out" on-chain through the exit queue. When exit demand gradually dries up and is fully digested, it may indicate that a structural selling pressure is coming to an end.

From this perspective, the clearing of the current exit queue, coupled with the simultaneous rise in the entry queue, does constitute a noteworthy change. However, I believe that while this change appears to form a positive resonance on the surface, its impact on market prices—note, "impact"—is not equivalent to the "high exits, low entries" phase in September. This is because ETH entering the staking queue does not equate to "new funds actively buying ETH at the moment." A significant portion of the筹码 entering staking likely completed accumulation at an earlier stage and is only choosing to reallocate at the current time. Therefore, the rise in the staking queue reflects more a change in preference for long-term returns, network security, and the stability of staking rewards, rather than a significant strengthening of immediate price demand. This also means that the current improvement in queue structure is more about expectation repair than an equally strong boost to short-term prices.

Nevertheless, the significant growth in the current staking entry queue is still worth attention. The main driving force behind this comes from BitMine, the largest DAT treasury company for Ethereum. CryptoQuant data shows that BitMine has staked approximately 771,000 ETH in the past two weeks, accounting for 18.6% of its holdings of about 4.14 million ETH.

This means that this shift in staking trends is driven by a single large institution's asset allocation behavior, rather than a synchronized回暖 in overall market risk appetite. Therefore, it cannot be simply interpreted as a "return of全面看多 sentiment." However, in an emerging market like crypto, where liquidity distribution is uneven, the actions of large institutions are often more likely to, and can more easily, provide a certain degree of emotional support and expectation repair in the short term.

Whether this trend can continue or spread to a broader range of participants remains to be seen over time. But from on-chain fundamental data, several core metrics of Ethereum are simultaneously showing signs of marginal improvement.

From "Staking Changes" to "Coordinated Fundamental Improvement"

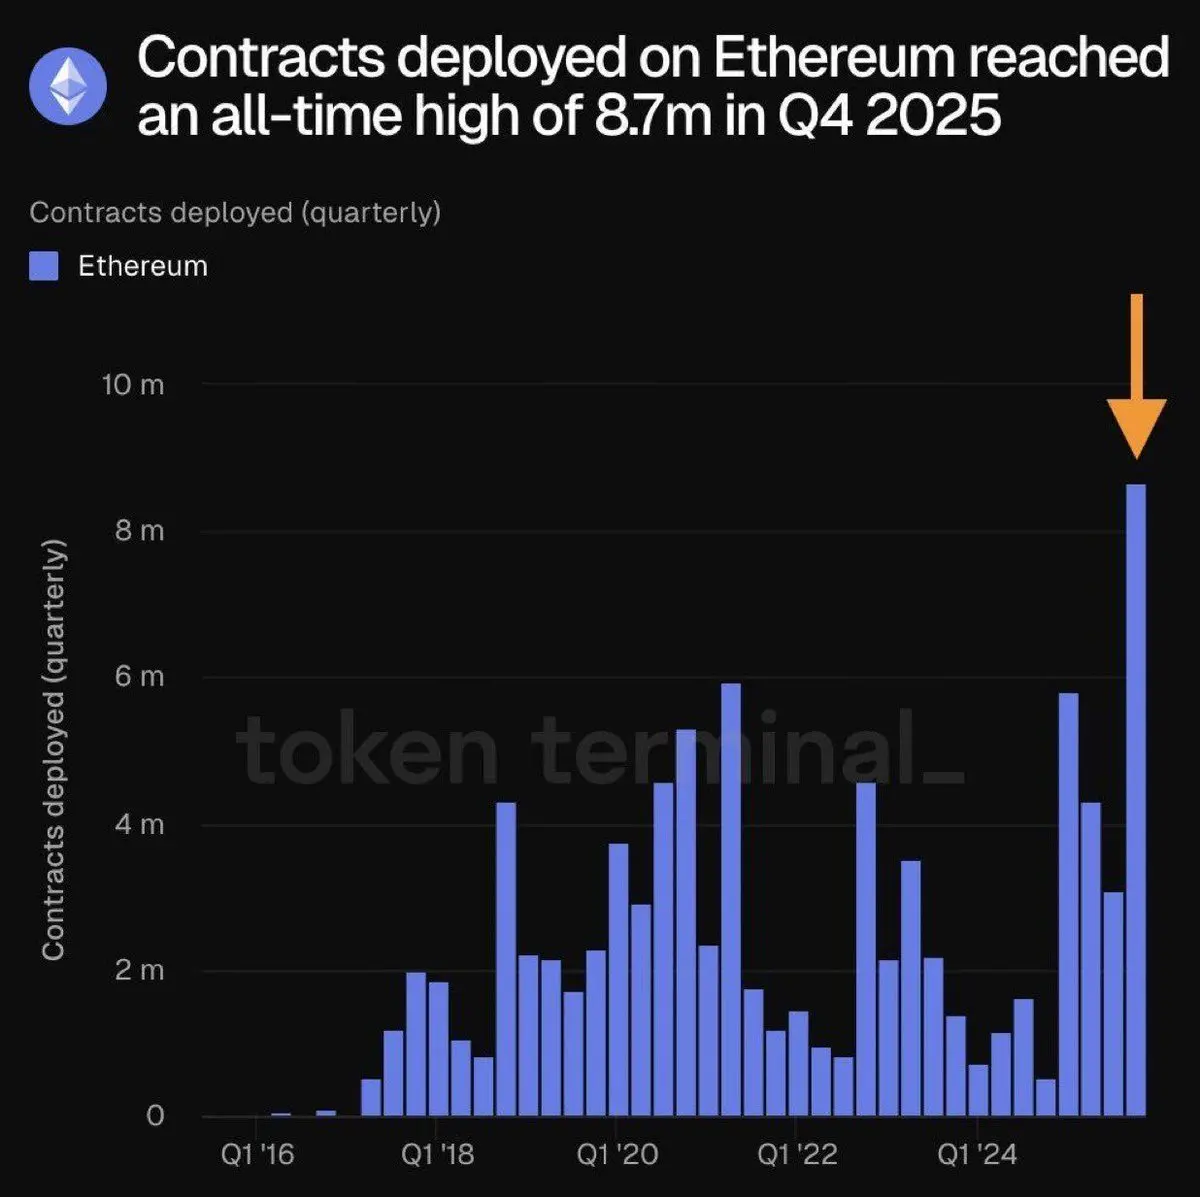
First, in terms of developers, Ethereum's development activity is hitting all-time highs. Data shows that in Q4 2025, Ethereum deployed approximately 8.7 million smart contracts, setting a new historical record for a single quarter. This change is closer to sustained product and infrastructure development rather than short-term speculative behavior. More contract deployments mean more DApps, RWA, stablecoins, and infrastructure are being launched, continuously strengthening Ethereum's role as a core execution and settlement layer.

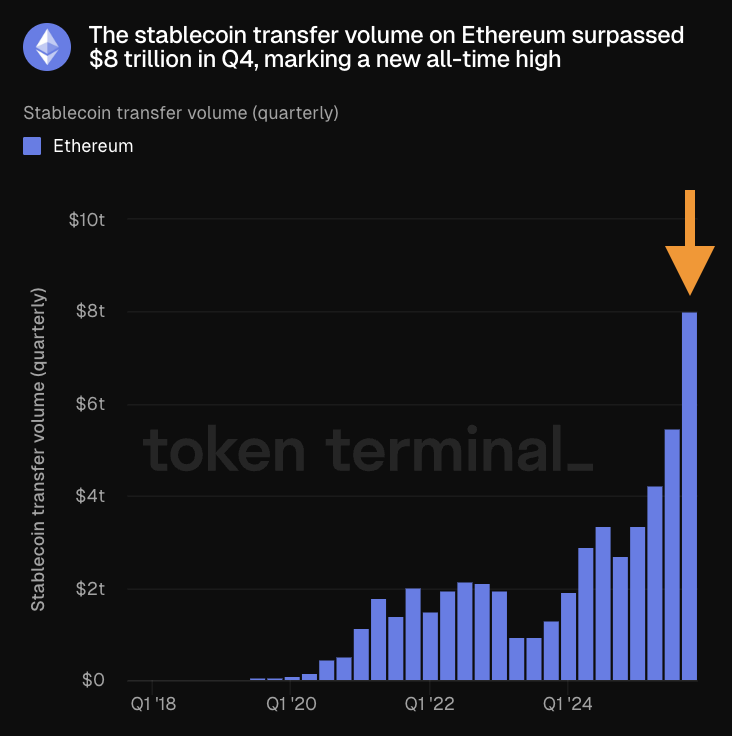
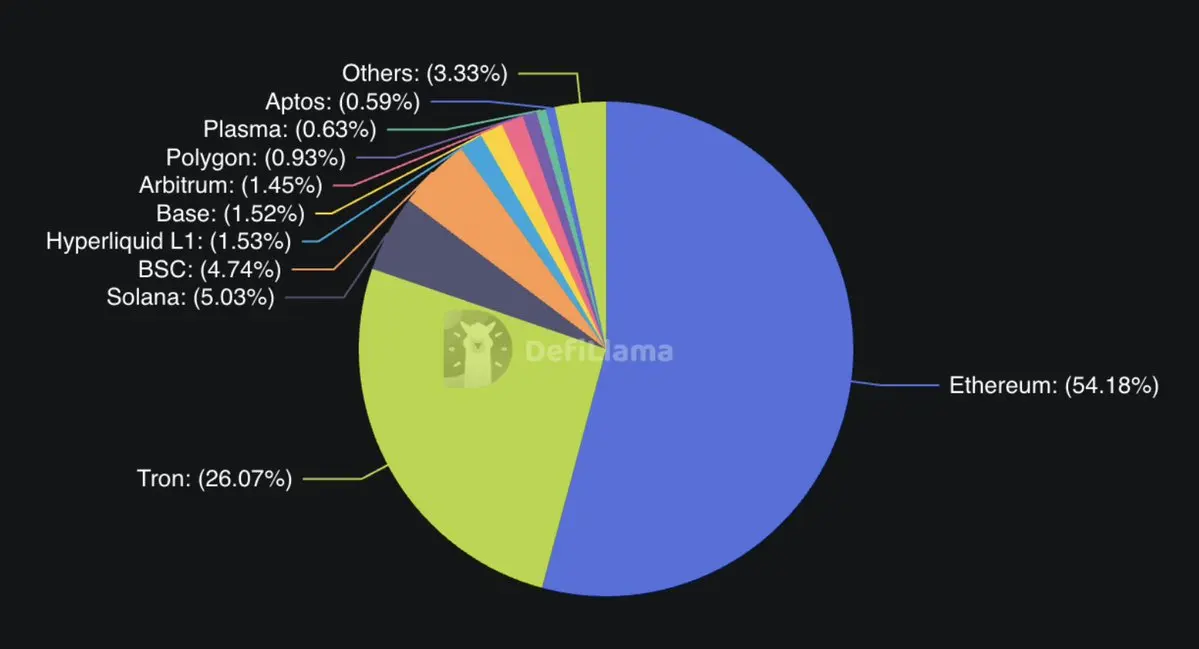
In the stablecoin sector, the on-chain transfer volume of stablecoins on Ethereum in Q4 exceeded $8 trillion, also setting a new historical record. In terms of issuance structure, Ethereum's advantage in the stablecoin ecosystem remains significant. Data shows that the share of stablecoin issuance on Ethereum is as high as 54.18%, far exceeding other mainstream blockchain networks like TRON (26.07%), Solana (5.03%), and BSC (4.74%).

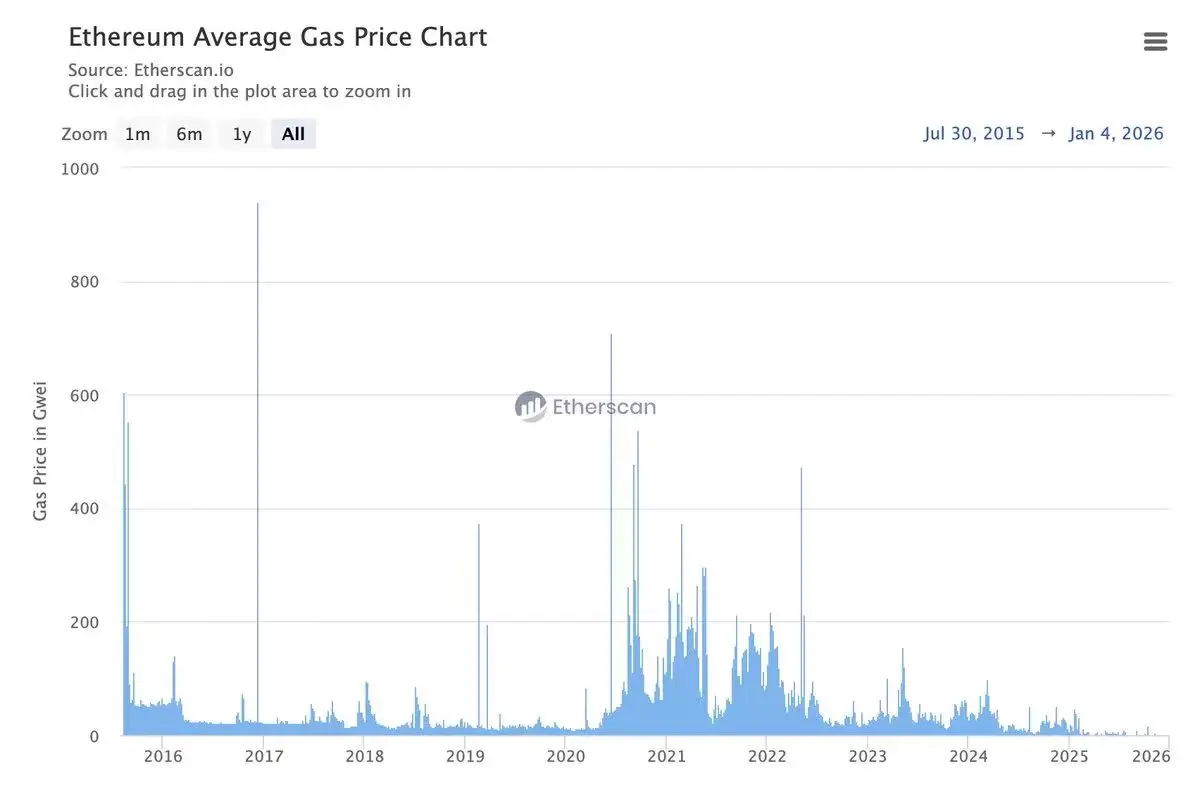
At the same time, Ethereum Gas fees have hit the lowest records since the mainnet launch and are continuously breaking records. In some periods, Gas fees were even below 0.03 Gwei. Considering that Ethereum will continue to推进 block扩容 this year, this trend has room to continue in the medium term. Lower transaction costs directly reduce the barrier to on-chain activity and provide a practical foundation for the continued expansion of the application layer.

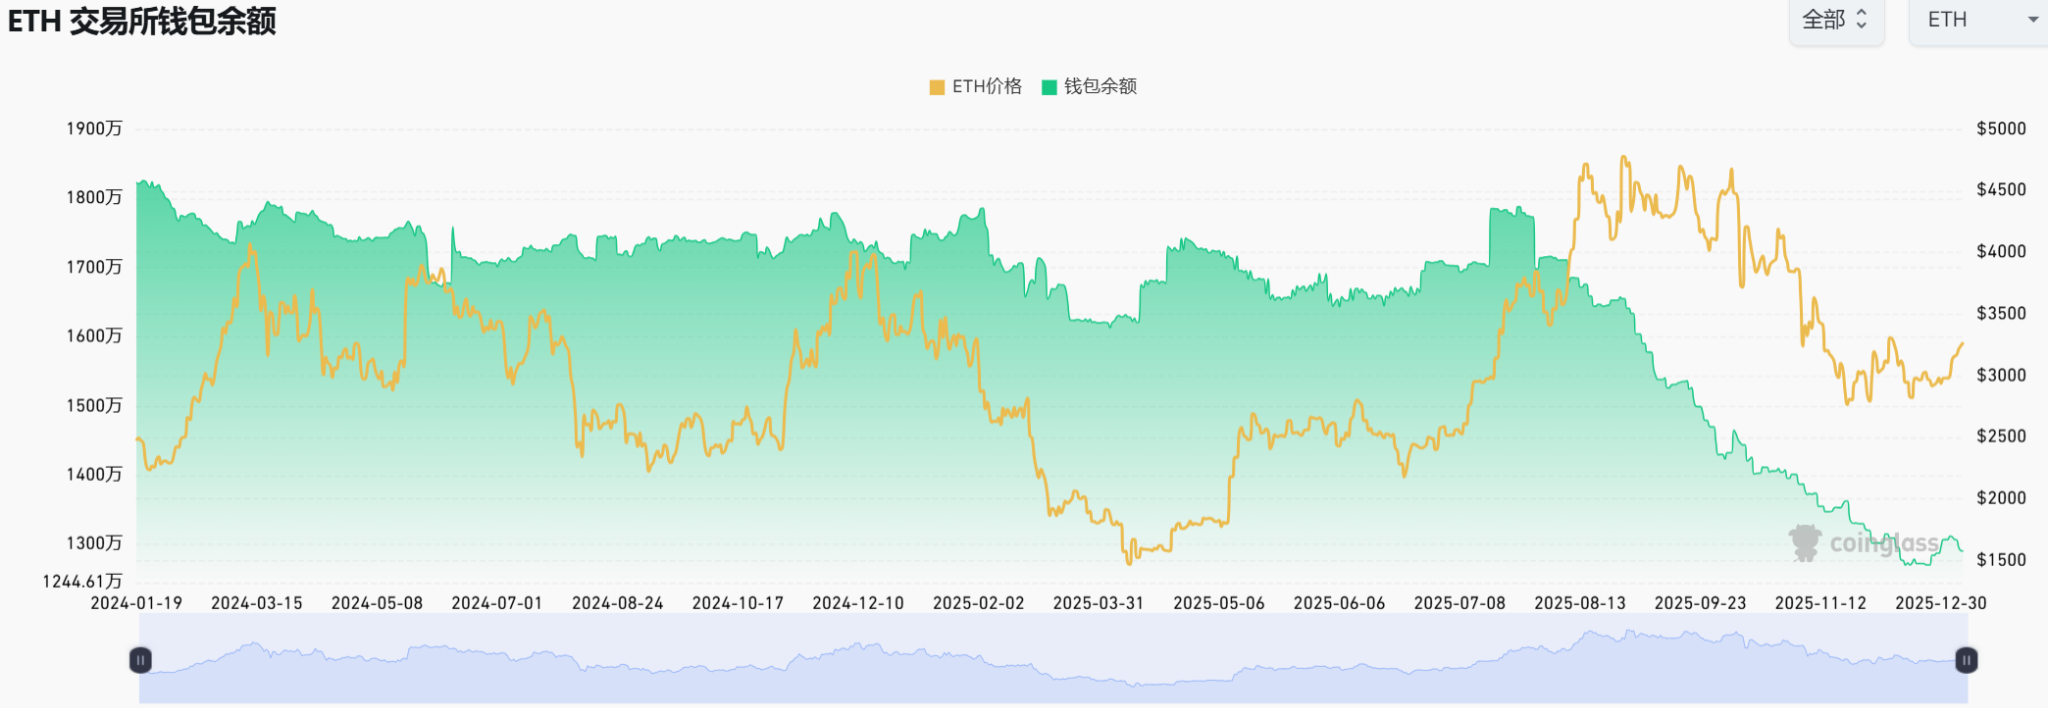
Looking at the exchange balance metric, Ethereum's potential selling pressure is also at a low level. In mid-December, Ethereum's exchange supply dropped to 12.7 million, the lowest level since 2016. Especially since August 2025, this metric has shown a significant decline of over 25%. Although exchange balances have slightly increased recently, the increment is only about 200,000 ETH, and the overall level remains in a historically low range, indicating weak selling意愿 among traders.

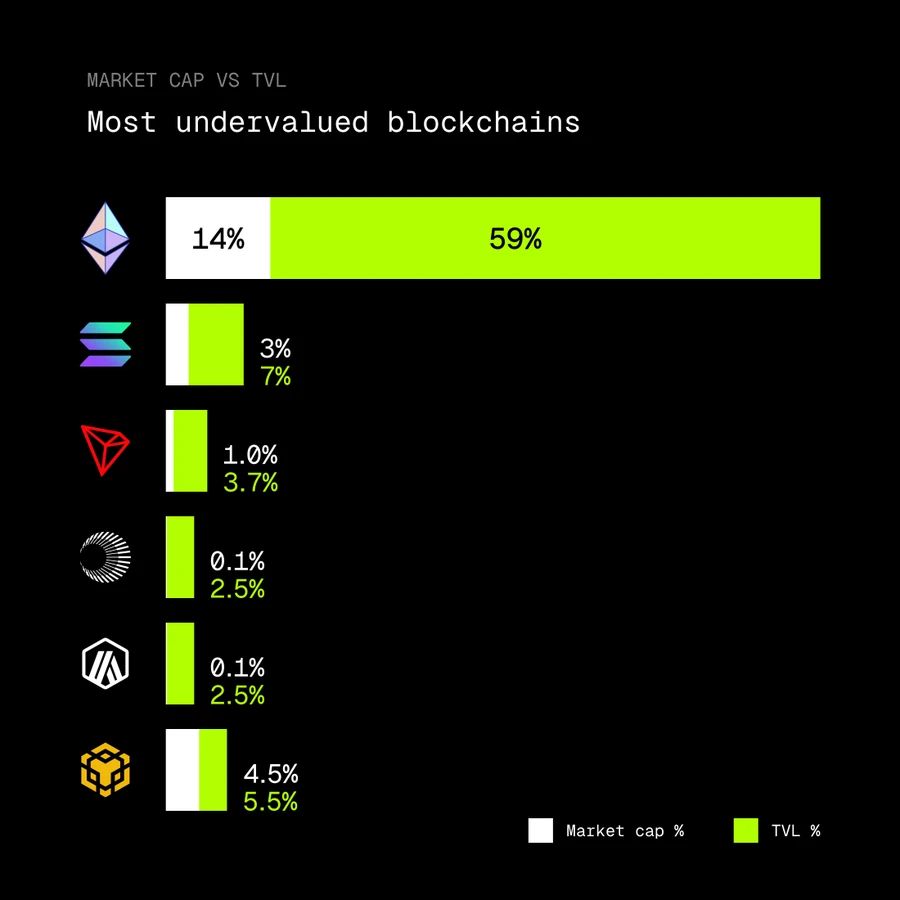
Additionally, crypto KOL rip.eth recently posted on X platform, pointing out that judging from the gap between Total Value Locked (TVL) and market capitalization, Ethereum might be the most undervalued blockchain network currently. Data shows that Ethereum carries 59% of the crypto market's TVL, but its token ETH's market share is only about 14%. In comparison, Solana's token market cap / TVL ratio is 3% / 7%, Tron's is 1% / 3.7%, and BNB Chain's is 4.5% / 5.5%. This, to some extent, reflects that there is still a significant misalignment between ETH's valuation and the scale of economic activity it supports.

Conclusion

Overall, changes in the staking queue may not be the "single variable" determining price trends. But when it improves simultaneously with metrics like developer activity, stablecoin usage volume, transaction costs, and exchange balances, it no longer presents an isolated signal but a more comprehensive fundamental picture.

For Ethereum, this might not be a sentiment-driven rapid reversal, but rather a process where the system is gradually restoring structural stability after undergoing a deep adjustment.

Related Questions

QWhat significant change occurred in Ethereum's staking queues on January 7th, and what does it indicate?

AOn January 7th, the exit queue for Ethereum staking was fully cleared, indicating that the prolonged period of exit pressure has been completely digested. Simultaneously, the entry queue saw a significant increase, with approximately 1.3044 million ETH waiting to enter staking, a reversal from the high exit and low entry trend observed in mid-September.

QHow does the change in staking queues relate to market sentiment, and is it a direct price signal?

AChanges in validator queues are seen as an important indicator of market sentiment. The clearing of the exit queue and the rise in the entry queue suggest a reduction in structural selling pressure and a shift in preference towards long-term yields and network security. However, it is not a direct price signal, as the increase in staking entries often represents earlier accumulated ETH being reallocated rather than new capital immediately buying ETH.

QWhat major institution drove the recent surge in Ethereum staking, and what was the scale of their activity?

AThe recent surge in Ethereum staking was primarily driven by BitMine, the largest DeFi Asset Token (DAT) treasury company. CryptoQuant data shows that BitMine staked approximately 771,000 ETH over the past two weeks, accounting for about 18.6% of its total holdings of 4.14 million ETH.

QWhat are some key Ethereum on-chain metrics showing marginal improvement alongside the staking changes?

AKey on-chain metrics showing improvement include: a record high in smart contract deployments with 8.7 million deployed in Q4 2025, Ethereum stablecoin transfer volume exceeding $8 trillion in Q4, record-low Gas fees (sometimes below 0.03 Gwei), and exchange balances hitting their lowest level since 2016, indicating reduced selling pressure.

QAccording to the article, how does Ethereum's valuation compare to its economic activity, and what does this suggest?

AAccording to analysis by rip.eth, Ethereum carries 59% of the total value locked (TVL) in the crypto market, but its token ETH only accounts for about 14% of the market capitalization. This significant disparity suggests that ETH may be undervalued relative to the scale of economic activity it supports, especially when compared to other chains like Solana, Tron, and BNB Chain.

Related Reads

Bitcoin Monthly Chart Adjustment Structure Established, HYPE Entry Opportunity Emerges | Exclusive Analysis

Bitcoin Monthly Correction Structure Confirmed, HYPE Entry Opportunity Emerges | Guest Analysis Last week's analysis correctly identified that the $60,000 level for Bitcoin was an intermediate point, not the bottom of the current correction. This was validated on June 5th when the price broke below this key support, dropping to around $59,100. The monthly-level a-b-c three-wave corrective structure from the October 2025 high of $126,200 is now fully established, with the market currently in the c-wave decline phase. The cumulative adjustment time is less than 35 days, indicating the structure is far from complete. This week's focus will be tracking the rebound's strength and resistance performance. The two key resistance zones of $65,000 and $69,500~$70,500 will be crucial observation points for determining the subsequent trend. For HYPE, last week's top warning signal was also validated, with the price falling up to 27% from its $75.87 high. The token has now entered a support zone, presenting a potential short-term entry opportunity. From a strategic standpoint, the medium-term outlook remains bearish, awaiting optimal timing to add short positions upon a rebound. **Key Trading Views Summary:** * **BTC:** The analysis maintains a bearish medium-term bias. Strategy involves building short positions on rebounds towards $65,000 or the $69,500~$70,500 resistance area. A break below the $59,000-$60,000 support could trigger additional short entries. Short-term trading (30% capital) focuses on range-bound opportunities. * **HYPE:** Following a confirmed correction from the $75.87 high, the short-term strategy shifts to "buying on dips." Consider light long positions (under 30%仓位) if the price finds support and shows stabilization signals in the $55-$57 or deeper $47-$49 support zones, contingent on confirming technical signals. The key resistance to watch is the $62.5-$64.57 area. **Risk Management Reminder:** Always set an initial stop-loss immediately upon opening a position. Move the stop-loss to breakeven upon achieving 1% profit, and subsequently trail it to lock in gains. Market conditions change rapidly; this analysis is for informational purposes only and not investment advice.

marsbit16m ago

Bitcoin Monthly Chart Adjustment Structure Established, HYPE Entry Opportunity Emerges | Exclusive Analysis

marsbit16m ago

Valuation Surpasses 200 Billion, Kimi Reportedly Raises 13.6 Billion More, Speeds Up Hong Kong IPO

Beijing-based AI unicoth MoonDark (Kimi) is reportedly in talks for a new funding round aiming to raise up to $20 billion (approximately RMB 136 billion), targeting a post-money valuation of $300 billion (approximately RMB 2.035 trillion). If successful, this would mark its third round in six months and a six-fold increase from its $43 billion valuation in December last year. Last month, the company completed a $20 billion funding round led by Meituan Longzhu, reaching a valuation exceeding $200 billion. According to reports, MoonDark has raised over RMB 376 billion across six rounds, making it the most funded large language model startup in China. Founded in 2023 by CEO Yang Zhilin, the company's core product is the Kimi AI Assistant. In April, it launched and open-sourced its flagship model, Kimi K2.6, which has demonstrated performance comparable to top models like GPT-5.4 in certain benchmarks. Recently, it began beta testing for Kimi Work, a local AI agent for knowledge workers. Commercially, the company's Annual Recurring Revenue (ARR) reportedly surpassed $2 billion in April. Regarding its IPO plans, Bloomberg reported in March that MoonDark is preparing for a listing in Hong Kong, though the process remains in early stages. The funding and IPO pace for leading Chinese AI firms has accelerated notably in 2026, mirroring global trends where companies like OpenAI and Anthropic are also setting new fundraising and valuation records. Securing substantial capital is becoming a critical factor in the competitive landscape alongside model capabilities.

marsbit20m ago

Valuation Surpasses 200 Billion, Kimi Reportedly Raises 13.6 Billion More, Speeds Up Hong Kong IPO

marsbit20m ago

South Korea's KOSPI Plunges 8.37% at Opening, Triggers Circuit Breaker: The 'Two Stocks' That Powered the Bull Market Recoil in a Single Day

On June 8th, South Korea's KOSPI index plunged 8.37% within minutes of market open, triggering a circuit breaker and halting trading. The crash was driven by a massive sell-off in heavyweight stocks Samsung Electronics and SK Hynix, which each fell 10%. These two chip giants alone account for over half of the KOSPI's total market capitalization and had contributed roughly 70% of the index's gains year-to-date, pushing it to become the world's sixth-largest stock market. The sell-off was ignited by negative guidance from U.S. chipmaker Broadcom on June 3rd, which sparked a global semiconductor stock rout. This shockwave hit South Korean markets on June 5th, with foreign investors leading a sustained exodus. The sharp decline on June 8th was exacerbated by high levels of retail margin debt (over 38 trillion KRW), forced liquidations, leveraged ETFs tied to the top stocks, and automated program trading, creating a vicious cycle. The Korean won also weakened significantly, further fueling foreign capital outflow. South Korean authorities issued emergency statements to calm markets, echoing recent warnings from the central bank governor about the risks of debt-driven investing. While some institutions like Goldman Sachs maintain long-term bullish targets for the KOSPI, the crash exposed the extreme market concentration and fragility behind its historic rally.

marsbit22m ago

South Korea's KOSPI Plunges 8.37% at Opening, Triggers Circuit Breaker: The 'Two Stocks' That Powered the Bull Market Recoil in a Single Day

marsbit22m ago

The Compounding Crisis in an Era of High Valuations: Is the US Stock Market Facing a New 'Lost Decade'?

This article analyzes the long-term structural risks in US equity markets, challenging the assumption that "time in the market" always ensures positive returns. Drawing on 155 years of historical data, it identifies three prolonged periods—1929-1954, 1966-1982, and 2000-2013—where real buy-and-hold returns were near zero or negative. Collectively, these "lost decades" represent roughly 35% of market history since 1871 and cause not just delayed wealth accumulation but permanent damage to compound growth paths due to the mathematics of recovering from significant drawdowns. Crucially, the authors argue that current conditions mirror historical precursors to such phases. Multiple valuation indicators, including the CAPE ratio (near its 99th percentile), the Buffett Indicator, and Tobin's Q, signal extreme overvaluation, historically associated with lower future 10-year real returns (averaging 3.6%). The paper debunks the common objection to tactical management—fear of missing the "best days" in the market—by showing that the vast majority of these top-performing days occur during bear markets and crises, often adjacent to the worst days. Therefore, avoiding major drawdowns inherently means missing these volatile surges. A key framework proposed involves monitoring market breadth (advance/decline data), which tends to deteriorate before major indices peak, providing an early warning signal. Combined with high valuations, breadth analysis offers a more robust risk-assessment tool. The conclusion for investors and advisors is not a forecast of an inevitable downturn, but a call to move from complacency to preparedness. The empirical evidence suggests that the conditions preceding lost decades are identifiable. A disciplined, adaptive strategy focused on valuation and breadth signals, rather than precise timing, can help protect long-term compounding from permanent impairment.

marsbit40m ago

The Compounding Crisis in an Era of High Valuations: Is the US Stock Market Facing a New 'Lost Decade'?

marsbit40m ago

Trading

Spot
Futures

Hot Articles

Discussions

Welcome to the HTX Community. Here, you can stay informed about the latest platform developments and gain access to professional market insights. Users' opinions on the price of ETH (ETH) are presented below.

活动图片