Dogecoin nears $0.088 support – But THESE signals hint at downside

ambcryptoPublished on 2026-03-23Last updated on 2026-03-23

Abstract

Dogecoin (DOGE) is nearing a critical support level at $0.088, with recent on-chain activity showing increased transfers and transactions, yet failing to boost its price. This is attributed to a distribution phase, where whale inflows into exchanges have created selling pressure. Market sentiment remains bearish due to global tensions, affecting both crypto and stock markets. Bitcoin's drop below $70,000 has added to the downward pressure. Technical indicators like the RSI at 35 confirm bearish momentum, though the CMF suggests slightly easing outflows. A cluster of long liquidations between $0.084 and $0.088 could drive prices lower, potentially testing $0.086. A break below this level would weaken bullish prospects, while a hold could set the stage for a recovery.

Dogecoin [DOGE] witnessed an increase in onchain activity recently. It was reported that both the Daily Transfer Volume and the Transaction Count numbers were elevated, but failed to translate into any notable price gains.

This was likely because DOGE was going through a distribution phase.

AMBCrypto reported that whale flows into exchanges translated into immediate sell pressure. This pushed prices further toward the month-long range lows at $0.0887.

What can happen at the Dogecoin range lows?

Generally, one would expect a bullish reaction at the lows of a range.

At the same time, the market sentiment was once more in extreme despair. Worries of escalation in the US-Iran conflict and a worsening energy crisis have already sent Asian stock markets reeling.

Bitcoin [BTC] faced profit-taking pressure and has slumped below the $70k psychological support. In these settings, Dogecoin bulls will have a tough time sparking a price rally.
Source: DOGE/USDT on TradingView

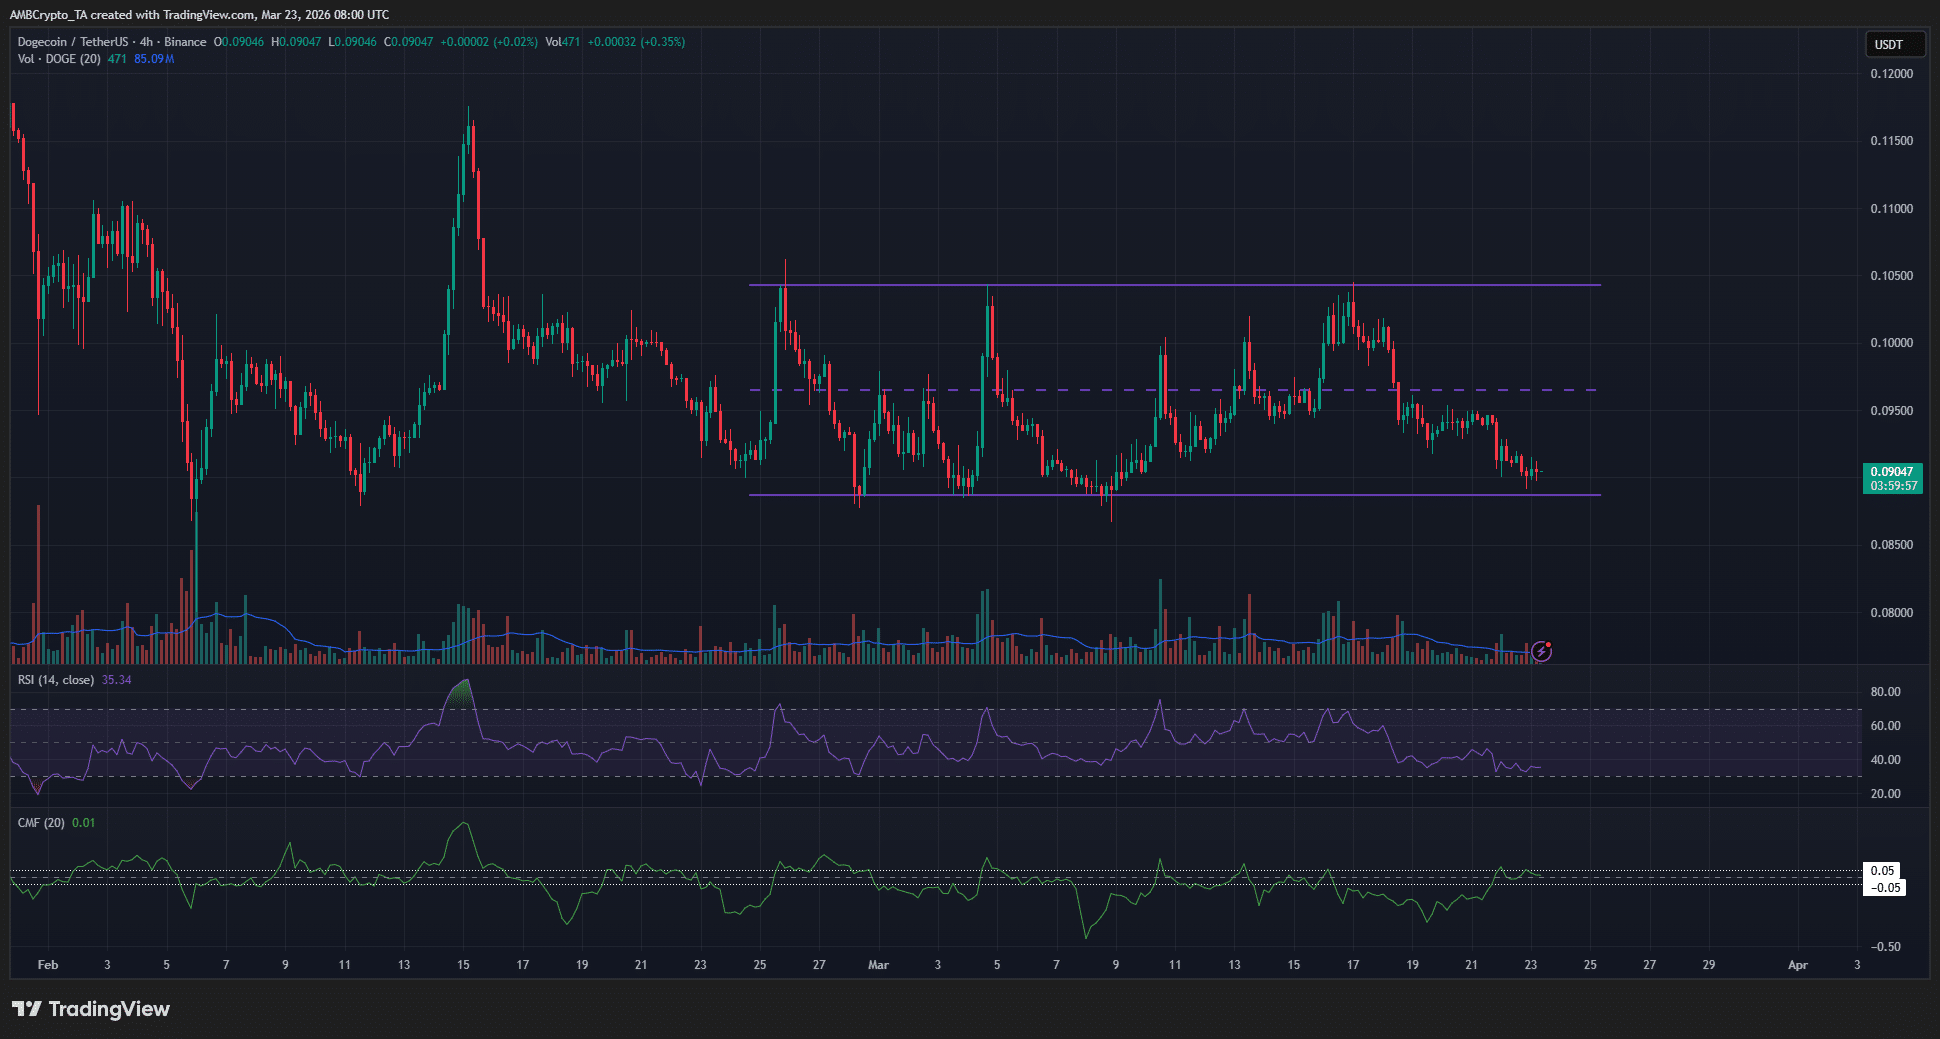
The range extended from $0.0887 to $0.104, with the mid-point at $0.0965. The $0.088 area has had added importance as a support level since the first week of February.

The RSI on the 4-hour chart was at 35, indicating bearish momentum was prevalent.

On the other hand, the CMF was at +0.01. It had climbed higher within the past week to signal easing capital outflows as the price approached a key local support.

It is unclear if this is enough for the bulls to initiate a move toward the range highs. It would depend on Bitcoin and the crypto market sentiment, which also hinges on the global investor sentiment.

Traders’ call to action- Brace for a sweep of the local lows
Source: CoinGlass

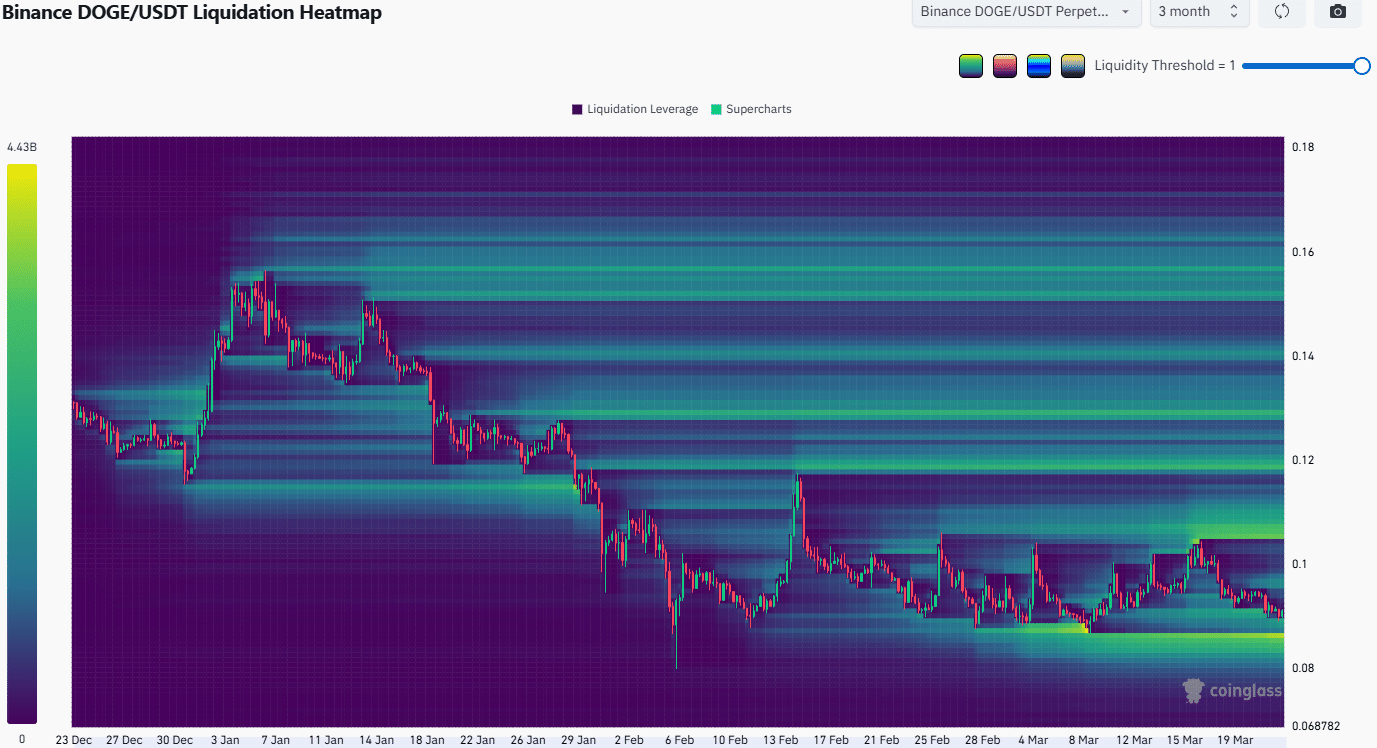
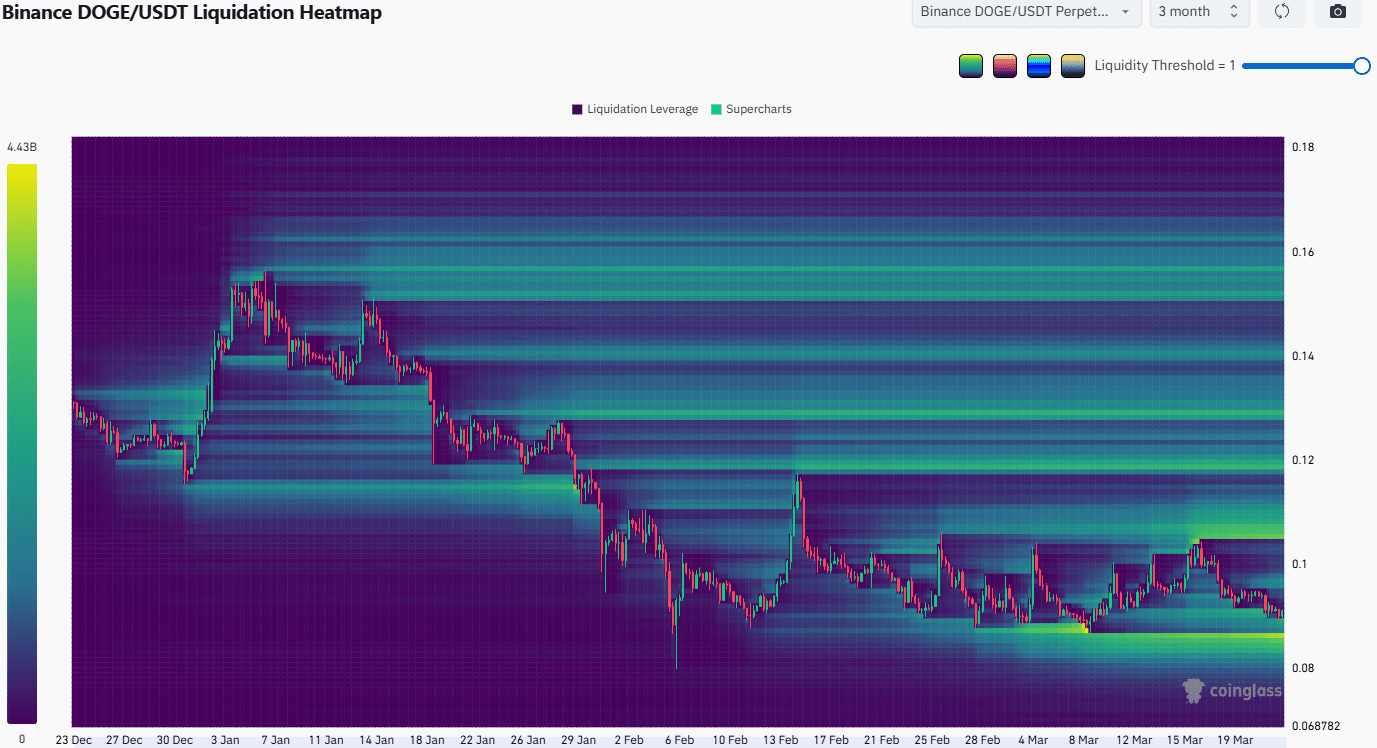
The 3-month Liquidation Heatmap showed that the $0.084-$0.088 was a nearby cluster of long liquidations. They have built up over the past three weeks and could pull prices lower.

Such a liquidity sweep, combined with the range lows as support, could give DOGE a platform for recovery. On the other hand, a slide below $0.086 would make the bulls’ position more tenuous.


Final Summary

  • Dogecoin swiftly approached a key local support as the crypto and stock markets experienced extreme fear.
  • The combination of the month-long range lows and a cluster of long liquidations could see DOGE prices pushed to $0.086 soon.


Related Questions

QWhat key support level is Dogecoin approaching according to the article?

ADogecoin is approaching the key support level at $0.0887, which is the month-long range low.

QWhat two on-chain metrics increased for DOGE but failed to result in price gains?

AThe Daily Transfer Volume and the Transaction Count numbers increased but failed to translate into any notable price gains.

QWhat does the RSI value of 35 on the 4-hour chart indicate about Dogecoin's momentum?

AThe RSI value of 35 indicates that bearish momentum was prevalent.

QAccording to the liquidation heatmap, what price zone is a cluster of long liquidations that could pull prices lower?

AThe $0.084-$0.088 zone is a nearby cluster of long liquidations that could pull prices lower.

QWhat two broader market conditions are mentioned as reasons why Dogecoin bulls will have a tough time sparking a rally?

AWorries of escalation in the US-Iran conflict and a worsening energy crisis, which have sent Asian stock markets reeling, and Bitcoin facing profit-taking pressure and slumping below the $70k support.

Related Reads

Why Bitcoin Holds Above $64,000 After Fed's Hard Pause

**Bitcoin Stabilizes Near $64,000 Following Hawkish Fed Pause** The cryptocurrency market, led by Bitcoin, remained stable around $64,000 despite a volatile reaction to the latest U.S. Federal Reserve meeting. The Fed paused interest rates but signaled a hawkish stance, with three committee members voting for an increase—the highest dissent since 2016. This limits risk appetite but hasn't triggered panic selling. Key market highlights include Bitcoin ETFs seeing a net inflow of $32.1 million, breaking a streak of outflows, while Ethereum ETFs experienced outflows of $18.65 million. Liquidations affected about 90,000 traders. Technically, Bitcoin finds support around $63,000-$63,500, with major resistance near $66,000. While its price is about 49% below its all-time high, institutional demand via ETFs and the absence of mass capitulation support a potential recovery scenario in the second half of the year. Major altcoins showed mixed movements, with Solana attracting capital while Ethereum faced selling pressure despite strong on-chain metrics like a growing staking queue. Regulatory news took a pause as the U.S. Senate delayed the CLARITY Act vote until at least autumn. For the final trading day of July, U.S. inflation and consumer spending data will be crucial. Bitcoin's key levels to watch are $63,000 support and $66,000 resistance. Sustained ETF inflows and Bitcoin holding above $63,000 are seen as positive signs for a potential market recovery later in the year.

cryptonews.ru2h ago

Why Bitcoin Holds Above $64,000 After Fed's Hard Pause

cryptonews.ru2h ago

Trading

Spot
活动图片