
Dogecoin recently broke below the key support level of $0.1400 against the US dollar, initiating a new round of decline. The price is currently trading below $0.1380 and the 100-hour simple moving average, indicating a generally weak trend.
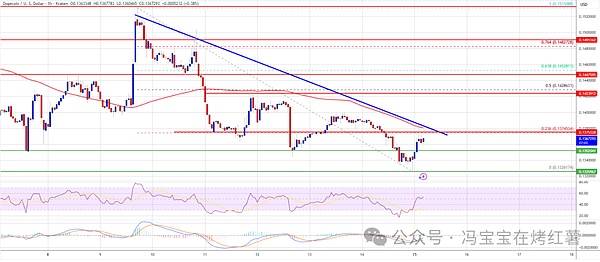
On the hourly chart, DOGE is forming a key descending trendline with resistance near $0.1375.
If the price fails to reclaim the $0.1400 and $0.1420 levels effectively, the downward trend may continue. Previously, Dogecoin followed Bitcoin and Ethereum in a synchronized pullback, hitting a low of $0.1326 before a slight rebound near the 23.6% Fibonacci retracement level of the recent decline.
The immediate resistance is at $0.1380, followed by the trendline resistance at $0.1375. A break above $0.1400 could see the next resistance at $0.1425 (50% Fibonacci retracement level). Holding above this level might lead to a test of the $0.1450 and $0.1500 resistance zones, with key resistance at $0.1550.
If the rebound lacks strength and fails to break above $0.1400, the price may decline again. Key support levels to watch are $0.1340, $0.1325, and the critical $0.1300 level. A break below $0.1300 could lead to a short-term decline toward the $0.1250–$0.1240 area.
Technical indicators show that the hourly MACD remains in the bearish zone and continues to weaken, while the RSI is slightly above 50, suggesting potential short-term consolidation.
Key Levels
Major Support: $0.1340, $0.1300;
Major Resistance: $0.1400, $0.1420;