Data Estimates Show Polymarket's Annual Revenue Could Easily Exceed 100 Million, Under the Assumption That...

marsbitPublished on 2026-01-28Last updated on 2026-01-28

Abstract

Polymarket, a prediction market platform, has begun charging fees on its "15-minute crypto up/down" markets since January 6, with a variable rate structure where fees are higher when odds are near 50% (up to 1.56%) and lower near 0% or 100%. After three weeks of implementation, data shows the platform has accumulated approximately $2.19 million in fee revenue, averaging about $730,000 per week. This translates to a projected annual revenue of around $38 million if current trading activity remains stable. The platform is expected to extend this fee model to other markets beyond crypto price movements. Analysis of the past week’s trading volume shows that the "15-minute crypto up/down" segment accounted for $159 million, or about 9.1% of Polymarket’s total weekly volume of $1.75 billion. If similar fees were applied across all markets, the platform revenue could theoretically reach around $418 million annually. It is important to note that these are estimates based on limited data and current trading behavior. Actual revenue may vary due to factors such as future growth, potential adjustments to fee structures, and differences in user activity across market types. Nevertheless, the move demonstrates Polymarket’s transition toward a sustainable revenue model, with significant growth potential ahead, especially with major events like the 2026 World Cup and U.S. midterm elections likely to drive further engagement.

Original | Odaily Planet Daily (@OdailyChina)

Author | Azuma (@azuma_eth)

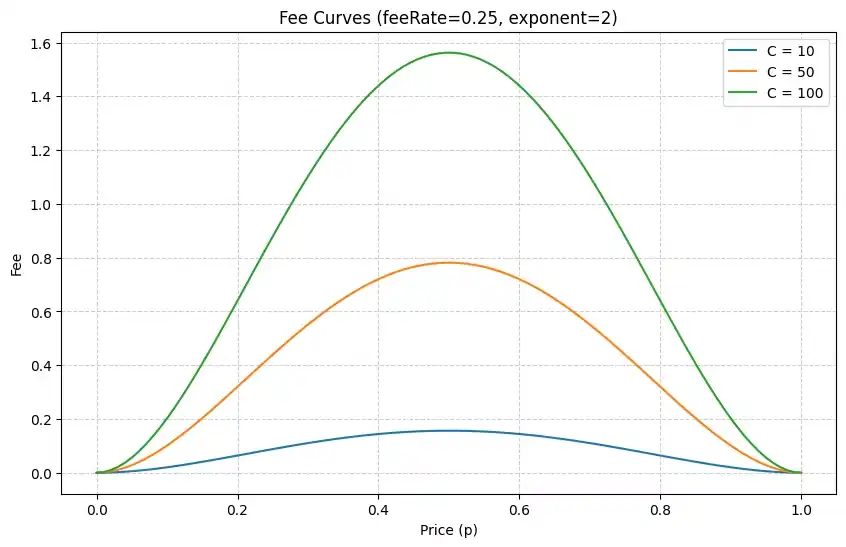
On January 6th of this year, Polymarket officially began charging transaction fees for markets related to "15-minute cryptocurrency price movements." The specific fee rate varies with the real-time odds of the market — the closer the odds are to 0% or 100%, the lower the fee; conversely, the closer the odds are to 50%, the higher the fee, with a maximum of 1.56%.

This marks the first time, outside of the U.S. market (where Polymarket charges a 0.01% fee), that Polymarket has ended its completely free model and started charging transaction fees for a specific type of market. Now, three weeks later, there is a sufficient observable data sample, making it time to conduct a rough estimate of Polymarket's revenue potential.

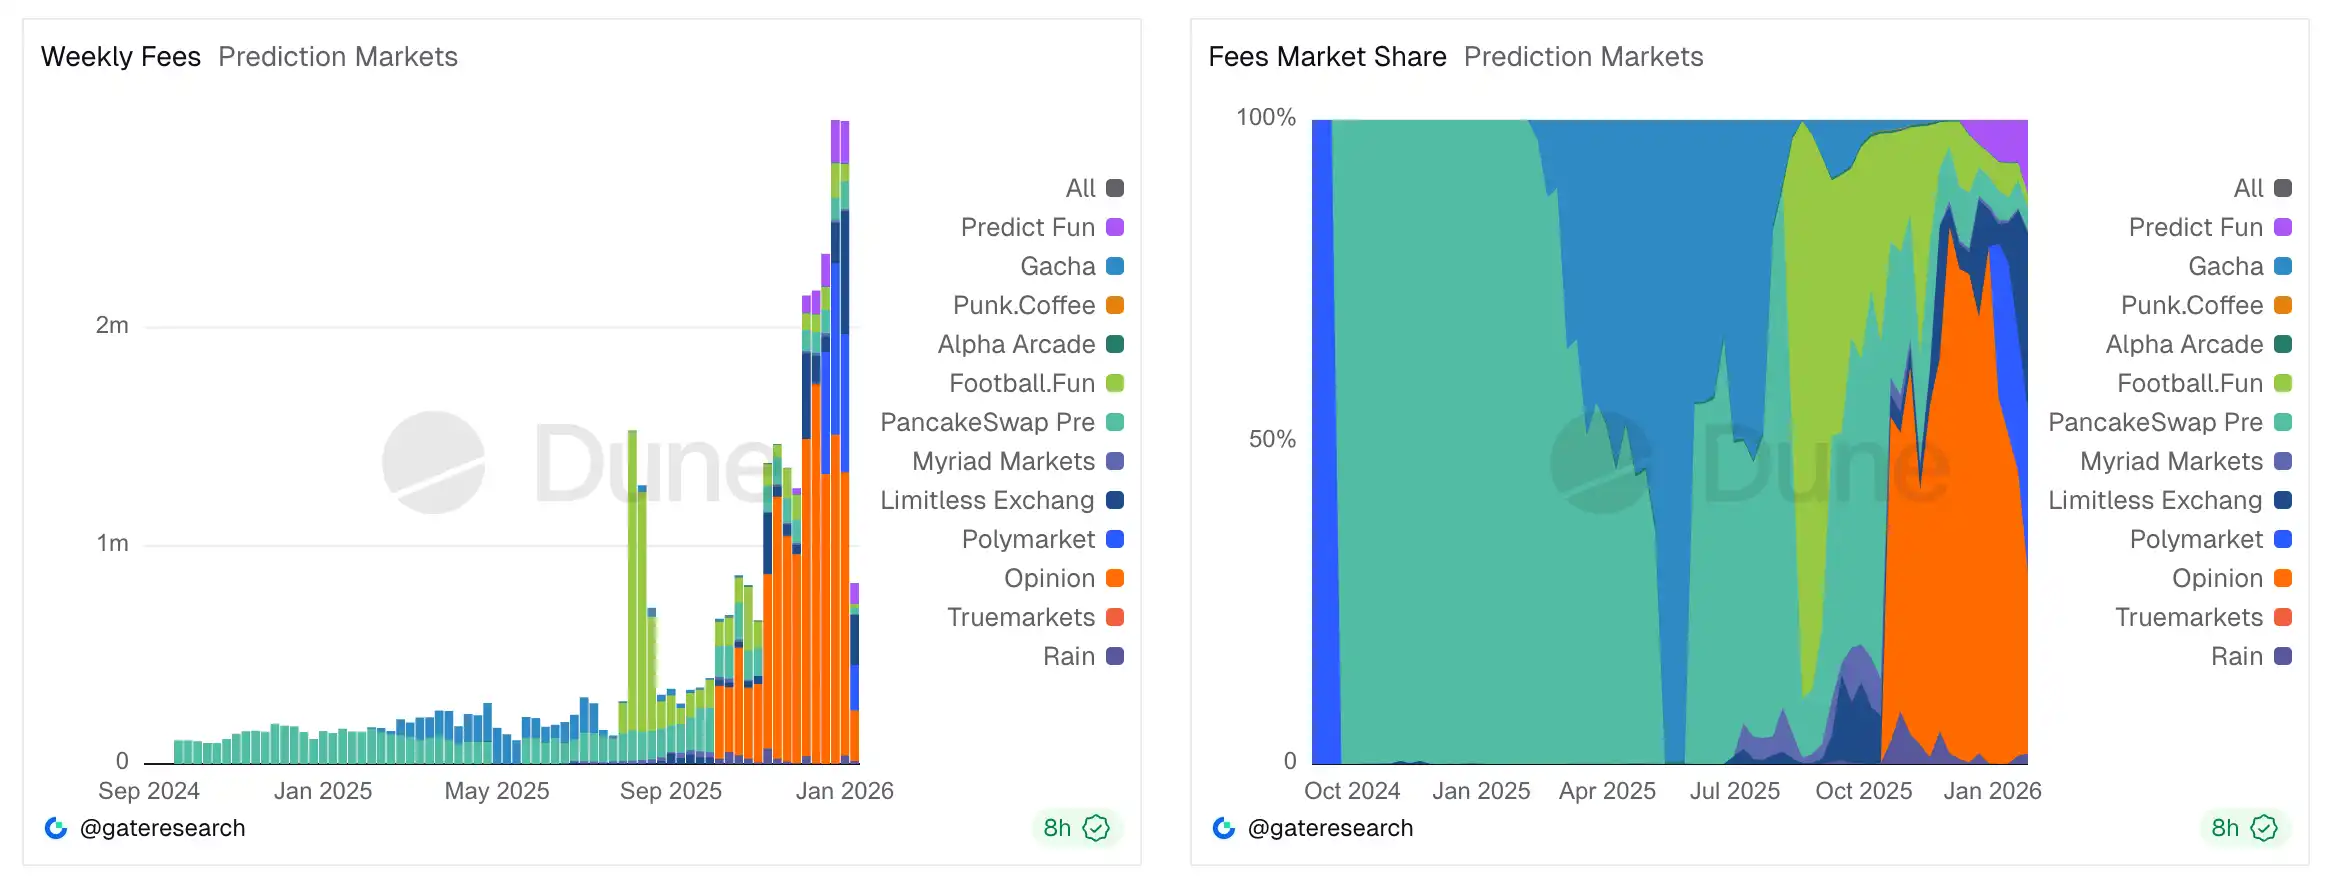
First, let's look at the most direct measure: the scale of fee revenue. According to data compiled by Gate Research on Duna, since the introduction of these fees, Polymarket has accumulated approximately $2.19 million in fee revenue, averaging about $730,000 per week. Based on this data, if the trading volume and activity structure of the relevant markets remain unchanged, it is projected to generate approximately $38 million in annual revenue for Polymarket.

It is foreseeable that Polymarket's fee-charging scope will not be limited to just the "15-minute cryptocurrency price movements" category. Prior to officially charging fees for this category, Polymarket had long maintained a completely free model while also subsidizing market liquidity out of its own pocket. At the end of last year, Coplan himself admitted that Polymarket was operating at a loss... But we have seen too many such "burning cash" stories in the internet market. As Polymarket's user habits and market position gradually solidify, it would not be surprising to see fees introduced for more markets in the future.

  • Odaily Note: For more on Polymarket's revenue issues, refer to Odaily's recent Tea Talk column "Odaily Editorial Tea Talk (January 7th)."

Assuming Polymarket continues to apply the current fee standards to other markets in the future, we might gauge the theoretical revenue ceiling for Polymarket at the current trading volume level by comparing the trading volume of the "15-minute cryptocurrency price movements" market with Polymarket's total platform trading volume. The more markets that charge fees, the higher the revenue.

Data obtained by Odaily shows that the total trading volume of the "15-minute cryptocurrency price movements" market on Polymarket over the past week was approximately $159 million (among the four major tokens, BTC accounted for $114 million, ETH for $30.29 million, SOL for $8.93 million, and XRP for $5.73 million). This represents about 9.1% of Polymarket's total trading volume of approximately $1.75 billion over the past week. Based on this ratio, if Polymarket introduces a similar fee model across all markets under the current trading volume and structure, it is projected to generate $418 million in annual revenue for the platform.

It should be noted that the above are all estimates by Odaily based on historical data. In reality, Polymarket's actual revenue situation will inevitably deviate due to various variables — first, Polymarket has only been charging fees for three weeks, so the sample size is still relatively small; second, Polymarket may not adopt a similar fee mechanism for other markets, and differences in user trading habits across markets will also lead to variations in the final fee results under a dynamic fee mechanism; third, and most crucially, Polymarket is still in a strong growth phase. It is expected that with the further popularization of the prediction market concept, coupled with potential highlights like the 2026 World Cup and mid-term elections, the platform's trading volume will continue to grow in the future.

Even considering these uncertainties, one trend is already quite clear — Polymarket is demonstrating the revenue potential of this entirely new format of prediction markets. It is no longer just a novel innovative concept but a truly sustainable, self-generating business with immensely imaginative profit space.

Related Questions

QWhat is the estimated annual revenue Polymarket could generate from its current fee structure on '15-minute crypto up/down' markets, based on recent data?

ABased on recent data, Polymarket is estimated to generate approximately $38 million in revenue annually from its fee structure on '15-minute crypto up/down' markets, assuming trading volume and activity remain constant.

QWhat was the article's method for estimating Polymarket's potential total annual revenue if fees were applied to all markets?

AThe article estimated potential total annual revenue by comparing the trading volume of the '15-minute crypto up/down' markets (9.1% of total volume) to the platform's total weekly trading volume ($1.75 billion). It then scaled the current fee revenue from that segment proportionally, projecting an annual figure of approximately $418 million.

QAccording to the article, what is a key factor that could lead to even higher future revenue for Polymarket beyond current estimates?

AA key factor for potential higher future revenue is Polymarket's strong growth trajectory. The article specifically mentions the further popularization of the prediction market concept and potential major events like the 2026 World Cup and midterm elections as catalysts for continued increases in platform volume.

QHow does Polymarket's fee structure for the '15-minute crypto up/down' markets work?

AThe fee varies with the real-time odds of a market. Fees are lower when the odds are closer to 0% or 100% and higher when the odds are closer to 50%, with a maximum fee of 1.56%.

QWhat significant change did Polymarket implement on January 6th regarding its business model?

AOn January 6th, Polymarket began charging trading fees on its '15-minute cryptocurrency up/down' markets. This marked the first time the platform ended its completely free model for a specific market type outside of the US (which has a separate 0.01% fee).

Related Reads

The Value Distribution of Stablecoins

**Summary: The Value Distribution of Stablecoins** The article argues that stablecoins are evolving from mere trading tools into broader channels for dollar access. It divides the stablecoin ecosystem into four layers to analyze how value is distributed: 1. **Issuance Layer:** Mints stablecoins, holds reserve assets, and captures the spread between reserve yield and user costs (e.g., Tether, Circle). This layer currently earns the largest profit margin. 2. **Infrastructure Layer:** Connects stablecoins to the traditional financial system, handling fiat on/off-ramps, banking integration, compliance (KYC/AML), and asset management (e.g., Bridge, BVNK). This is the "unglamorous" but critical work, building the essential bridges between crypto and real-world finance. 3. **Acquiring/Distribution Layer:** Integrates stablecoins into merchant systems, manages payment flows, and provides enterprise financial software (e.g., Stripe, Coinbase). They act as the access point for businesses. 4. **Application Layer:** The end-users and businesses that ultimately use stablecoins for payments, settlements, or as a store of value. They benefit from convenience but have little pricing power. The core thesis is that while the issuance layer currently dominates profits, the often-overlooked **infrastructure layer holds significant long-term potential**. The real challenge and barrier to mass adoption is not the on-chain transfer of stablecoins (which is simple), but the complex "last mile" integration into existing business workflows, banking systems, and regulatory frameworks across different countries. Companies in this layer are currently in a "land grab" phase, investing heavily to build networks, secure bank partnerships, and establish compliance pathways. While their position is currently pressured by the profitable issuers above and distribution platforms below, the article suggests that if stablecoins become a default financial rail for businesses, the infrastructure providers who have done the hard work of integration will ultimately gain strong pricing power and become entrenched, essential players.

marsbit6h ago

The Value Distribution of Stablecoins

marsbit6h ago

The Value Distribution of Stablecoins

The Value Distribution of Stablecoins The article argues that stablecoins are evolving from a mere trading tool into a broad "dollar channel." It analyzes the industry's value chain through four layers: 1. **Issuance Layer (e.g., Tether, Circle):** The top layer that mints stablecoins, holds reserve assets, and captures the thickest interest rate spread. 2. **Infrastructure Layer (e.g., Bridge, BVNK):** Connects stablecoins to the traditional financial system, handling critical but complex "dirty work" like fiat on/off-ramps, banking integration, compliance (KYC/AML), and cross-border settlement. 3. **Acquiring/Distribution Layer (e.g., Stripe, Coinbase):** Embeds stablecoins into merchant systems, manages payment flows, and integrates with enterprise software. 4. **Application Layer:** End-users and businesses that ultimately use stablecoins for payments, settlement, or storing value. The author posits that while the issuance layer currently captures the most profit, the most overlooked and potentially critical layer is infrastructure. The core challenge for stablecoin adoption isn't the on-chain transfer (which is simple), but bridging the gap between blockchain and the real-world financial system. This involves solving practical problems for businesses: fiat conversion, reconciliation, tax handling, and user onboarding. Infrastructure companies are currently in a difficult "land-grab" phase—building networks, securing banking relationships, and achieving compliance country-by-country. They face pressure from both the profitable issuance layer above and distribution platforms below. However, the author suggests this layer is building a crucial moat. Once stablecoins become a default business rail, the infrastructure players who have done the hard work of integration may gain significant, durable value and pricing power.

链捕手6h ago

The Value Distribution of Stablecoins

链捕手6h ago

Trading

Spot
Futures
活动图片