Data: 90% of Crypto Protocols Generate Revenue, But Less Than 1% Disclose Market Maker Terms

marsbitPublished on 2026-04-15Last updated on 2026-04-15

Abstract

Survey of 150 major crypto protocols reveals that while 91% generate on-chain revenue, only 8% publish investor reports, and less than 1% disclose market maker agreements. The data indicates a significant communication gap rather than a lack of available information, as third-party platforms cover 72% of protocols. DeFi protocols, particularly DEXs and lending platforms, lead in transparency, while L1 and infrastructure projects lag despite larger market capitalizations. Only 13 protocols have adopted the Token Transparency Framework since its introduction in June 2025. Additionally, 38% of protocols feature active value accumulation mechanisms, which correlate with approximately 19% higher annual returns compared to governance-only tokens. The findings highlight a structural disconnect between institutional investor expectations and current disclosure practices in the crypto industry.

Author: Novora

Compiled by: Deep Tide TechFlow

Deep Tide Intro: Among 150 leading protocols, 91% generate on-chain revenue, but only 8% publish investor reports, and less than 1% disclose market maker terms. The data is all on-chain, and third-party platforms also cover it, but protocols simply aren't packaging it for institutional view. This is not a data availability issue, but more of a communication gap.
Disclosure Rate

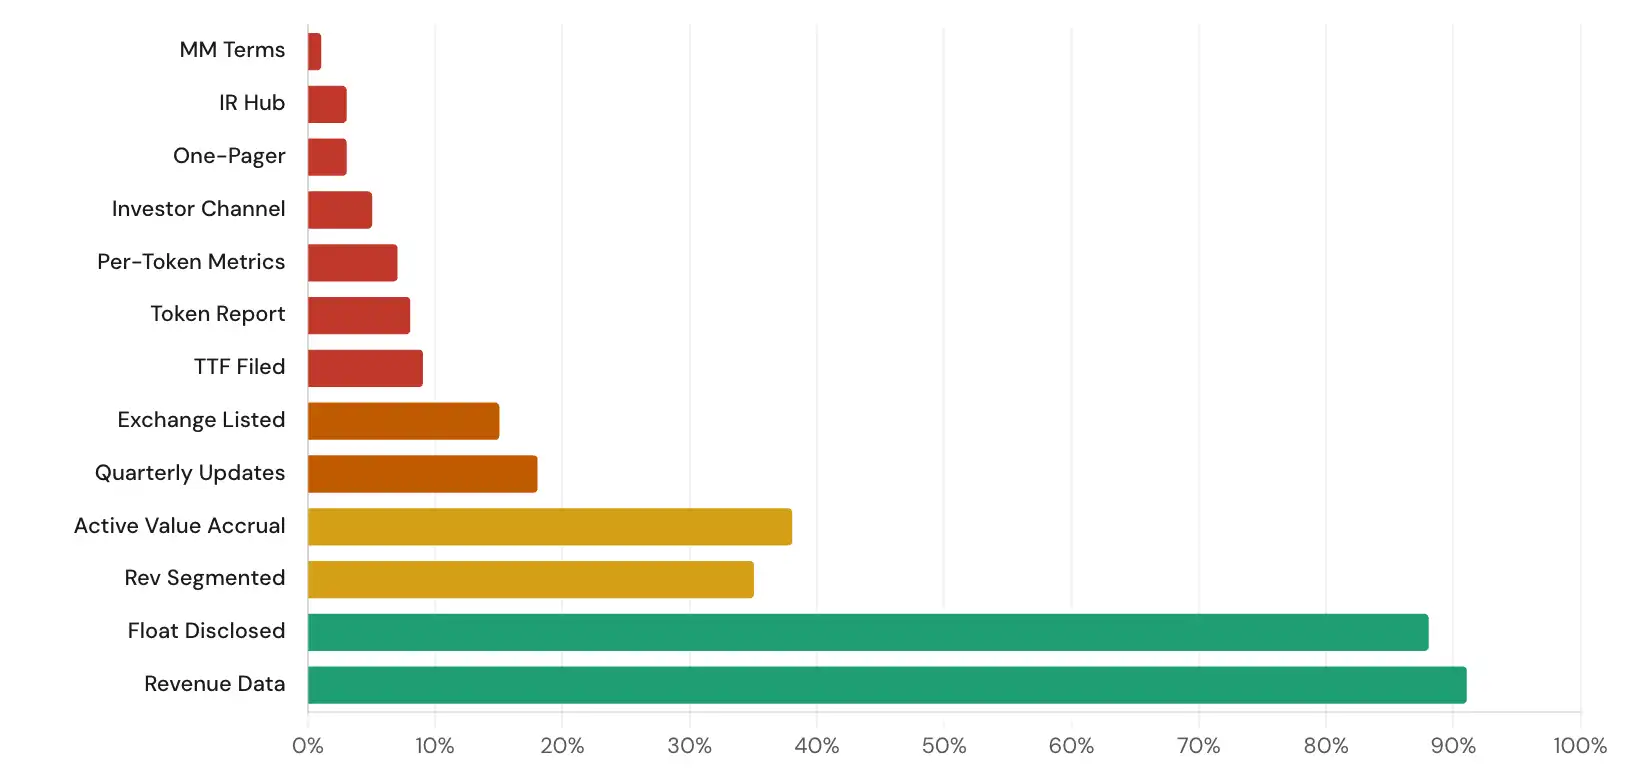
We evaluated 13 disclosure metrics across 150+ protocols. The gap between what traditional markets require for disclosure and what crypto protocols voluntarily provide is structural, not accidental.

Less than 1% of protocols disclose market maker terms. In traditional stock markets, market maker agreements are standard disclosure items filed with exchanges. In crypto, Meteora was the only protocol in our entire 150+ dataset that publicly disclosed information about its market making arrangements, via its 2025 Annual Token Holder Report.
Third-Party Data Coverage

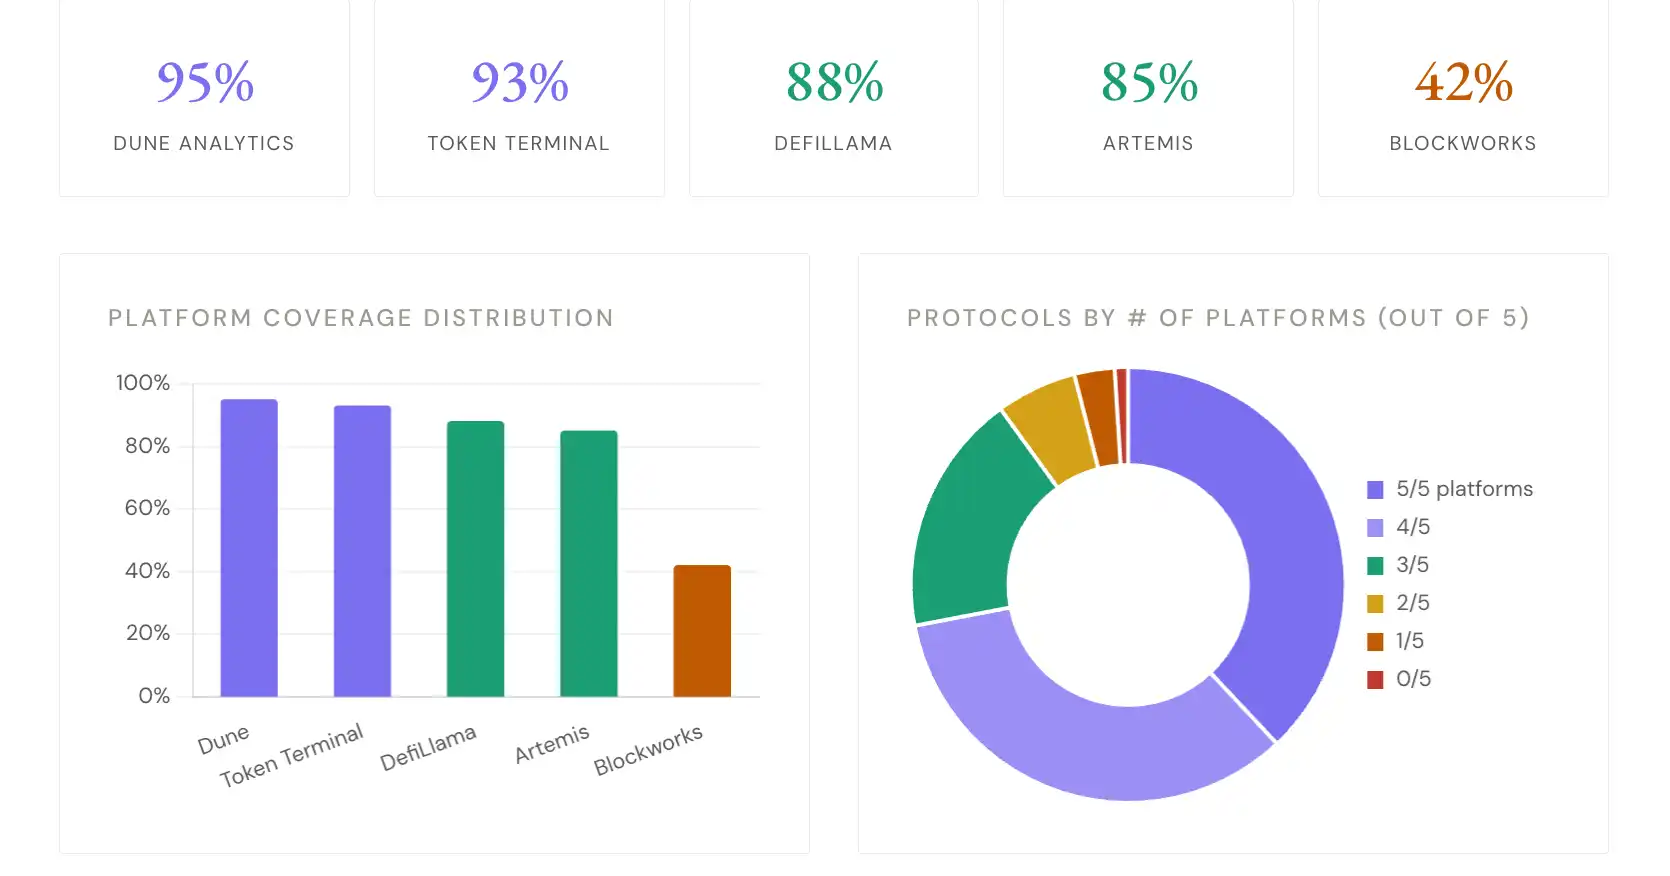
We evaluated 5 major data platforms. Coverage reflects whether each protocol has a dedicated profile containing meaningful data beyond basic price information.

72% of protocols are covered by 4 or more platforms. Third-party data infrastructure has matured significantly. The data exists. The issue is not data availability, but that protocols are not leveraging this data in structured investor communications.
The Transparency Paradox

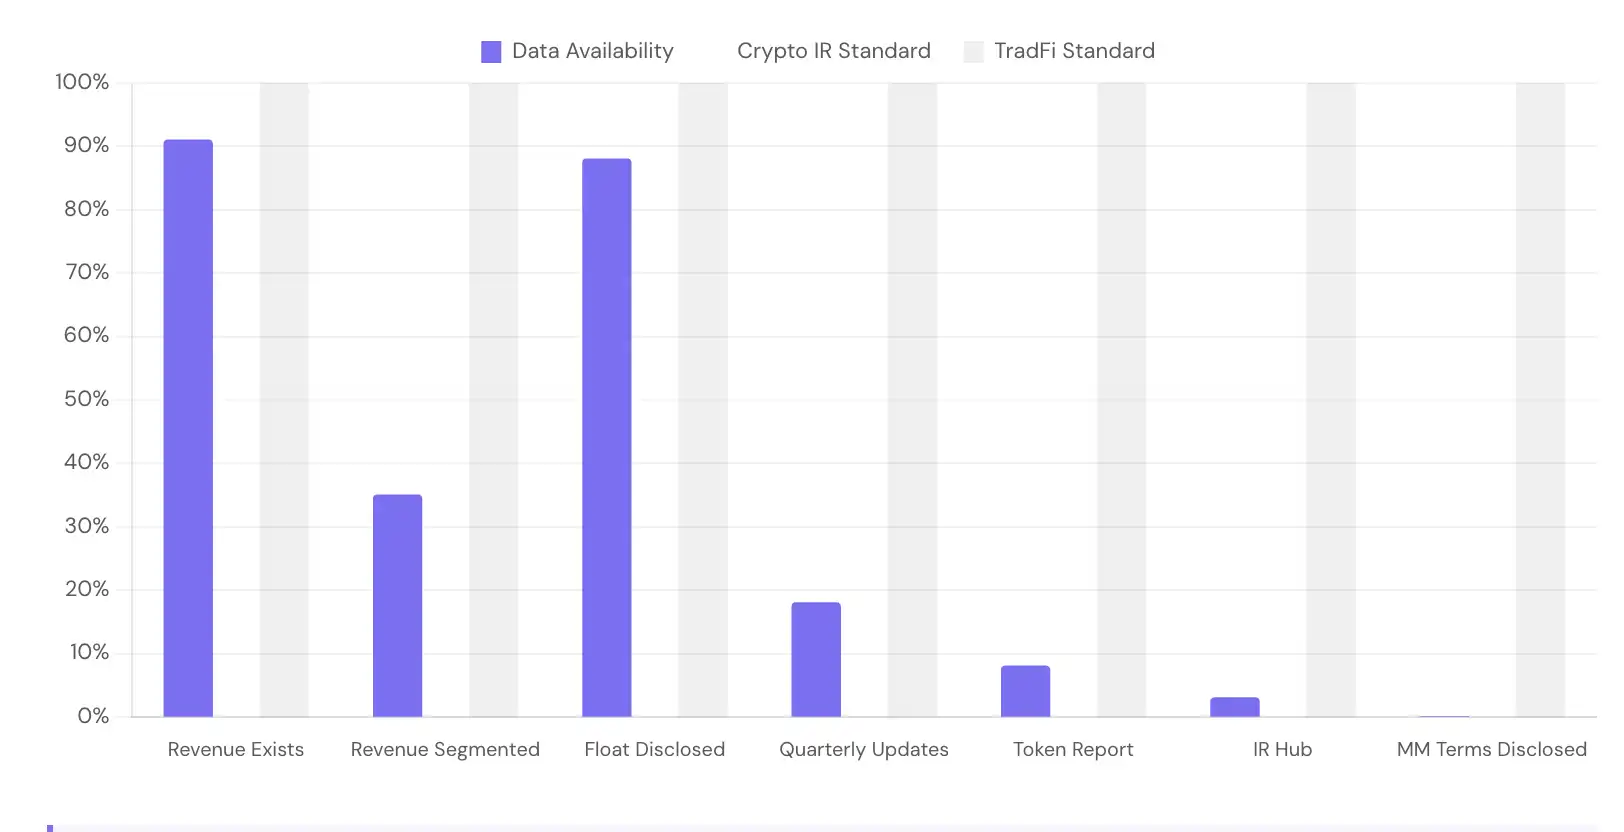
Revenue exists on-chain. Reports exist nowhere. This chart shows the disconnect between data availability and investor communication.

91% of protocols generate trackable revenue. 8% publish token holder reports. The data is there. It's on-chain, indexed by third-party platforms, and publicly verifiable. But fewer than one in ten protocols package this data into a format usable by institutional investors. This is the investor relations gap defining the industry.
Industry Breakdown

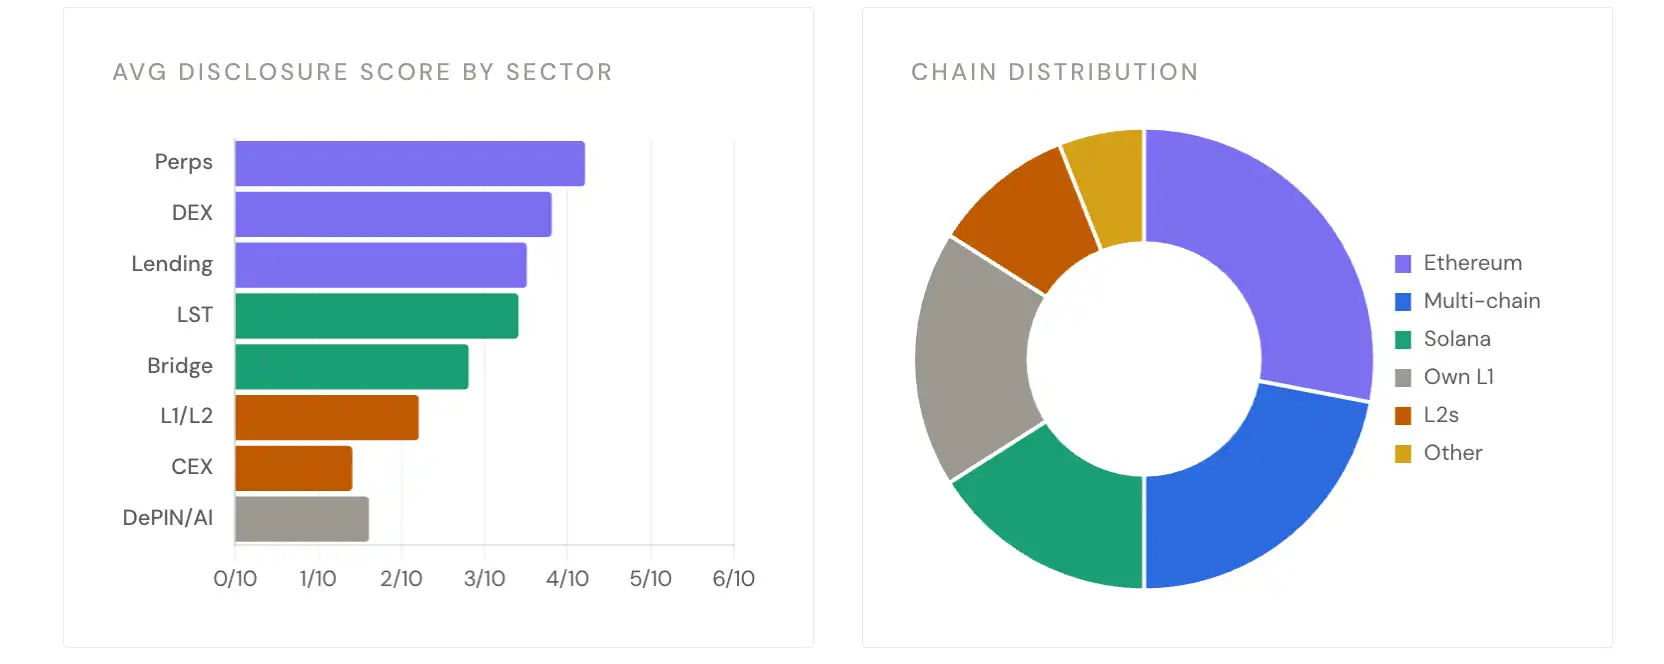
Disclosure practices vary dramatically by industry. DeFi protocols, particularly DEXs and lending, lead in transparency. L1 and infrastructure protocols, despite larger market caps, lag behind.

Token Transparency Framework

Blockworks launched the Token Transparency Framework (TTF) in June 2025, filed jointly with Jito to the SEC. 13 protocols have filed. Here's who they are and what this means.

TTF adoption is at 9%, up from 0% in June 2025. The 13 filers are heavily skewed towards Solana (6/13) and revenue-generating DeFi protocols. Zero L1s, zero L2s, zero infrastructure protocols have filed. The framework was submitted to the SEC with bipartisan support from Pantera, Theia, and L1D. But adoption is still growing slowly.
Active Value Accrual

38% of protocols have some form of active value accrual: a mechanism to return economic value to token holders, beyond just governance rights. But "value accrual" is not one thing. We identified six different models in the dataset.

The alpha is not in the mechanism itself. It's in the revenue. Any active accrual model outperformed governance-only tokens by approximately 19 percentage points on a 1-year return basis. But within the active group, daily revenue size was the differentiating factor. Governance-only tokens averaged a -51% return, while active accrual tokens averaged -32% over the same period. The mechanism itself matters less than the fact that a mechanism exists.

Key Findings

Six patterns emerging from evaluating all 15 metrics across 150+ protocols.

Six Numbers on the State of Crypto Investor Relations

The gap between institutional investor expectations and what crypto protocols provide, quantified.

Protocol Index

Each protocol evaluated in this report. Sorted alphabetically. ✓ = Disclosed/Exists. ✗ = Not Disclosed/Missing. Hover on mobile to view full row.

150+ protocols evaluated on 18 total metrics (13 disclosure + 5 platform coverage). This index represents the most comprehensive assessment of crypto investor relations practices to date. The full dataset is maintained in the Novora Investor Relations Benchmark Database, updated quarterly.

Click here for full content

Related Questions

QWhat percentage of the top 150 crypto protocols generate on-chain revenue according to the article?

A91% of the top protocols generate on-chain revenue.

QHow many protocols in the dataset publicly disclosed their market maker arrangements?

AOnly one protocol, Meteora, publicly disclosed its market maker arrangements.

QWhat is the adoption rate of the Token Transparency Framework (TTF) mentioned in the report?

AThe adoption rate of the Token Transparency Framework is 9%.

QWhat percentage of protocols release token holder reports, as stated in the article?

AOnly 8% of protocols release token holder reports.

QWhat is the performance difference in 1-year returns between governance-only tokens and tokens with active value accumulation mechanisms?

ATokens with active value accumulation mechanisms outperformed governance-only tokens by approximately 19 percentage points on a 1-year return basis.

Related Reads

9.42 Million Retail Investors Compete for Changxin Technology, Who Got Allotted?

Evergreen Technology's IPO subscription results are now available. On July 20, the domestic memory chip giant announced the offline preliminary allotment results and online lottery results for its IPO. A total of approximately 9.43 million retail investors participated in the online subscription, generating 770,000 winning lots with a final winning rate of about 0.4714%, setting a record for new shares on the STAR Market. After triggering a clawback mechanism from institutional to retail investors, the online retail allocation was significantly increased to 3.851 billion shares. Simultaneously, 285 institutional investors participated in the offline subscription, ultimately receiving 2.173 billion shares at an allotment rate of approximately 0.1756%. Leading insurers and public funds were among the major recipients. Notably, Liang Wenfeng, founder of the major AI model company DeepSeek, through his quantitative investment firms Ningbo Huanfang Quantitative and Zhejiang Jiuzhang Asset, secured the largest share among private funds, with a total allotment worth approximately 175 million yuan. Estimates suggest potential profits could reach 730 million yuan if Evergreen Technology's market capitalization reaches 3 trillion yuan post-listing. The company is expected to list on July 27 and could become the highest-valued tech stock on the A-share market, with various brokerages providing valuations ranging from 1 trillion to over 4 trillion yuan. However, recent significant corrections in global tech stocks may impact its post-listing performance. (Character count: 1,196)

marsbit22m ago

9.42 Million Retail Investors Compete for Changxin Technology, Who Got Allotted?

marsbit22m ago

L2 'Recalibration': When L1 Becomes Its Own Rollup, What Is Ethereum's Endgame?

The article discusses the evolving relationship between Ethereum's Layer 1 (L1) and Layer 2 (L2) solutions, moving beyond the initial "L2 for scaling" model. As Ethereum L1 itself scales (increasing Gas Limit, statelessness, zkEVM), the unique value proposition of L2s shifts from merely providing cheap execution to offering differentiated features like application-specific optimization, privacy, and flexible governance. The piece explores three key themes: 1. **L2's New Role:** L2s are transitioning from a pure scaling technology to a spectrum of execution environments with varying degrees of security inheritance from Ethereum L1. 2. **Interoperability as State Trust:** Solving L2 fragmentation is less about cross-chain bridges and more about enabling faster, trust-minimized state verification between environments. This involves initiatives like faster L1 finality, intent-based architectures (Open Intents Framework), and native account abstraction. 3. **Blurring Layers:** With the potential integration of zk-proofs into L1 validation (making L1 akin to its own "Rollup") and the concept of "Native Rollups," the rigid boundary between L1 and L2 may fade. The future could be a unified system with multiple execution domains (for DeFi, gaming, privacy, etc.) sharing a common security, settlement, and state framework. In conclusion, Ethereum's goal is not to abandon L2s or re-centralize everything on L1, but to re-integrate the fragmented user experience—liquidity, accounts, applications—while preserving the scaling benefits of a multi-environment ecosystem. The endgame is a cohesive "one chain" feeling for users, powered by diverse but securely interconnected execution layers.

marsbit1h ago

L2 'Recalibration': When L1 Becomes Its Own Rollup, What Is Ethereum's Endgame?

marsbit1h ago

Trading

Spot
活动图片