Author: Chain Research Society
Could This Be BTC's 2028 Diamond Bottom?
2026 has undoubtedly been Bitcoin's worst start to a year in the past decade.
From the opening drop on January 1st to now, BTC has fallen from $109K to $65K, a year-to-date decline of 24%. ETH has fared even worse, dropping 34%. This is BTC's worst start to a year since 2016.
But this time is different. This crash seems to have no reason.
I. An Unexplained Drop is the Deepest Fear
In 2018, it fell 73% because the ICO bubble burst, with countless shitcoins going to zero. In 2022, it fell 77% due to the Luna collapse, Three Arrows Capital, and the FTX implosion. Every crash had a clear reason.
Every time, you knew where the enemy was and how long it would take to rebuild trust. So what about 2026?
• No exchange blow-ups
• No algorithmic stablecoin collapses
• No major hacks
• No country banning BTC
It just fell. Fortune magazine said: The worst start ever, but without a clear crash catalyst.
A crash with a reason often leads to a vengeful rebound once the negative news is exhausted; but an unexplained drop is like a slow bleed. When everyone asks why it's falling but gets no answer, panic escalates exponentially.
II. Have the Bottom-Fishing Indicators Bottomed Out?
Current quantitative indicators show the market has entered an irrational selling vacuum zone.
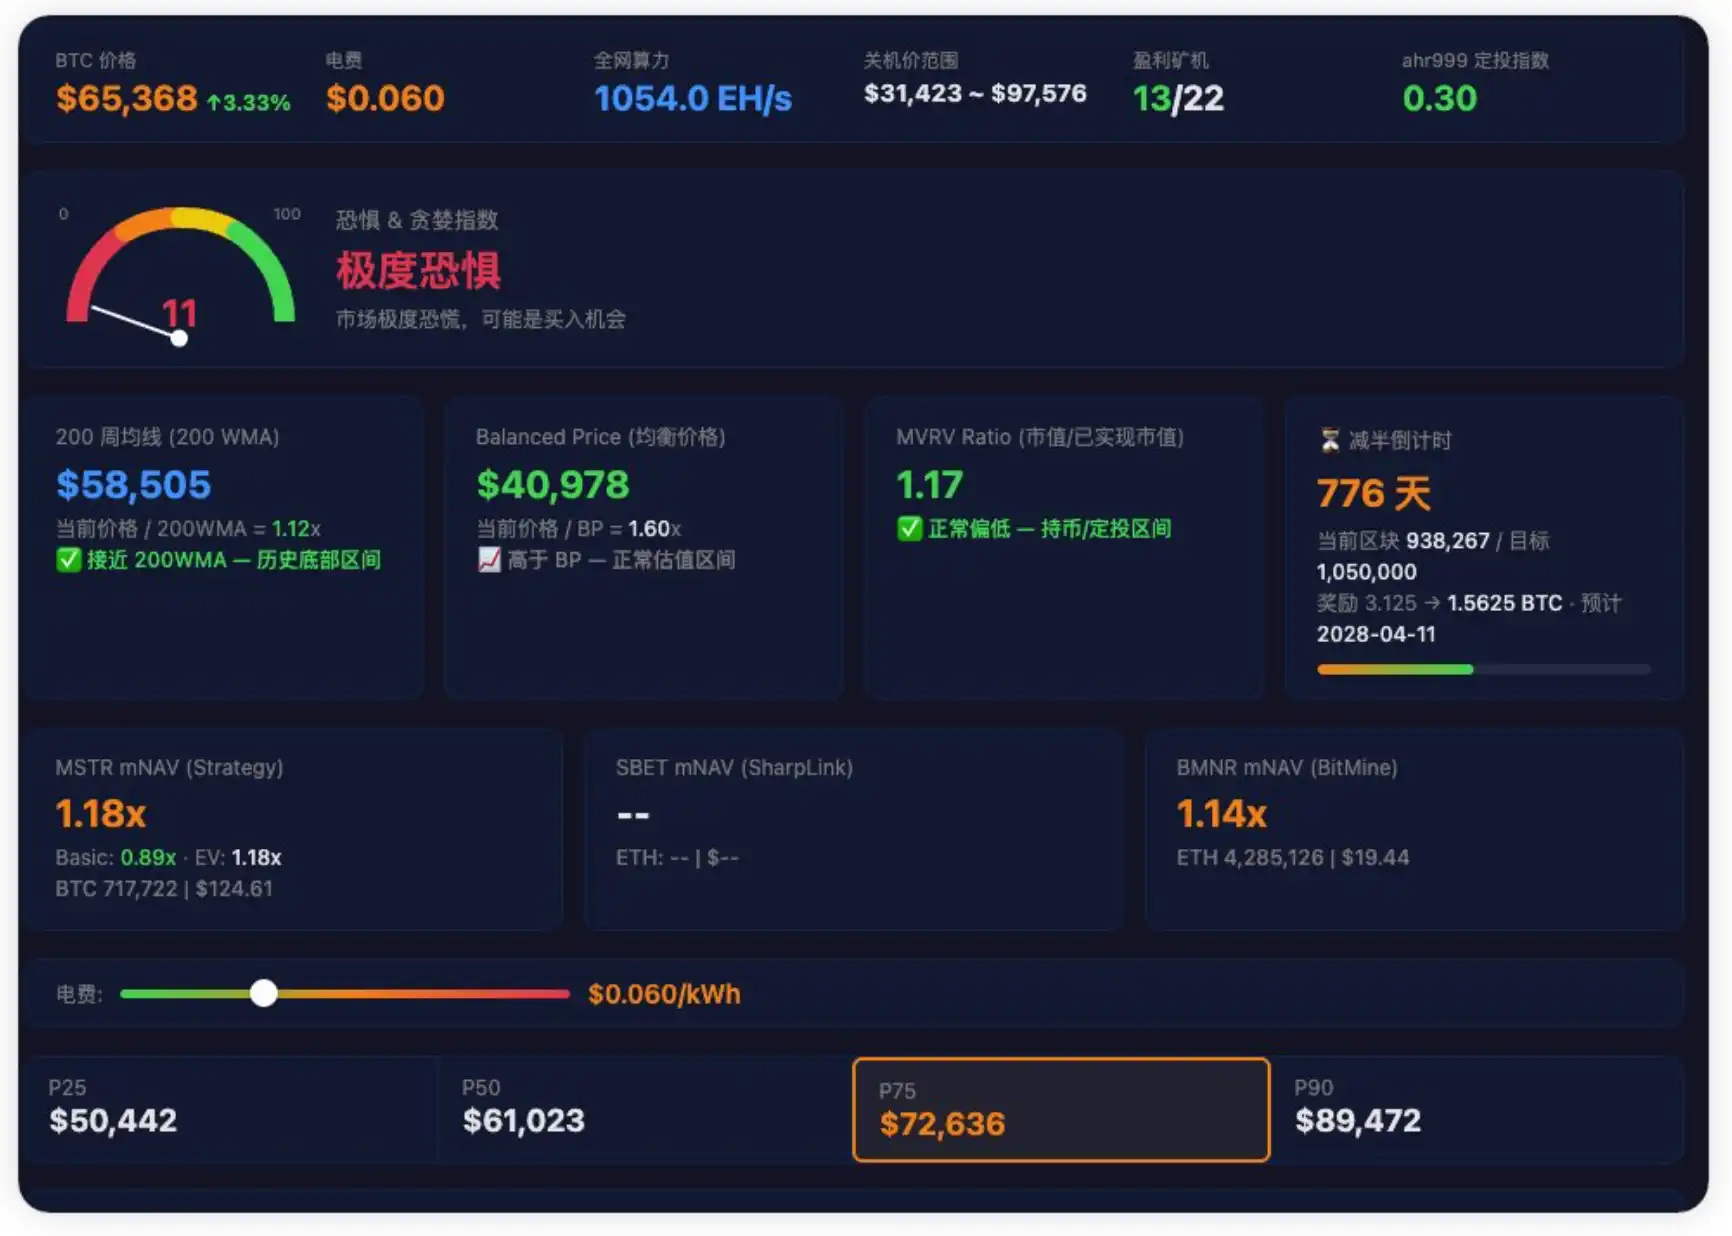
According to the latest data on February 25th, our bottom-fishing model currently shows a signal of only 1/5, indicating it's still early for a true bottom (Data source: fuckbtc).
❌ MVRV < 1.0
❌ Price ≤ 200-week moving average
❌ Price < P25
✅ Fear & Greed Index ≤ 25 (Extreme Fear: 11)
❌ Approaching miner shutdown price (Nearly half the machines are close to shutting down)
This level of extreme fear has only appeared historically at the end of 2018 at $3,000 and during the FTX crisis at $16,000. Although the price is still at $65,000, the market's psychological defense line has retreated to doomsday mode.
III. Positive Signals Under the Ice: Who's Exiting? Who's Bagholding?
Despite the freezing sentiment, there are also some positive signals:
1. USDT has seen a net outflow of $3B over 60 days. A similar scale of contraction last occurred at the end of 2022 during the FTX crash, when BTC was at $16K. BTC is now at $64K, four times higher than then.
The intensity of capital withdrawal is similar, indicating that场内杠杆 (on-exchange leverage) and weak hands have been cleaned out quite thoroughly.
2. Short-term whales have unrealized losses of $26B. Most of these players built positions between $90K-$120K and are now down 40%. The selling pressure for further significant declines should be less substantial.
Historical experience suggests that when large funds are bagholding at this depth, active selling pressure tends to dry up—because selling at a loss loses its logical meaning.
➤ My View
I am not predicting this is the bottom (it likely isn't).
But I know:
• Extreme Fear (11) has appeared.
• Historically, unexplained drops often fall deeper but also rebound more fiercely.
• At the $65K level, the margin of safety is already relatively high.
Those who called $3K the bottom in 2018 were right. Those who called $16K the bottom in 2022 were right. Those calling $64K the bottom in 2026—might be right, might be wrong.
I don't know.
But what I do know is: Panic always passes. Once trust is rebuilt, the price returns.
If you are still holding cash at this level, at least you have avoided the most violent drawdown phase. Historically, sentiment often bottoms before the price.
History repeats: After the Mt.Gox hack in 2015, people also thought trust could not be rebuilt; but looking back, every unexplained darkest hour eventually became the diamond bottom leading to the next cycle. The $64,000 of 2026 might just be the number you look back on in 2028, regretting not having bought more.