Centrifuge surges 39% as volume spikes 16,780% – What it means for CFG

ambcryptoPublished on 2026-03-18Last updated on 2026-03-18

Abstract

Centrifuge (CFG) surged 39.52% to $0.165, accompanied by a massive 16,780% spike in trading volume, indicating a significant return of liquidity and speculative interest. The price broke out of an ascending wedge but faced resistance near $0.18, suggesting a potential cooling phase. Despite a slight pullback, the RSI remains above 60, reflecting continued buyer dominance. Slight negative netflows (-$518K) suggest accumulation behavior, reducing immediate selling pressure. However, Open Interest surged 1,595% to $11.2M, indicating aggressive leveraged positioning that could amplify volatility and liquidation risks. While the overall structure remains bullish, sustainability depends on controlled expansion rather than speculative leverage. Consolidation may be needed before further upside.

Centrifuge [CFG] has surged 39.52% to $0.165 as trading volume exploded over 16,780% within 24 hours, reflecting intense market participation and activity.

Price expansion has accelerated rapidly, and traders have responded with aggressive positioning across both spot and derivatives markets.

The sharp increase in participation suggests that liquidity has rushed back into CFG after a prolonged quiet phase.

Besides, volatility has expanded significantly, which often attracts short-term speculative flows.

However, such rapid expansion also raises questions about sustainability, especially when leverage begins to build alongside price.

Has CFG breakout stalled near resistance?

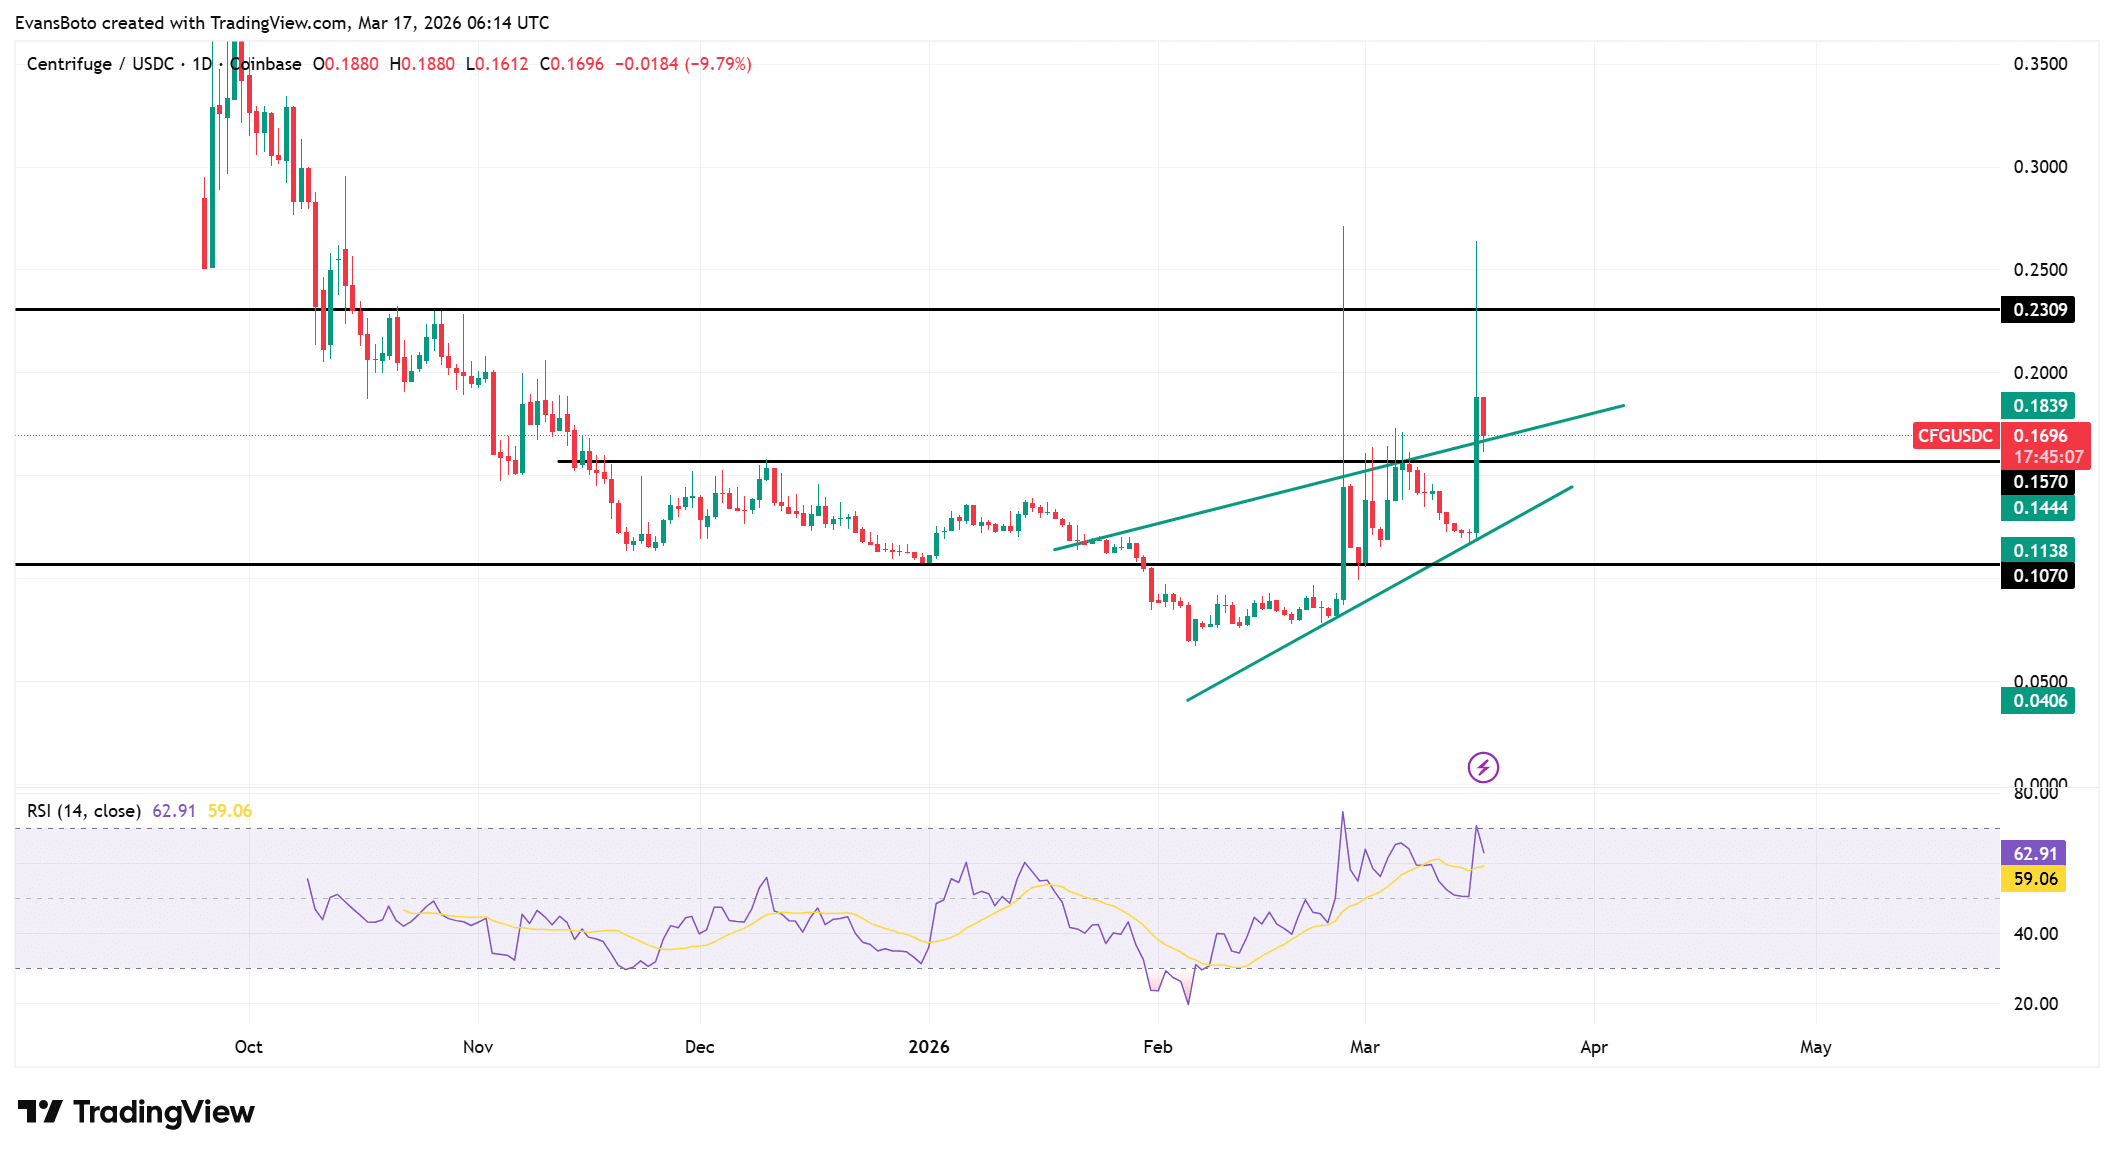
CFG has broken out of an ascending wedge, which typically signals a shift in trend structure toward expansion.

Price has pushed toward the $0.18 resistance zone, yet rejection has emerged near this level, slowing the upward move.

The breakout remains valid, though price now tests whether buyers can sustain pressure above prior structure.

However, the rejection suggests that sellers have started defending higher levels more actively. This behavior indicates that the breakout phase may require consolidation before continuation.

RSI has held above the 60 level, while cooling slightly from recent highs, indicating that buying pressure remains dominant despite the pullback.

The indicator has avoided a sharp breakdown, which suggests that buyers have maintained control of the broader structure.

However, the slight decline shows that the market has entered a cooling phase after rapid expansion.

The structure still reflects higher lows, which supports bullish intent, yet failure to reclaim $0.18 could introduce short-term instability.

Therefore, the current setup shows strength, but also highlights a key decision point for continuation.

Source: TradingView

Outflows hint at quiet accumulation trend

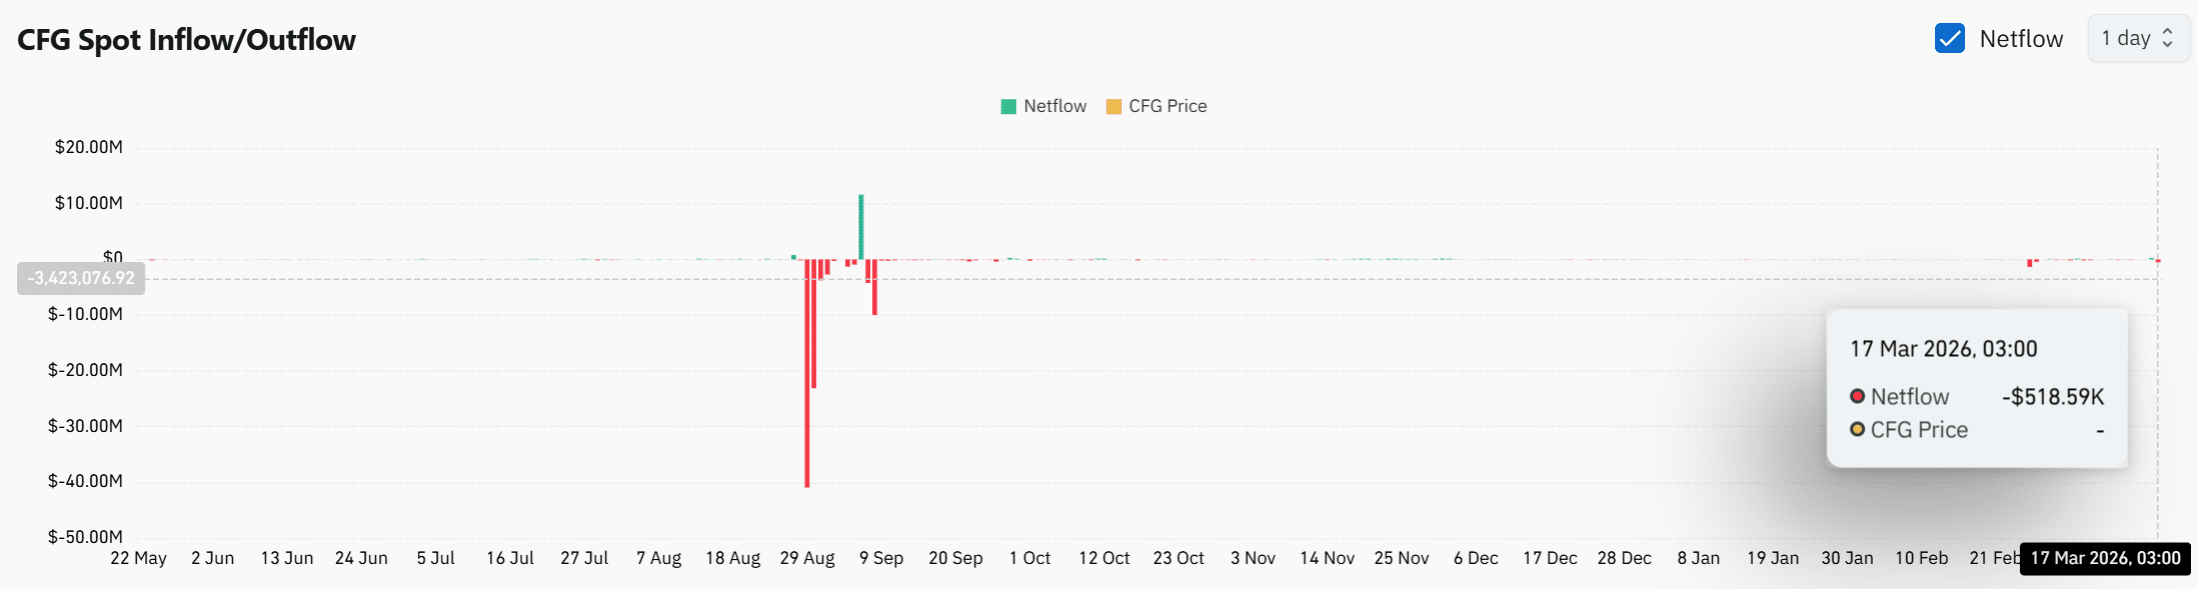
Spot Netflows have remained slightly negative at around -$518K, indicating that more CFG has left exchanges than entered them.

This pattern often reflects holding behavior, where participants withdraw assets instead of preparing to sell.

However, the scale of outflows remains relatively modest, which suggests that accumulation has not reached aggressive levels yet.

The continued negative netflow supports the broader bullish structure, as reduced exchange supply tends to limit immediate selling pressure.

Furthermore, the lack of large outflows shows that accumulation remains gradual rather than explosive.

Source: CoinGlass

Leverage surge drives derivatives expansion

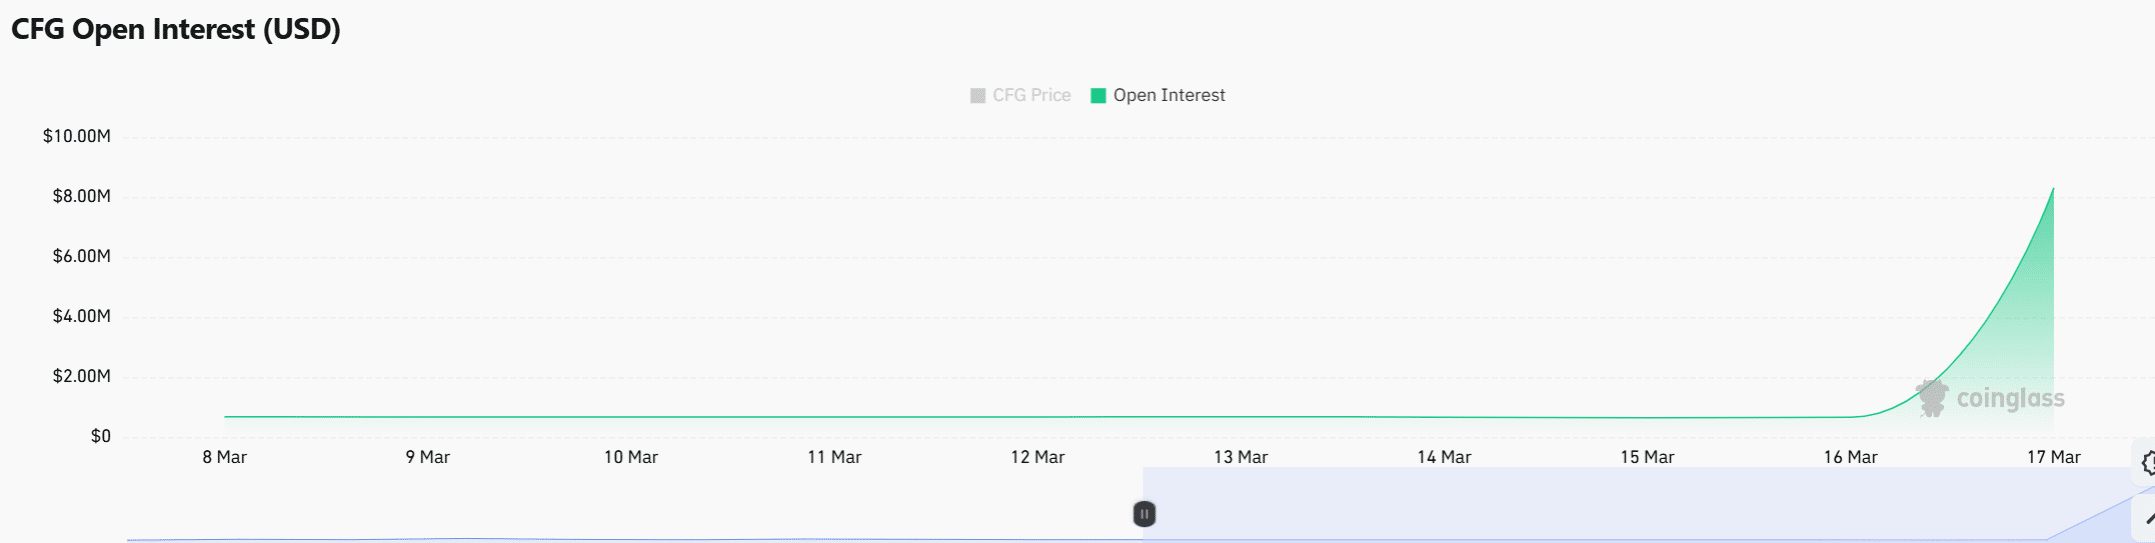
Open Interest has surged by over 1,595%, reaching $11.2M, which highlights a sharp increase in leveraged positioning across derivatives markets.

This expansion shows that traders have entered aggressively, likely reacting to the rapid price move.

However, such a steep rise in open interest also introduces risk, as crowded positioning can lead to sharp liquidations.

The alignment between price growth and leverage buildup suggests that speculative activity has intensified significantly.

In addition, rising open interest during a breakout phase often amplifies volatility in both directions.

As a result, the current derivatives structure supports continued activity, yet it also increases the probability of sudden price swings.

Source: CoinGlass

Can CFG sustain this breakout?

CFG currently holds a strong structure supported by price expansion, steady RSI strength, and consistent outflows.

However, rising leverage introduces instability. If buyers maintain control above key levels, continuation remains likely.

Still, crowded derivatives positioning could trigger sharp volatility, which means sustainability depends on controlled expansion rather than aggressive speculation.


Final Summary

  • CFG shows a strong structural shift, but rising leverage suggests volatility could intensify before any sustained trend continuation emerges.
  • Price strength remains intact above key zones, yet resistance rejection signals the market needs consolidation before confirming further upside direction.

Related Questions

QWhat was the percentage increase in Centrifuge (CFG) price and trading volume as mentioned in the article?

ACentrifuge (CFG) surged 39.52% to $0.165, and its trading volume exploded by 16,780% within 24 hours.

QAccording to the technical analysis, near which price level did CFG face rejection after its breakout?

ACFG faced rejection near the $0.18 resistance zone after breaking out of an ascending wedge pattern.

QWhat does the negative spot netflow of approximately -$518K indicate for CFG?

AThe negative spot netflow indicates that more CFG is leaving exchanges than entering them, which often reflects holding behavior and reduced immediate selling pressure, supporting a broader bullish structure.

QHow much did the Open Interest for CFG derivatives increase, and what risk does this introduce?

AOpen Interest surged by over 1,595% to $11.2M. This sharp increase in leveraged positioning introduces the risk of crowded trades leading to sharp liquidations and amplified volatility in both directions.

QWhat are the key factors that need to align for CFG to sustain its current breakout according to the article?

AFor CFG to sustain its breakout, buyers need to maintain control above key support levels, and the market requires controlled expansion rather than aggressive speculation to avoid the instability caused by high leverage and crowded derivatives positioning.

Related Reads

I Built Myself an Investment Workbench Using AI

For the past two weeks, I've been immersed in Vibe Coding—using AI to write code from natural language descriptions. This process has enabled me to quickly build functional tools that address long-standing personal ideas. Previously, I had many concepts but found execution too cumbersome. Key ideas included a unified dashboard for assets across US stocks, Crypto, HK stocks, and A-shares; a real-time alert system for price movements; an investment map visualizing sector relationships; and a tool to correlate prediction market bets with news and market data. Traditional development hurdles meant these often remained unrealized. Using AI (Codex, Claude Code, and DeepSeek API), I built four initial tools: 1. A **Cross-Market Asset Dashboard** showing total assets, daily P&L, and holdings by market, with added features for alerts and sector mapping. It's deployed locally for privacy. 2. A **Prediction Market (PM) Monitor** tracking bets on events (e.g., company valuations) and correlating probability shifts with news and market movements. I categorize bets by conviction to filter noise. 3. A **Simple Operations Backend** for managing my writing workflow (topics, progress, publishing). It's cloud-deployed for mobile access. 4. A **One-Click Formatting Tool** that automates converting drafts into various platform-specific formats, saving manual effort. While these tools are basic, they represent a significant shift: AI lowers the barrier to creating personalized systems. I believe individual investors can now feasibly build core systems for: * **Asset Observation** (tracking holdings and changes) * **Signal Monitoring** (watching for key market shifts) * **Sector Mapping** (understanding network relationships within a sector) * **Performance Review** (documenting rationale and outcomes) The power of Vibe Coding is its fast feedback loop. Ideas can be implemented, tested, and iterated on rapidly, turning "want-to-do" into "done." This marks the start of my new phase, where I'll share investment thoughts, tool tests, on-chain operations, and educational Web3 content.

marsbit8m ago

I Built Myself an Investment Workbench Using AI

marsbit8m ago

After Tokenization of Assets, How to Exit?

Title: How to Exit After Asset Tokenization? Author: Symbiotic Compiled by: Hu Tao, ChainCatcher Summary: Tokenization addresses how assets go on-chain but largely leaves the redemption question unresolved. While tokenized assets can settle instantly, the underlying redemption for assets like treasuries, private credit, or real estate can take from T+1 to 180 days. This gap hinders DeFi adoption of Real World Assets (RWAs). Three emerging models aim to provide instant exit liquidity, differing primarily in their capital structure and efficiency: 1. **Balance Sheet Model (e.g., Grove Basin):** A single entity (like Sky) provides immediate liquidity from its balance sheet, acting as a bridge during the settlement period. It offers simplicity and deep initial liquidity but is constrained by a single entity's capacity and risk appetite. 2. **Asset-Specific Vault Model (e.g., Upshift Clear):** Independent liquidity providers fund dedicated vaults for each supported asset, earning fees. It decentralizes capital sources but isolates liquidity and capital per asset, leading to potential fragmentation. 3. **Shared Liquidity Layer Model (e.g., Symbiotic Liquid Lane):** A shared capital pool supports multiple RWA types simultaneously. Funds remain productive between redemptions (e.g., earning yield in lending markets). Exits are settled via a competitive RFQ market. This model aims for higher capital efficiency, scalability across assets, and serves longer-duration assets like private credit. Key differentiators are: 1) Source of capital and risk bearer, 2) Redemption pricing mechanism, 3) Capital efficiency, 4) Scalability to new asset types, and 5) Composability. The shared liquidity layer model represents a move from piecemeal solutions toward scalable infrastructure, enabling T+0 exits by pooling capital, maintaining yield, and using competitive pricing, thus enhancing RWA utility in DeFi.

marsbit21m ago

After Tokenization of Assets, How to Exit?

marsbit21m ago

After Tokenizing Assets, How to Exit?

After tokenization, a key unresolved issue is providing holders with a reliable exit mechanism, as underlying asset settlement (taking days to months) lags far behind on-chain token settlement. Three primary models for instant liquidity have emerged, differing in their capital structure and efficiency: 1. **Balance Sheet Model (e.g., Grove Basin):** A single, well-capitalized entity (like Sky) provides immediate liquidity from its own reserves. This offers simplicity and deep initial liquidity but is constrained by that single balance sheet's capacity and risk appetite, limiting scalability. 2. **Dedicated Vault Model (e.g., Upshift Clear):** Independent liquidity providers (LPs) fund separate vaults for each supported asset. This decentralizes capital sources but isolates liquidity and capital, which becomes inefficient as the number of tokenized assets grows. 3. **Shared Liquidity Layer Model (Symbiotic Liquid Lane):** Independent capital providers fund shared vaults that can support multiple tokenized assets simultaneously. Capital remains productive between redemptions (e.g., earning yield in DeFi markets). Exits are settled via a competitive RFQ market where market makers bid. The article argues that the shared layer model offers superior capital efficiency and scalability. It transforms exit liquidity from an asset-specific patch into shared market infrastructure, allowing liquidity capacity to grow with overall market participation rather than being fragmented per asset. This is particularly valuable for longer-duration assets like private credit, where reliable T+0 exits can significantly enhance their utility in DeFi.

链捕手34m ago

After Tokenizing Assets, How to Exit?

链捕手34m ago

Anthropic's Triple Moment: Code Leak, Government Confrontation, and Weaponization

This article analyzes Anthropic's recent conflicts and strategic moves following the U.S. government's emergency halt of its new Fable model, citing national security concerns over potential "jailbreaks." The author argues this incident reveals deeper tensions between AI labs, governments, and the software industry. While critics view Anthropic's safety-focused rhetoric as marketing fear, the author suggests it serves as a commercial moat masking the company's core economic imperative: moving closer to end-users and their valuable data to avoid being commoditized. The piece outlines a coming clash between frontier AI labs like Anthropic and established software companies. Labs need real-world usage data for model improvement via reinforcement learning, creating a cycle where better products attract more users and more data. This threatens software firms who, as Microsoft's Satya Nadella warns, risk having their value captured by a few dominant models. Anthropic's controversial policy changes—initially secretly degrading Fable's performance for LLM development and expanding data retention—are framed as assertions of control, justified by its safety narrative. The company's foundational belief that it alone is sufficiently concerned about superintelligent AI dangers legitimizes its actions, from resisting government demands to shaping usage policies. The author concludes that this alignment of mission, talent, and business strategy is powerful but concerning, as it concentrates immense potential power in the hands of those convinced of their own righteous understanding.

marsbit44m ago

Anthropic's Triple Moment: Code Leak, Government Confrontation, and Weaponization

marsbit44m ago

Trading

Spot
Futures
活动图片