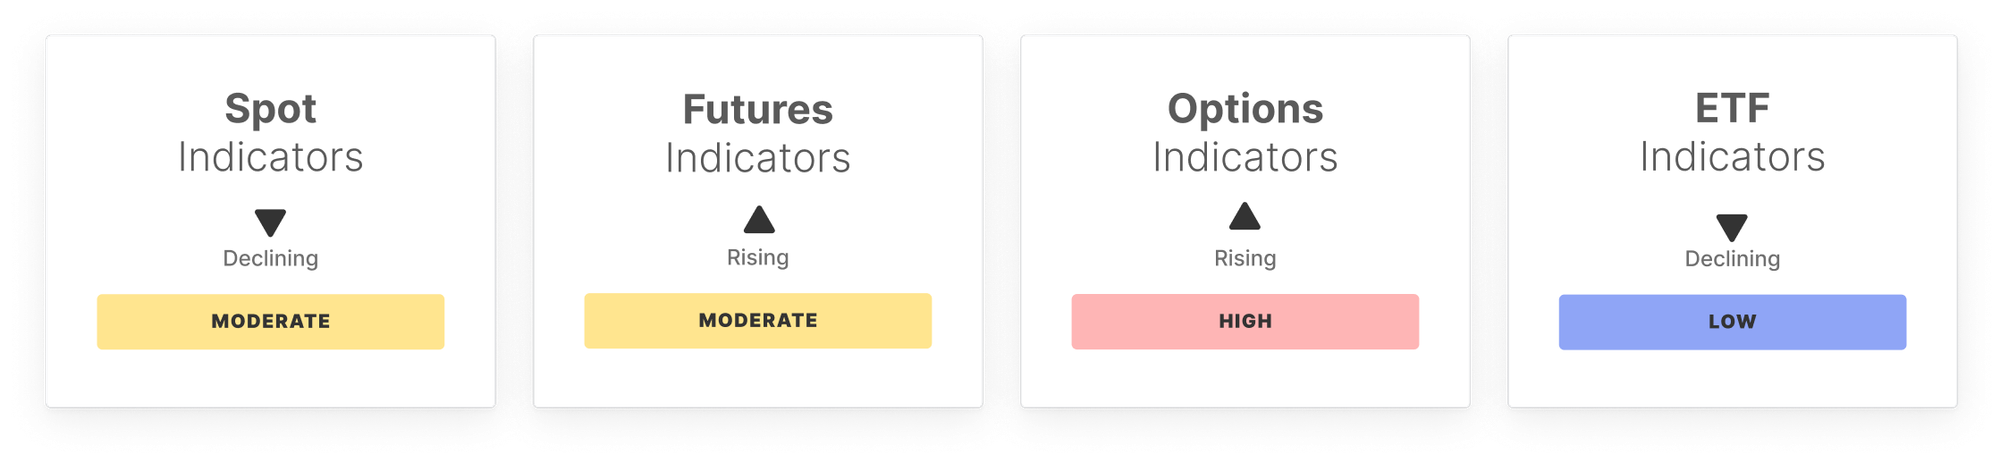
Momentum firmed as the 14-day RSI climbed from 38.6 to 58.2, while spot volume rose 13.2 percent to $11.1B. However, Spot CVD weakened from -$40.8M to -$111.7M, pointing to stronger underlying sell pressure.
Derivatives remained cautious. Futures open interest fell to $30.6B, perpetual CVD improved slightly, and funding turned more supportive with long-side payments up to $522.7K. Options showed mixed sentiment: steady OI at $46.3B, a sharply negative volatility spread at -14.6 percent, and a high 25-delta skew at 12.88 percent, indicating demand for downside protection.
ETF flows added a clear headwind. Netflows flipped from a $134.2M inflow to a $707.3M outflow, signalling profit-taking or softer institutional interest. Yet ETF trade volume rose 21.33 percent to $22.6B, and ETF MVRV increased to 1.67, pointing to higher holder profitability and some potential for distribution..
Off-Chain Indicators
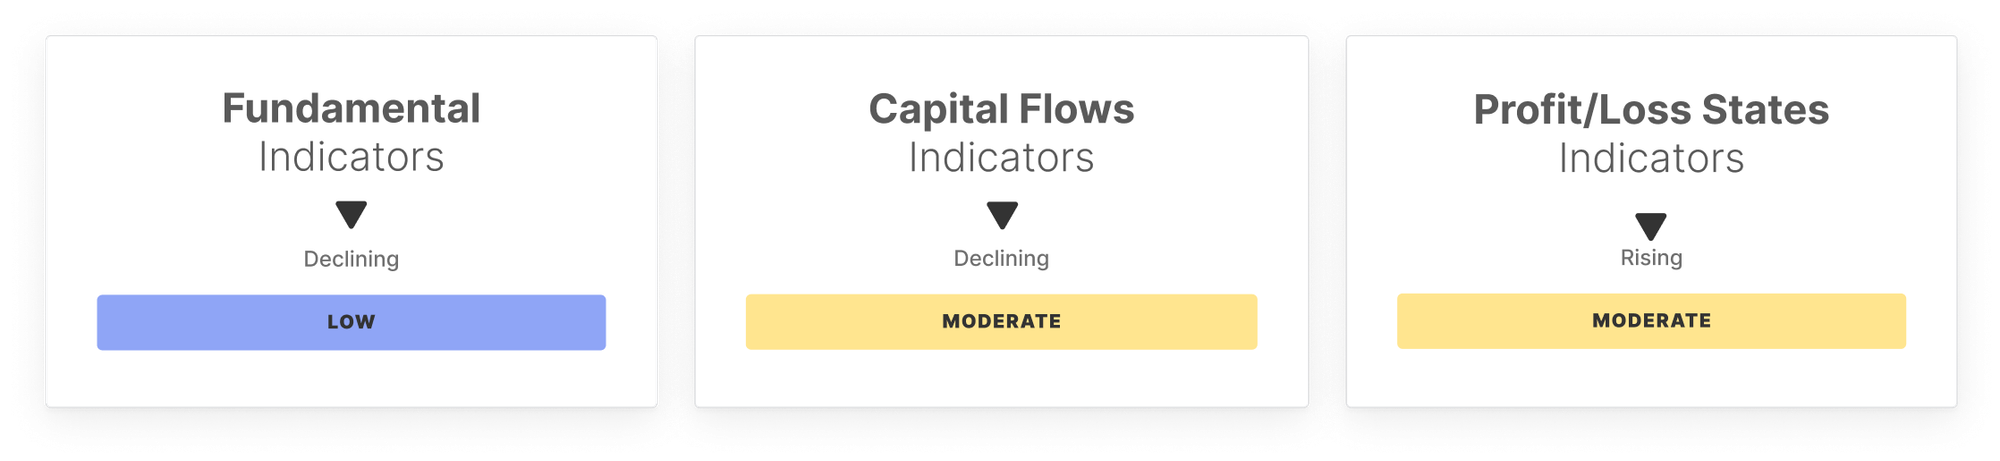
On-Chain Indicators
🔗 Access the full report in PDF

Don't miss it!
Smart market intelligence, straight to your inbox.
Subscribe now- Follow us and reach out on X
- Join our Telegram channel
- For on-chain metrics, dashboards, and alerts, visit Glassnode Studio
Disclaimer: This report does not provide any investment advice. All data is provided for information and educational purposes only. No investment decision shall be based on the information provided here and you are solely responsible for your own investment decisions.
Exchange balances presented are derived from Glassnode’s comprehensive database of address labels, which are amassed through both officially published exchange information and proprietary clustering algorithms. While we strive to ensure the utmost accuracy in representing exchange balances, it is important to note that these figures might not always encapsulate the entirety of an exchange’s reserves, particularly when exchanges refrain from disclosing their official addresses. We urge users to exercise caution and discretion when utilizing these metrics. Glassnode shall not be held responsible for any discrepancies or potential inaccuracies.
Please read our Transparency Notice when using exchange data.