Bitcoin’s Pullback Feels Brutal, But History Says It Could Drag On For Months

bitcoinistPublished on 2026-01-21Last updated on 2026-01-21

Abstract

Bitcoin has fallen below $92,000, signaling continued downside pressure despite efforts by bulls to defend key support levels. Analyst Darkfost notes the current pullback is only 109 days from the last all-time high, much shorter than previous major corrections which lasted over 150 days. While the decline feels intense due to significant realized losses, capitulation, and stressed short-term holders, historical patterns suggest Bitcoin could remain in a choppy recovery phase for months without breaking its broader cycle structure. This cycle is further complicated by ETF-driven institutional demand, potentially leading to longer consolidations and less predictable behavior. Technically, Bitcoin remains below key moving averages, with the $90,000–$88,000 range acting as critical support. A breakdown below this level could target December lows, while reclaiming $92,000 is essential for bullish momentum.

Bitcoin has slipped below the $92,000 level after a sharp decline that began on Sunday, signaling that downside pressure is still shaping market conditions. Despite the drop, bulls are trying to defend current levels and regain control, with many traders watching for a rebound that could restore confidence across the broader crypto market. The move comes at a sensitive moment, as risk appetite remains fragile and short-term volatility continues to shake out leveraged positioning.

Top analyst Darkfost highlighted that the market is now 109 days removed from Bitcoin’s last all-time high, placing the current drawdown into a wider cycle context. In previous major corrections, Bitcoin spent far longer in recovery mode, including 236 days between March 2024 and November, followed by another 154-day correction window between December 2024 and May 2025. Compared to those periods, the current pullback may still be early in its timeline, even if price action already feels aggressive.

Bitcoin Days Since last ATH | Source: CryptoQuant

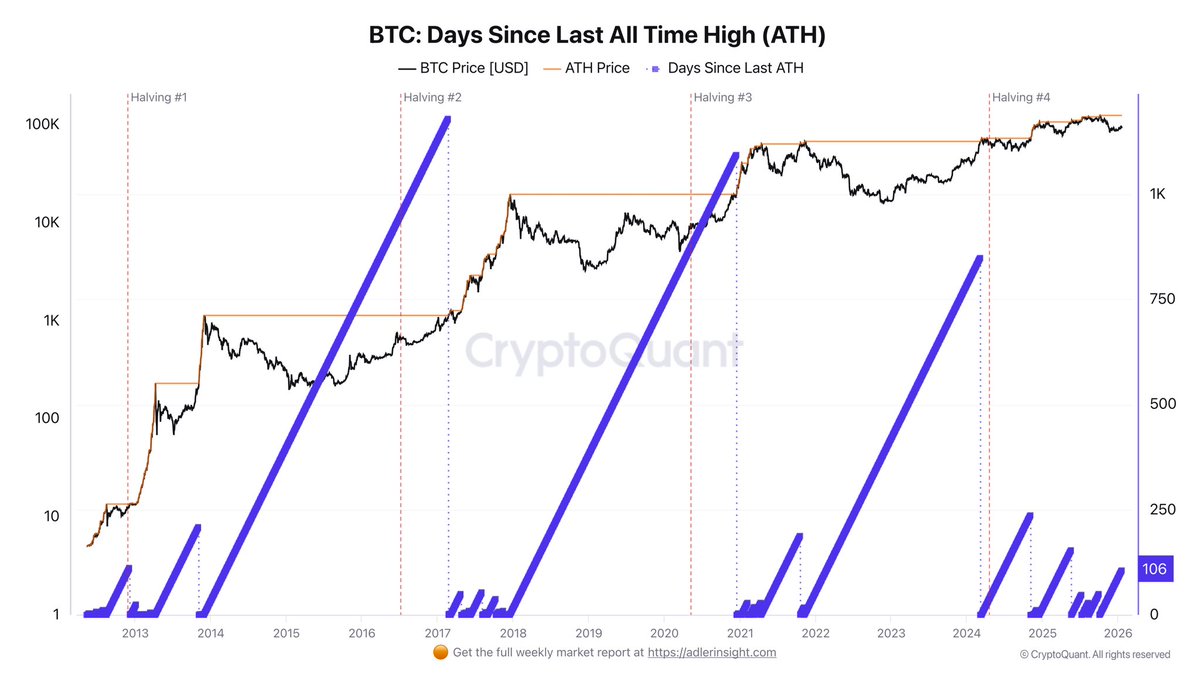
What makes this correction stand out is the intensity of the pain across the market. Realized losses have stacked up, capitulation has been more visible, and short-term holders appear increasingly stressed, creating the sense that this decline is heavier than past resets. Even so, history suggests Bitcoin can remain in a choppy recovery phase for months without breaking the broader cycle structure.

Capitulation Builds, But the Cycle May Still Be Intact

Bitcoin’s recent decline has not been a “clean” pullback. Realized losses have stacked up, capitulation has looked aggressive, and short-term holders remain under heavy pressure as the market punishes late entries and weak conviction. Liquidation data has also shown how leverage has amplified the downside, with forced selling accelerating drops that might have otherwise played out more gradually. That backdrop is exactly why the correction feels so violent, even compared to past drawdowns.

However, Darkfost argues this phase still fits within the broader rhythm of Bitcoin’s cycle. His key point is that extended corrections are not unusual, even when they feel unusually painful in real time. From that perspective, the market could easily spend more months digesting losses and rebuilding positioning without signaling a full structural breakdown.

Where this cycle becomes more complex is the macro timing. Unlike previous cycles, Bitcoin’s post-bear all-time high and the halving narrative have overlapped with a new variable: ETF-driven demand. That shift changes how drawdowns develop, because deeper pools of institutional capital can absorb supply differently than retail-led rallies. If this institutional trend continues, Bitcoin may be transitioning into a structurally different market regime, with longer consolidations and less predictable “four-year cycle” behavior.

Bitcoin Slips Below Key Averages as Bulls Defend $90K Support

Bitcoin is back under pressure after failing to hold above the $92,000 zone, with the chart showing price sliding toward $91,300 as selling accelerates. The move keeps BTC trapped below major moving averages, reinforcing the idea that this rebound is still fragile and highly reactive to headline-driven volatility. After the January recovery attempt, the rejection near the descending resistance structure highlights that sellers remain active on rallies, limiting bullish follow-through.

BTC testing key demand level | Source: BTCUSDT Chart on TradingView

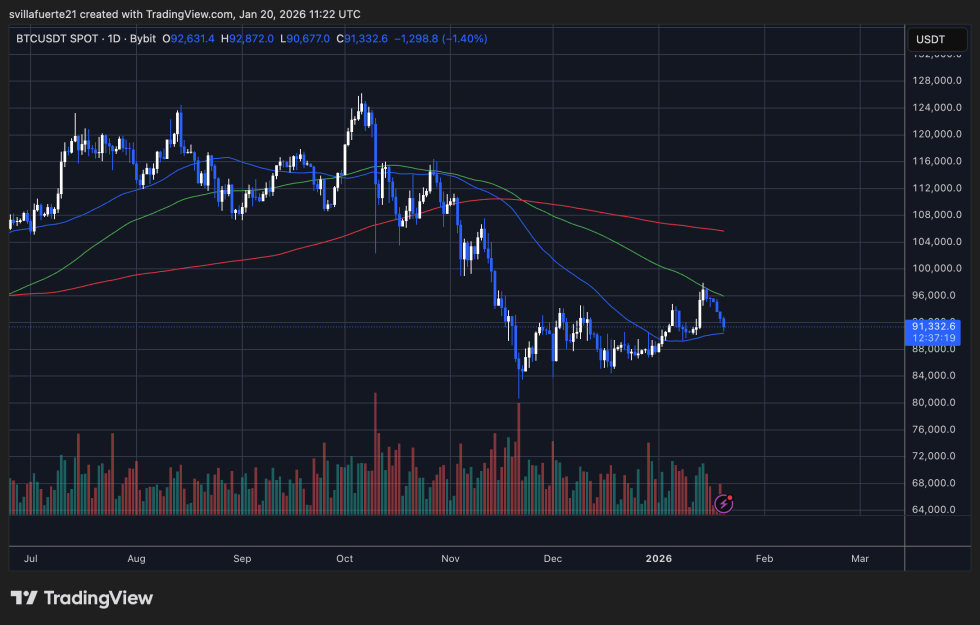
Technically, the market continues to trade beneath the 50-day and 100-day trend lines, while the longer-term averages remain overhead, acting as dynamic resistance. This structure suggests BTC is still in a corrective phase rather than a confirmed trend reversal, despite short-term optimism earlier this month. Volume also shows a lack of sustained demand expansion, supporting the view that buyers are defending levels, but not fully regaining control.

The $90,000–$88,000 range now stands out as a critical support area, as it has acted as a base during recent consolidation. A clean breakdown below it could reopen downside risk toward the December lows, while a hold could keep the market building a recovery structure. For bulls, the first step is stabilizing above $92,000 again, then reclaiming the mid-$90,000s to shift momentum back in their favor.

Featured image from ChatGPT, chart from TradingView.com

Related Questions

QAccording to the article, how many days has it been since Bitcoin's last all-time high, and how does this compare to previous major corrections?

AThe market is 109 days removed from Bitcoin's last all-time high. This is shorter than previous major corrections, which lasted 236 days and 154 days respectively.

QWhat key factor does analyst Darkfost highlight that makes the current correction feel more painful than past ones?

ADarkfost highlights that realized losses have stacked up, capitulation has been more visible, and short-term holders are under heavy pressure, creating a sense that this decline is heavier. Additionally, leverage has amplified the downside with forced selling.

QWhat new variable in this cycle, according to the article, changes how Bitcoin drawdowns develop compared to previous cycles?

AThe new variable is ETF-driven demand from deeper pools of institutional capital, which can absorb supply differently than retail-led rallies, potentially leading to longer consolidations and less predictable cycle behavior.

QWhat is identified as a critical support area for Bitcoin's price in the article, and what are the potential consequences of a breakdown below it?

AThe $90,000–$88,000 range is identified as a critical support area. A clean breakdown below it could reopen downside risk toward the December lows, while holding it could allow the market to continue building a recovery structure.

QWhat technical indicators suggest that Bitcoin is still in a corrective phase rather than a confirmed trend reversal?

ABitcoin is trading beneath the 50-day and 100-day moving averages, with the longer-term averages acting as overhead resistance. Additionally, volume shows a lack of sustained demand expansion, indicating buyers are defending levels but not fully regaining control.

Related Reads

a16z: AI's 'Amnesia', Can Continuous Learning Cure It?

The article "a16z: AI's 'Amnesia' – Can Continual Learning Cure It?" explores the limitations of current large language models (LLMs), which, like the protagonist in the film *Memento*, are trapped in a perpetual present—unable to form new memories after training. While methods like in-context learning (ICL), retrieval-augmented generation (RAG), and external scaffolding (e.g., chat history, prompts) provide temporary solutions, they fail to enable true internalization of new knowledge. The authors argue that compression—the core of learning during training—is halted at deployment, preventing models from generalizing, discovering novel solutions (e.g., mathematical proofs), or handling adversarial scenarios. The piece introduces *continual learning* as a critical research direction to address this, categorizing approaches into three paths: 1. **Context**: Scaling external memory via longer context windows, multi-agent systems, and smarter retrieval. 2. **Modules**: Using pluggable adapters or external memory layers for specialization without full retraining. 3. **Weights**: Enabling parameter updates through sparse training, test-time training, meta-learning, distillation, and reinforcement learning from feedback. Challenges include catastrophic forgetting, safety risks, and auditability, but overcoming these could unlock models that learn iteratively from experience. The conclusion emphasizes that while context-based methods are effective, true breakthroughs require models to compress new information into weights post-deployment, moving from mere retrieval to genuine learning.

marsbit38m ago

a16z: AI's 'Amnesia', Can Continuous Learning Cure It?

marsbit38m ago

Can a Hair Dryer Earn $34,000? Deciphering the Reflexivity Paradox in Prediction Markets

An individual manipulated a weather sensor at Paris Charles de Gaulle Airport with a portable heat source, causing a Polymarket weather market to settle at 22°C and earning $34,000. This incident highlights a fundamental issue in prediction markets: when a market aims to reflect reality, it also incentivizes participants to influence that reality. Prediction markets operate on two layers: platform rules (what outcome counts as a win) and data sources (what actually happened). While most focus on rules, the real vulnerability lies in the data source. If reality is recorded through a specific source, influencing that source directly affects market settlement. The article categorizes markets by their vulnerability: 1. **Single-point physical data sources** (e.g., weather stations): Easily manipulated through physical interference. 2. **Insider information markets** (e.g., MrBeast video details): Insiders like team members use non-public information to trade. Kalshi fined a剪辑师 $20,000 for insider trading. 3. **Actor-manipulated markets** (e.g., Andrew Tate’s tweet counts): The subject of the market can control the outcome. Evidence suggests Tate’sociated accounts coordinated to profit. 4. **Individual-action markets** (e.g., WNBA disruptions): A single person can execute an event to profit from their pre-placed bets. Kalshi and Polymarket handle these issues differently. Kalshi enforces strict KYC, publicly penalizes insider trading, and reports to regulators. Polymarket, with its anonymous wallet-based system, has historically been more permissive, arguing that insider information improves market accuracy. However, it cooperated with authorities in the "Van Dyke case," where a user traded on classified government information. The core paradox is reflexivity: prediction markets are designed to discover truth, but their financial incentives can distort reality. The more valuable a prediction becomes, the more likely participants are to influence the event itself. The market ceases to be a mirror of reality and instead shapes it.

marsbit1h ago

Can a Hair Dryer Earn $34,000? Deciphering the Reflexivity Paradox in Prediction Markets

marsbit1h ago

Trading

Spot
Futures

Hot Articles

What is $BITCOIN

DIGITAL GOLD ($BITCOIN): A Comprehensive Analysis Introduction to DIGITAL GOLD ($BITCOIN) DIGITAL GOLD ($BITCOIN) is a blockchain-based project operating on the Solana network, which aims to combine the characteristics of traditional precious metals with the innovation of decentralized technologies. While it shares a name with Bitcoin, often referred to as “digital gold” due to its perception as a store of value, DIGITAL GOLD is a separate token designed to create a unique ecosystem within the Web3 landscape. Its goal is to position itself as a viable alternative digital asset, although specifics regarding its applications and functionalities are still developing. What is DIGITAL GOLD ($BITCOIN)? DIGITAL GOLD ($BITCOIN) is a cryptocurrency token explicitly designed for use on the Solana blockchain. In contrast to Bitcoin, which provides a widely recognized value storage role, this token appears to focus on broader applications and characteristics. Notable aspects include: Blockchain Infrastructure: The token is built on the Solana blockchain, known for its capacity to handle high-speed and low-cost transactions. Supply Dynamics: DIGITAL GOLD has a maximum supply capped at 100 quadrillion tokens (100P $BITCOIN), although details regarding its circulating supply are currently undisclosed. Utility: While precise functionalities are not explicitly outlined, there are indications that the token could be utilized for various applications, potentially involving decentralized applications (dApps) or asset tokenization strategies. Who is the Creator of DIGITAL GOLD ($BITCOIN)? At present, the identity of the creators and development team behind DIGITAL GOLD ($BITCOIN) remains unknown. This situation is typical among many innovative projects within the blockchain space, particularly those aligning with decentralized finance and meme coin phenomena. While such anonymity may foster a community-driven culture, it intensifies concerns about governance and accountability. Who are the Investors of DIGITAL GOLD ($BITCOIN)? The available information indicates that DIGITAL GOLD ($BITCOIN) does not have any known institutional backers or prominent venture capital investments. The project seems to operate on a peer-to-peer model focused on community support and adoption rather than traditional funding routes. Its activity and liquidity are primarily situated on decentralized exchanges (DEXs), such as PumpSwap, rather than established centralized trading platforms, further highlighting its grassroots approach. How DIGITAL GOLD ($BITCOIN) Works The operational mechanics of DIGITAL GOLD ($BITCOIN) can be elaborated on based on its blockchain design and network attributes: Consensus Mechanism: By leveraging Solana’s unique proof-of-history (PoH) combined with a proof-of-stake (PoS) model, the project ensures efficient transaction validation contributing to the network's high performance. Tokenomics: While specific deflationary mechanisms have not been extensively detailed, the vast maximum token supply implies that it may cater to microtransactions or niche use cases that are still to be defined. Interoperability: There exists the potential for integration with Solana’s broader ecosystem, including various decentralized finance (DeFi) platforms. However, the details regarding specific integrations remain unspecified. Timeline of Key Events Here is a timeline that highlights significant milestones concerning DIGITAL GOLD ($BITCOIN): 2023: The initial deployment of the token occurs on the Solana blockchain, marked by its contract address. 2024: DIGITAL GOLD gains visibility as it becomes available for trading on decentralized exchanges like PumpSwap, allowing users to trade it against SOL. 2025: The project witnesses sporadic trading activity and potential interest in community-led engagements, although no noteworthy partnerships or technical advancements have been documented as of yet. Critical Analysis Strengths Scalability: The underlying Solana infrastructure supports high transaction volumes, which could enhance the utility of $BITCOIN in various transaction scenarios. Accessibility: The potential low trading price per token could attract retail investors, facilitating wider participation due to fractional ownership opportunities. Risks Lack of Transparency: The absence of publicly known backers, developers, or an audit process may yield skepticism regarding the project's sustainability and trustworthiness. Market Volatility: The trading activity is heavily reliant on speculative behavior, which can result in significant price volatility and uncertainty for investors. Conclusion DIGITAL GOLD ($BITCOIN) emerges as an intriguing yet ambiguous project within the rapidly evolving Solana ecosystem. While it attempts to leverage the “digital gold” narrative, its departure from Bitcoin's established role as a store of value underscores the need for a clearer differentiation of its intended utility and governance structure. Future acceptance and adoption will likely depend on addressing the current opacity and defining its operational and economic strategies more explicitly. Note: This report encompasses synthesised information available as of October 2023, and developments may have transpired beyond the research period.

363 Total ViewsPublished 2025.05.13Updated 2025.05.13

What is $BITCOIN

Discussions

Welcome to the HTX Community. Here, you can stay informed about the latest platform developments and gain access to professional market insights. Users' opinions on the price of BTC (BTC) are presented below.

活动图片