Author: Claude, Deep Tide TechFlow
Deep Tide Intro: As of August 26th, Bitcoin is on track for its strongest August since 2017, with an intra-month gain of approximately 25%. Historical data shows that since 2013, Bitcoin has never had a 'green September' following a 'green August'. Every green August has been followed by a red September (averaging a pullback of about -5.9%), which was then followed by an average surge of about 44% in October. This pattern is being re-examined by the market.
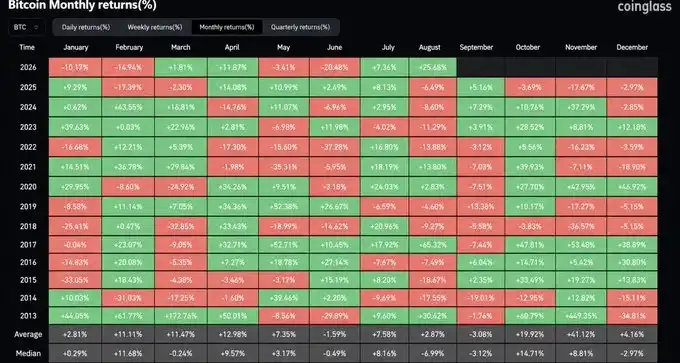
Bitcoin is on track for its most bullish August since 2017. As of August 26th, the price is trading in the $78k to $79k range, representing an intra-month gain of about 25%.
Meanwhile, an observation about seasonal patterns is spreading rapidly within the crypto community. Crypto Zombie points out that Bitcoin has never historically seen a 'green September' immediately following a 'green August'. And every time a green August was followed by a red September, the September pullback tended to be relatively mild, while October saw a significant breakout.
Green August Has Never Been Followed by Green September
According to public Bitcoin monthly return data, since 2013, Bitcoin has recorded positive returns in August four times: 2013 (+30.9%), 2017 (+64.2%), 2020 (+2.7%), and 2021 (+13.6%).
All four of these 'green Augusts' were followed by negative Septembers:
- September 2013: -1.3%
- September 2017: -7.9%
- September 2020: -7.5%
- September 2021: -7.0%
The average pullback was about -5.9%. Not once was there an exception with a 'green September'.
Mild Pullback Followed by Average ~44% Surge in October
More crucial is the subsequent performance. Following the four instances of the 'green August + red September' combination mentioned above, October saw significant positive returns every time:
- October 2013: +67.3%
- October 2017: +47.9%
- October 2020: +28.0%
- October 2021: +39.9%
The average gain was approximately +44% to +46% (there are slight variations depending on the data source and closing price calculations).
This sequence is summarized as: following a green August, the September pullback is relatively contained, and October often sees a strong rebound.
Current August is Essentially Locked in as 'Green'
As of publication, Bitcoin's August 2026 intra-month gain is already close to 25%, making it the strongest August since 2017. The price has risen from around $63k in late July to the current range of $78k-$79k.
Historically, August overall has been weak, but this year's strong performance has shifted market focus to the specific path of 'September-October following a green August'.
It's important to emphasize that historical seasonality does not constitute a prediction of the future. The full sample size is only four instances, and the macroeconomic environment and market structure behind each instance differed significantly. Currently, we are still at the tail end of August, and September has not yet begun. Whether this pattern repeats still requires validation from actual price action.