Bitcoin Funding Rate Hits Three-Month Low: What Did the Shorts Already Know?

marsbitPublished on 2026-03-09Last updated on 2026-03-09

Abstract

Bitcoin's derivatives market signaled significant downside pressure ahead of key macro data, as funding rates turned deeply negative — hitting around -6% on February 28, a three-month low — while open interest (in BTC terms) continued to rise. This combination indicated that traders were aggressively shorting or hedging, using high leverage, even before the U.S. employment report was released. When the jobs data came in softer than expected, it triggered a macro repricing event. The negative funding rates reflected a crowded speculative position favoring shorts, meaning sellers were paying buyers to maintain their bearish bets. Such conditions can persist if hedging demand is genuine or if trend-following behavior continues, rather than simply indicating an imminent reversal. The real signal occurs when negative funding rates coincide with stable or rising open interest — suggesting new short positions are still entering — while price fails to make new lows. Liquidations then act as a scoreboard: cascading long or short squeezes confirm whether volatility has forced positions to unwind. In summary, derivatives metrics — funding rates, open interest, and liquidations — provided a clear, early warning of building risk and leveraged positioning prior to the macro catalyst. The market’s reaction was ultimately a function of crowded positions meeting a macroeconomic trigger.

Author: CryptoSlate

Compiled by: Deep Tide TechFlow

Deep Tide Guide: This article explains an important market mechanism: Before macroeconomic data was announced, the Bitcoin derivatives market had already clearly signaled risks through three dimensions—funding rates, open interest, and liquidations. Understanding this logic allows one to see the real market pressures earlier than chasing any narrative.

Full Text Below:

The Bitcoin derivatives market provides the best explanation for this week's macro pressures.

Funding rates turned sharply negative, open interest remained high, and then the U.S. jobs report landed. These three events together indicate that the market had heavily positioned for downside hedging before the actual macro catalyst arrived.

This sequence is worth understanding because it explains how macro volatility enters the crypto market.

It usually appears first in perpetual contracts—where hedging is fastest and leverage usage is highest.

Funding rates tell you which side is paying to maintain positions, open interest tells you how many positions remain in the system, and liquidation data tells you when these positions start to break.

On February 28, Bitcoin perpetual funding rates fell to approximately -6%, one of the most negative readings in nearly three months. BTC-denominated open interest rose from about 113,380 BTC at the beginning of the year to 120,260 BTC.
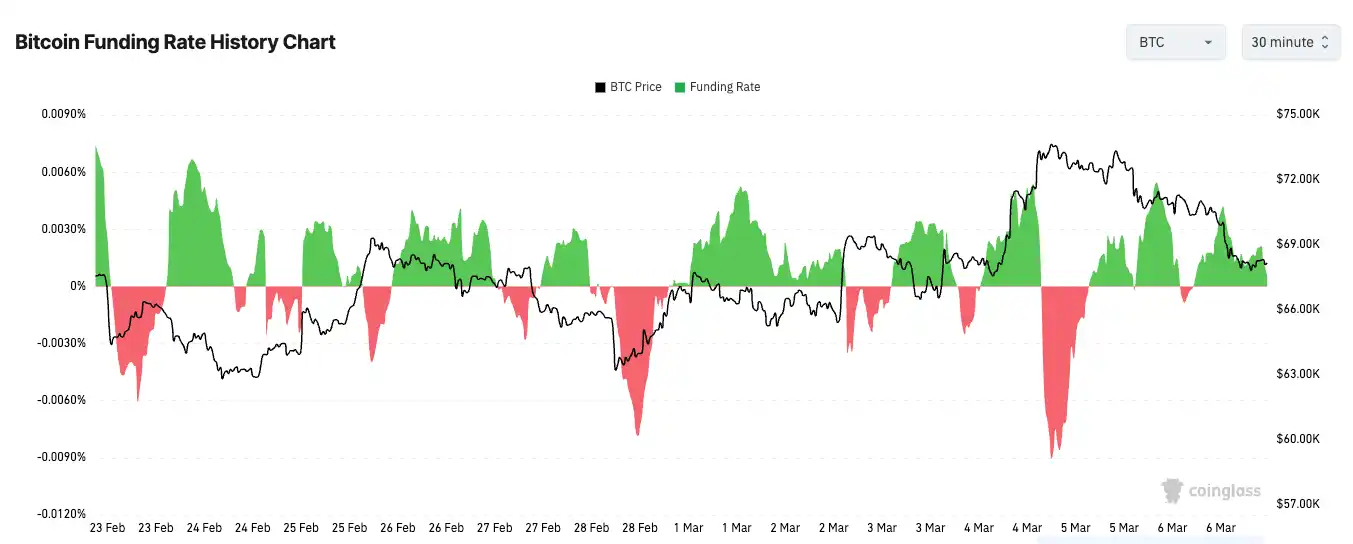
This combination is important because it points to two things simultaneously: Traders are aggressively betting on the downside, and they are doing so with more leverage entering the market. The market is both very tense and very crowded.

This is the simplest way to understand how macro pressure enters the crypto market.

It appears in the derivatives ledger, not as a neatly packaged X narrative or a tidy economist report. Traders act there first because perpetual contracts are liquid, low-cost, and always available.

When they worry about growth, interest rates, or broader risk-off sentiment, they short perpetual contracts; these contracts fall below spot, and funding rates turn negative because shorts must pay longs to maintain their positions.

Why Negative Funding Rates Persist

But negative funding rates alone are not a bottom signal; they only tell you which way the market is leaning.

This distinction is important because traders like to turn every extreme reading into a prediction.

Extremely negative funding rates can signal short covering, and last week's setup clearly created that possibility. But when hedging demand is real, it can also persist longer than expected.

Extreme spikes and drops in funding rates reflect one-sided positioning, which can persist during strong directional moves.

This persistence usually comes from two places.

Some traders are hedging real spot exposure, meaning they are not precisely predicting the next move but simply protecting their portfolios. Others are simple trend followers, willing to pay funding rates as long as the market continues moving in their direction. Both types can keep funding rates negative even after the initial panic has passed.

That's why the real signal isn't whether funding rates are negative. A more interesting pattern emerges when funding rates remain significantly negative while prices stop making new lows. Then, pressure begins to build beneath the surface. Shorts are still paying to maintain positions, but the market is no longer rewarding them in the same way. This is how short-covering conditions form.

The Jobs Report Brought Real Macro Input to the Market

This week's macro catalyst came from the U.S. labor market. On March 6, the Bureau of Labor Statistics reported a loss of 92,000 non-farm jobs in February, with an unemployment rate of 4.4%.

Such reports trigger broad repricing because they touch on multiple market themes. A weaker labor market could lower yields if traders believe the Fed may need a more dovish path. It could also hit risk appetite if traders interpret the data as a sign of real economic weakness.

The crypto market typically feels this debate more intensely because leverage turns macro issues into positioning events.

If traders are heavily short and macro data even briefly eases financial conditions, prices can surge rapidly as shorts are forced to cover.

If the data deepens risk-off sentiment, the same crowded positioning can continue to pressure downward as shorts remain comfortable and longs start to capitulate.

Funding rates are the pressure gauge, open interest is the fuel, and liquidations are the moment pressure starts to break through the system.

Liquidation Data Is the Scoreboard

Liquidation data tells you whether the move is orderly or forced.

Short liquidations usually confirm a covering event, while long liquidations usually confirm a washout to the downside. When both longs and shorts are liquidated in a short time, the market is telling you that volatility has taken over, and neither side has much room to hold positions.

That's why liquidation data is best used as a confirmation layer. Funding rates set the conditions, but liquidations tell you whether those conditions are actually forced into price.

Open interest is equally important here. If participation shrinks synchronously, falling prices and negative funding rates don't say much.

This may only mean traders are stepping back to wait and see. But when open interest rises alongside negative funding rates, it means new positions are being built with a bearish or defensive bias.

Tracking open interest in BTC terms removes some distortions from price fluctuations, so a rise in BTC-denominated open interest during price declines more clearly reflects market participation.

From this perspective, the past week wasn't really about Bitcoin's strength or weakness but about where pressure was building.

The derivatives market showed heavy shorting or hedging before the jobs data landed.

The jobs report then provided a real macro input for global markets to process.

When these two things met, the crypto market did what it usually does: It expressed the same macro uncertainty everyone was facing with larger candles, faster reversals, and more violent position liquidations.

Funding rates don't predict price; they only tell you where leverage is leaning. Open interest doesn't tell you who is right, only how many positions are still on the field. Liquidation data doesn't explain the entire move, only when the move becomes involuntary.

That's why derivatives ultimately became the best macro explainer this week. Before the narrative dust settled, the ledger had already painted the risks clearly. Traders were shorting, leverage was still in the system, and the jobs report gave the market a real object to react to.

What happened afterward was simply price discovering how crowded the room was.

Related Questions

QWhat does a negative funding rate in Bitcoin perpetual contracts indicate about market sentiment?

AA negative funding rate indicates that traders are heavily betting on the downside, as shorts are paying longs to maintain their positions, reflecting bearish sentiment and hedging activity.

QHow did the US employment report on March 6 impact the crypto market?

AThe US employment report, which reported a loss of 92,000 non-farm jobs and a 4.4% unemployment rate, served as a macro catalyst that triggered broad repricing, affecting risk appetite and potentially influencing Federal Reserve policy, leading to increased volatility and liquidations in the crypto market.

QWhy is the combination of negative funding rates and high open interest significant?

AThe combination of negative funding rates and high open interest signals that traders are aggressively shorting or hedging while more leverage is entering the market, indicating both high tension and crowded positioning, which can amplify market moves when macro catalysts occur.

QWhat role do liquidation data play in confirming market conditions?

ALiquidation data acts as a scoreboard, confirming whether market moves are orderly or forced. Short liquidations indicate covering, while long liquidations confirm a sell-off; simultaneous liquidations of both sides show volatility has taken control, with little room for either side to hold positions.

QHow do Bitcoin derivatives provide insight into macro pressure before traditional narratives?

ABitcoin derivatives, through funding rates, open interest, and liquidations, reveal risk and hedging activity in real-time, often ahead of macro events. They show where pressure is building in the market, offering a clearer picture of sentiment and leverage dynamics before economic data or narratives are fully absorbed.

Related Reads

Must-Watch Events Next Week|CLARITY Act Could Face Senate Vote; SpaceX, Circle to Report Earnings (8.3-8.9)

**Summary: Key Events and Developments to Watch (August 3-9)** The upcoming week is marked by significant financial disclosures, key legislative deadlines, and notable product updates. **Major Financial Events:** Several companies are scheduled to release their Q2 2026 earnings. American Bitcoin (ABTC) will report on August 3, followed by SpaceX and Hut 8 Mining Corp. on August 4, and Circle on August 5. Notably, a significant portion of SpaceX shares (up to 12% of total shares) will be unlocked on August 6 following their earnings release. **Key Legislative Deadline:** The U.S. Senate faces an August 7 deadline to secure 60 votes for the CLARITY Act, a bipartisan bill aiming to establish a federal regulatory framework for cryptocurrencies. The Senate may hold a full vote on the bill during the week. **Economic Data:** The U.S. July Non-Farm Payrolls report will be released on August 7, providing crucial labor market data. **Technology & Product Updates:** * **Shutdowns:** DeFi portfolio tracker Zapper and wallet app Ctrl Wallet will cease operations on August 3. * **Upgrades:** LayerZero will deprecate its v1 relayers on August 3. XRP Ledger's new version 3.3.0, featuring five new functions, is expected next week. * **AI:** Elon Musk announced that the advanced Grok 4.6 AI model is set for release around August 7. * **Bitcoin:** The BIP-110 forced signaling for a potential Bitcoin network change is scheduled to begin around August 8. **Other Notable Events:** Chinese robotics firm Unitree Tech has set its preliminary price inquiry for its IPO for August 5. South Korean exchange Upbit will delist AQT and AERGO tokens on August 3.

marsbit1h ago

Must-Watch Events Next Week|CLARITY Act Could Face Senate Vote; SpaceX, Circle to Report Earnings (8.3-8.9)

marsbit1h ago

Stocks Are Plummeting More Sharply Than Cryptocurrencies. Where Has the Money Gone?

Stock Markets Plunge Deeper Than Cryptocurrencies: Where Did the Money Go? In late July, Seoul's Kospi index triggered circuit breakers for two consecutive days, plummeting over 40% from its June high. The collapse was led by heavyweight stocks like SK Hynix, whose record profits still disappointed investors, and devastating leveraged ETFs, with one major product losing over 83% of its value. This signaled a global, forced deleveraging targeting the most crowded trades. Interestingly, while stocks exhibited extreme volatility akin to crypto markets, Bitcoin rose nearly 15% in July after a prior steep drop. Analysis shows the money fleeing equities did not flow into Bitcoin. Instead, Bitcoin had already absorbed its sell-off in May-June, when U.S. spot Bitcoin ETFs saw historic outflows. The true safe-haven beneficiary was gold, whose price rose over 20% year-on-year, highlighting a decoupling between Bitcoin and gold as "digital gold." The sell-off was a targeted unwinding of leveraged positions in tech and semiconductors, accelerated by broker-dealer risk management and shifts in the AI narrative, including new competition from Chinese memory chipmakers. The retreat path was clear: from high-valuation tech stocks to cash and U.S. Treasuries, then to gold. For Bitcoin to attract sustained institutional inflows, conditions like eased global liquidity pressure, a "soft-landing" Fed rate cut, and U.S. regulatory clarity via legislation like the stalled CLARITY Act are needed. Currently, Bitcoin is not a safe haven but an already-cleared asset. Its low correlation with tech stocks, however, makes it a potential diversification play for institutional portfolios once the storm passes. The money isn't here yet, but the positioning is underway.

marsbit1h ago

Stocks Are Plummeting More Sharply Than Cryptocurrencies. Where Has the Money Gone?

marsbit1h ago

In Conversation with Ray Dalio: We Are Currently in an AI Bubble, with 1% of My Portfolio in Bitcoin

Ray Dalio, founder of Bridgewater Associates, warns in an interview that the current AI boom shows classic bubble characteristics, which could lead to significant economic downturns as seen in past cycles like 1929 or 2000. He explains that speculative enthusiasm, fueled by debt and overvaluation, often precedes a crash when rising rates or taxation force asset sales, causing widespread losses and recession. Dalio also outlines his "Big Cycle" theory, describing an approximate 80-year pattern where widening wealth gaps, massive government deficits, and shifting geopolitical power (like China's rise) create internal conflict and global instability. He emphasizes that we are in a late-cycle, transitional phase where traditional powers like the US and UK face decline. For personal wealth protection, Dalio advises diversification beyond cash into assets like stocks, bonds, real estate, and particularly gold, which he prefers over Bitcoin. While he holds about 1% of his portfolio in Bitcoin as a non-printable hard asset, he views gold as more secure from technological or governmental threats. Regarding AI's impact, Dalio believes it will disproportionately benefit capital owners, worsening inequality by replacing both physical and cognitive labor. He suggests that human intuition and emotional intelligence, combined with AI, will be key for future workers. On taxation, Dalio argues that wealth taxes are impractical and risk triggering asset sell-offs, reducing productive investment. He points to the UK as a cautionary example of debt, low productivity, and political strife. Geopolitically, Dalio foresees a more regionalized world, with the US showing weakness in prolonged conflicts like with Iran, akin to past imperial declines. The ideal outcome, he suggests, is coexisting powerful blocs (e.g., Americas, China-Asia Pacific) without major war.

marsbit5h ago

In Conversation with Ray Dalio: We Are Currently in an AI Bubble, with 1% of My Portfolio in Bitcoin

marsbit5h ago

Trading

Spot
活动图片





