Bitcoin Bear Market Would Be Record Shallow If $60,000 Was The Low: Glassnode

bitcoinistPublished on 2026-05-15Last updated on 2026-05-15

Abstract

Glassnode's analysis indicates the current Bitcoin bear market may be record shallow if the low was $60,000. The firm notes the Relative Unrealized Loss metric, tracking investor paper losses as a percentage of market cap, peaked at only 25% during February's sell-off, significantly lower than historical cycle highs. This level has since declined to around 8%, suggesting a shift from fear to uncertainty rather than the broad capitulation typical of major bottoms. Concurrently, the 30-day change in Bitcoin's Realized Cap has turned positive, signaling renewed capital inflows, though Glassnode cautions this inflow lacks the conviction seen at similar past inflection points. Bitcoin's price has recently consolidated around the $81,300 level.

Glassnode has pointed out how this Bitcoin bear market has so far seen a peak Unrealized Loss significantly lower than previous cycles.

Bitcoin Relative Unrealized Loss Has Dropped To Just 8%

In its latest report, on-chain analytics firm Glassnode has discussed the latest trend in the Relative Unrealized Loss of Bitcoin. This indicator keeps track of the total amount of unrealized loss held by the BTC investors as a percentage of the market cap.

Below is the chart shared by Glassnode that shows the trend in the metric for BTC over the last few cycles.

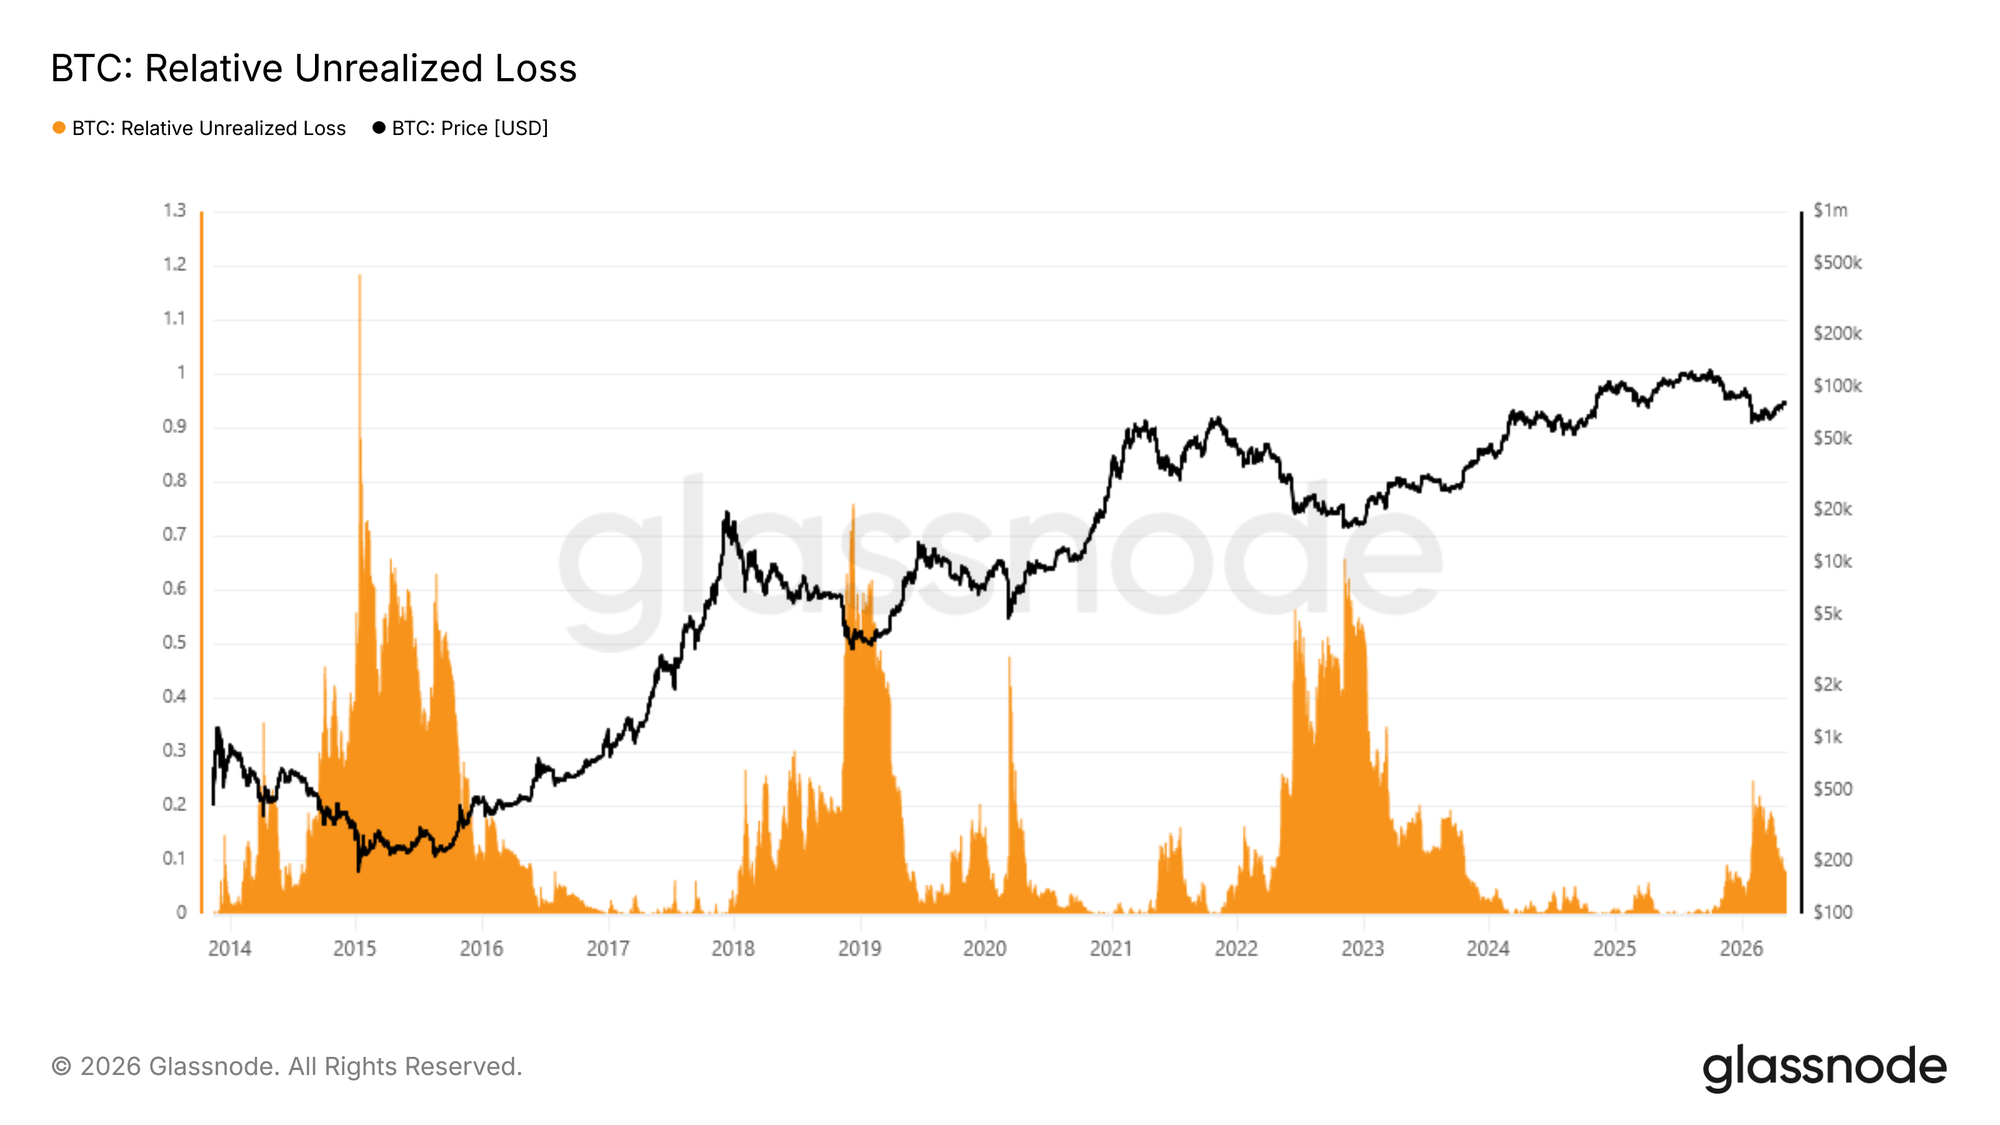
Looks like the value of the metric has declined in recent days | Source: Glassnode's The Week Onchain - Week 19, 2026

As is visible in the graph, the Bitcoin Relative Unrealized Loss shot up to a notable level alongside the price plunge in early February, indicating that pain among investors saw a sharp uptick. With the recovery that has followed since then, however, the indicator’s value has gone down.

Today, the Relative Unrealized Loss for the network stands at approximately 8%. The report described this decline in the metric as “a transition that shifts the prevailing sentiment from fear toward uncertainty rather than capitulation.”

Earlier, when the indicator had spiked, its value reached a high of 25%. This means that the February crash had meant that investor losses ballooned to 25% of the entire market cap of the cryptocurrency. This is a notable amount on its own, but a quick look at the chart shows that the level is in fact significantly lower than highs seen during previous bear markets.

At present, it’s unclear which stage the current bear market is inside right now. It’s possible that the fact that the Relative Unrealized Loss hasn’t touched prior peaks yet points to the drawdown not being over. It’s also a possibility, though, that the current cycle is simply going to be different from the previous ones. Glassnode noted:

If $60k proves to have been the cycle low, this bear market would stand as the shallowest on record, one that registered fear but stopped well short of the broad capitulation that has historically marked durable cycle bottoms.

Another on-chain indicator that suggests improvement in market conditions is the Realized Cap, which basically measures the total amount of capital that the investors as a whole have put into Bitcoin.

As the below chart shared by the analytics firm in the same report shows, the 30-day change in the BTC Realized Cap had plunged deep into the negative zone earlier, indicating that capital was leaving the network.

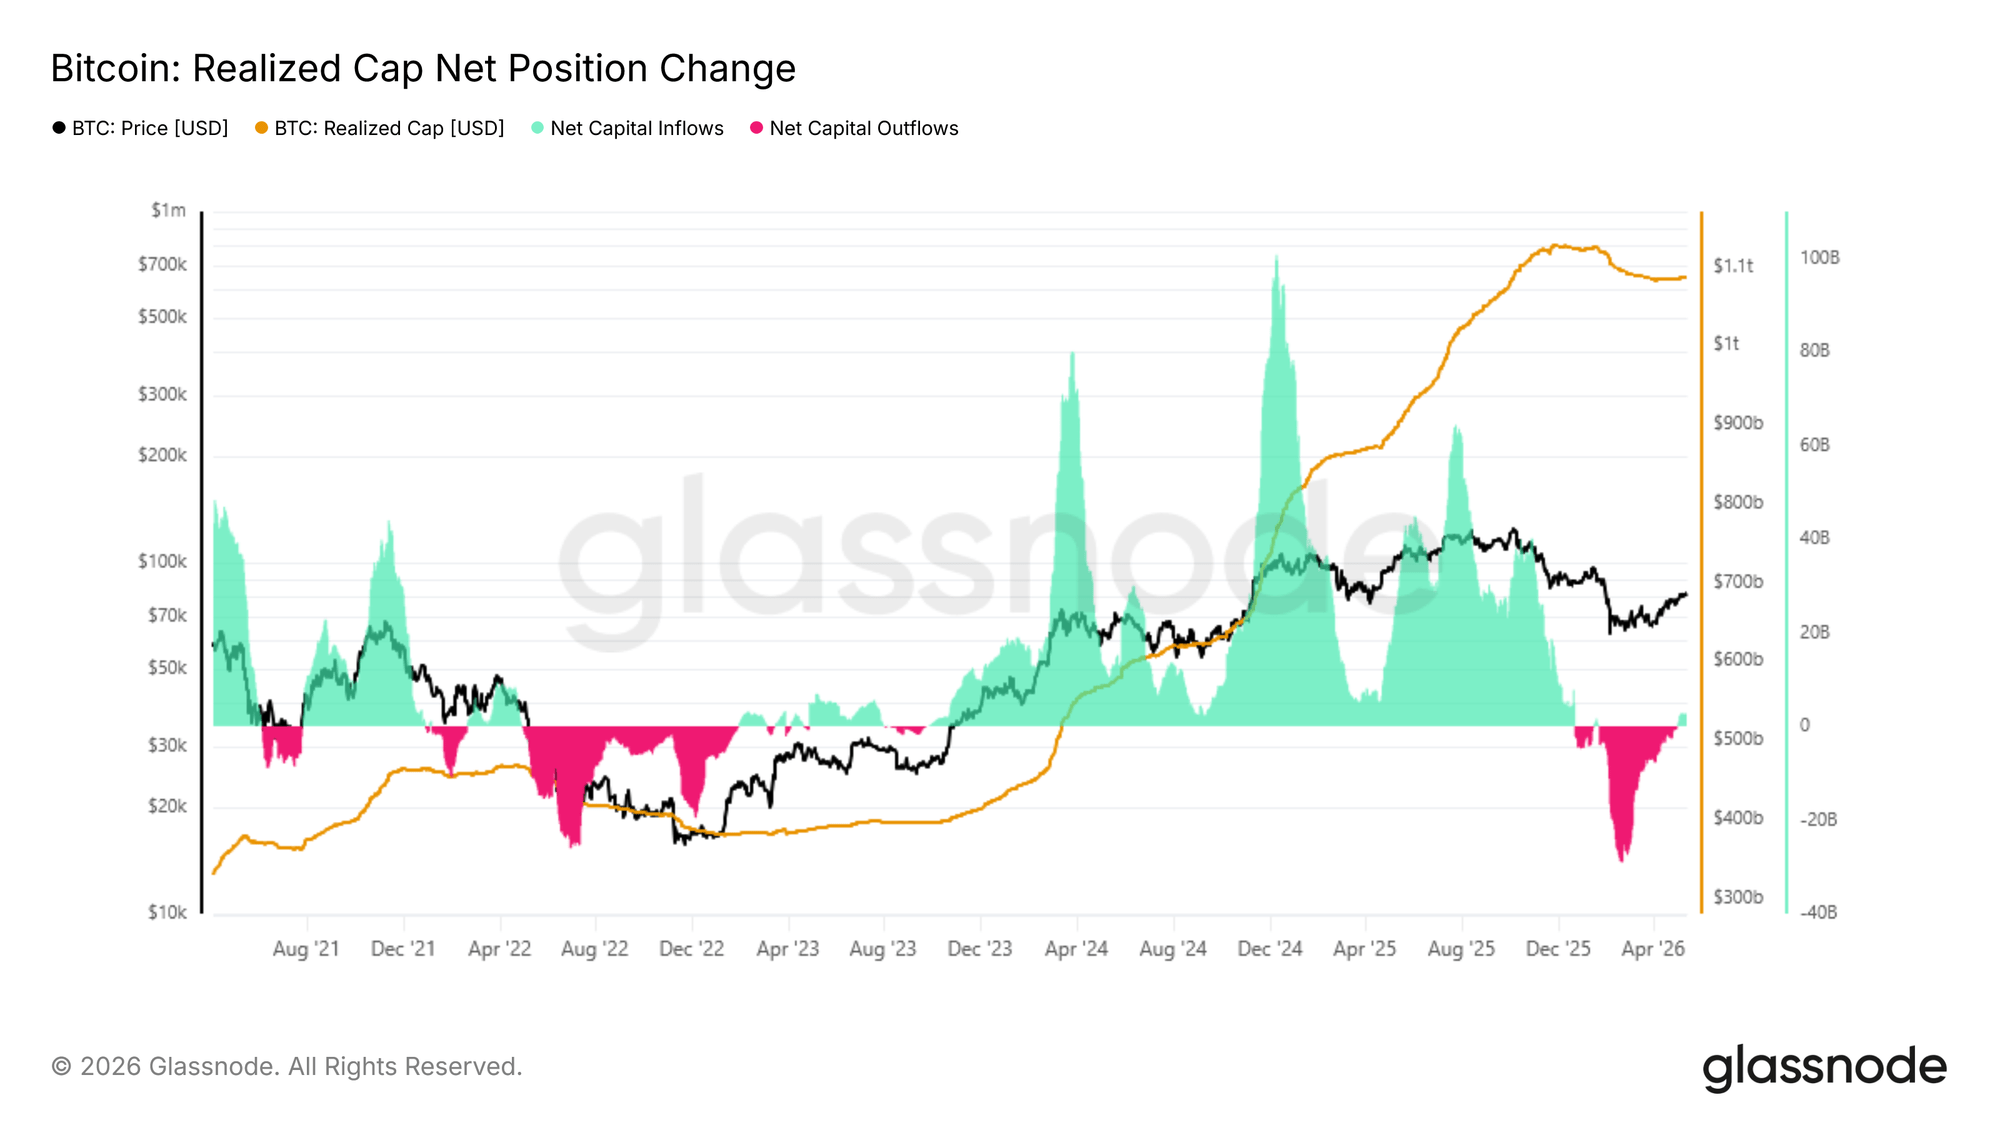
How the capital netflow of the asset has fluctuated over the years | Source: Glassnode's The Week Onchain - Week 19, 2026

Recently, however, the indicator has recovered back into the green zone, implying capital is once again flowing into Bitcoin. Glassnode explained, though:

The current reading, while encouraging, remains significantly below that threshold, suggesting the capital inflow underpinning this recovery lacks the conviction seen at comparable inflection points in the prior cycle.

BTC Price

Bitcoin has been stuck in sideways movement recently as its price is still trading around $81,300.

The trend in the price of the coin over the last five days | Source: BTCUSDT on TradingView

Related Questions

QAccording to Glassnode, what is the current level of Bitcoin's Relative Unrealized Loss, and what sentiment does this value indicate?

AAccording to Glassnode, Bitcoin's Relative Unrealized Loss currently stands at approximately 8%. This decline is described as indicating a transition in market sentiment 'from fear toward uncertainty rather than capitulation.'

QWhat is the significance of the 25% Relative Unrealized Loss peak seen during the February crash, according to the article?

AThe 25% Relative Unrealized Loss peak during the February crash meant that investor losses ballooned to a quarter of Bitcoin's entire market cap. However, the article notes this level is significantly lower than the highs seen in previous bear market cycles.

QWhat would it imply if the $60,000 price level proves to have been the cycle low for Bitcoin?

AIf the $60,000 price level proves to have been the cycle low, this bear market would stand as the shallowest on record. It would be one that registered fear but stopped well short of the broad capitulation that has historically marked durable cycle bottoms.

QWhat recent trend does the article highlight regarding the 30-day change in Bitcoin's Realized Cap?

AThe article highlights that the 30-day change in Bitcoin's Realized Cap, which had plunged deep into negative territory earlier, has recently recovered back into the green zone. This implies capital is once again flowing into the Bitcoin network.

QWhat is Bitcoin's approximate price at the time of the article, and what is its recent price behavior?

AAt the time of the article, Bitcoin's price is trading around $81,300. It has been stuck in sideways movement recently.

Related Reads

STRC Breaks Below $95: Why Does It Continue to Depeg? Is There Default Risk?

"STRC Falls Below $95: Why the Persistent Depegging and Is There Default Risk?" The article discusses the recent decline in the price of STRC, a perpetual preferred stock issued by Strategy (MSTR) designed to trade around a $100 par value. As of publication, STRC traded at $94.65, raising market concerns. STRC is described as a high-yield cash flow product, offering an 11.50% annual dividend paid monthly. Its "preferred" status grants it priority over common stock for dividends and in liquidation. Key reasons cited for the price depegging include: 1. **Bitcoin's Price Drop:** MSTR's assets are heavily tied to Bitcoin (BTC), which fell over 21% from its recent high, pressuring all Strategy-related products. 2. **Competitive Pressure:** Rival Strive Asset Management's similar product, SATA, offers daily dividends and has maintained its $100 par value with a ~13% yield. In response, Strategy has proposed changing STRC's dividend frequency from monthly to bi-weekly, pending shareholder vote. 3. **Technical Selling:** A break below $100 may have triggered algorithmic selling and stop-losses, exacerbating the decline. Regarding default risk, the analysis suggests it is currently low. Strategy founder Michael Saylor confirmed the June 2026 dividend rate remains at 11.50% with no cuts or suspensions. The company's massive reserve of 843,706 BTC provides a significant backstop for its obligations. Industry opinions are mixed. Some analysts view the BTC holdings as reliable support for dividends, while critics like Peter Schiff warn of potential dividend cuts leading to price crashes and lawsuits. Others highlight inflation risk and the company's ability to reduce dividends without a formal default. In summary, STRC's drop is attributed to BTC volatility, competition, and technical factors. While immediate default risk appears contained, the product faces challenges from market conditions and competitive dynamics.

marsbit10m ago

STRC Breaks Below $95: Why Does It Continue to Depeg? Is There Default Risk?

marsbit10m ago

AI Trading Cools, South Korean Stocks Plunge 1.8%, Spot Gold Rises 1%, Bitcoin Dives

A sell-off in AI-related stocks, triggered by Broadcom's disappointing earnings forecast, sent shockwaves through global markets. South Korea's KOSPI led Asia's decline, plunging 1.8% as the risks from concentrated chip stock gains and surging leveraged investments came to the fore. The tech-heavy Nasdaq 100 futures fell 0.5% following Broadcom's 14% after-hours plunge, which signaled a slower-than-expected transition to AI clients. This pullback extended Wall Street's weakness, halting the S&P 500's nine-day rally amid hawkish Fed signals and renewed Middle East tensions. South Korean authorities convened an emergency meeting, pledging "immediate measures" against market volatility and warning of record-high stock margin debt. The adjustment rippled across assets: Bitcoin fell to around $64,000, its lowest since February, while safe-haven gold rose 1% on bargain hunting. Oil prices dipped on Middle East ceasefire news. Market analysts noted the sell-off was driven by profit-taking after massive gains, particularly in chip stocks like Samsung and SK Hynix, which now dominate the KOSPI. Wall Street banks are divided on Korea's outlook, with Goldman Sachs raising its target while Citigroup and others warn of overvaluation and a potential bubble. Bridgewater's Ray Dalio noted that great technological shifts often create bubbles. Meanwhile, Fed officials' hints at potential future rate hikes added to the cautious mood ahead of key U.S. jobs data.

华尔街日报36m ago

AI Trading Cools, South Korean Stocks Plunge 1.8%, Spot Gold Rises 1%, Bitcoin Dives

华尔街日报36m ago

Seeking Alpha's Hot Article: Why Might the U.S. Stock Market Crash in June?

In a recent Seeking Alpha article, financial professor and analyst Damir Tokic argues that the US stock market may be poised for a significant crash in June 2026. The core thesis centers on a "mega-bubble" in equities, particularly within the technology sector, which has driven the S&P 500 to near-record valuations, with a Shiller P/E ratio exceeding 40—a level comparable to the 2000 dot-com bubble. Tokic identifies two primary catalysts for a potential collapse. First, he points to unsustainable market exuberance fueled by what he terms the "Trump Stimulus"—massive AI capital expenditure by tech giants, which he believes is politically driven and cannot last. Second, and more urgently, he highlights the escalating Iran war as a critical threat. The ongoing closure of the Strait of Hormuz has created a severe global energy supply crunch. Strategic petroleum reserves are projected to hit critically low operational levels by June, potentially causing oil prices to spike above $200 per barrel and triggering a severe, supply-driven inflationary shock. This scenario, Tokic warns, would force the Federal Reserve's hand. Despite currently maintaining a dovish bias, the Fed would likely be compelled to officially pivot to a hawkish stance at its June FOMC meeting to combat soaring inflation and bond yields. He contends that such a shift—or even a failure to act, which would destroy Fed credibility—could be the trigger that punctures the market bubble. The resulting downturn, he concludes, could rival the bear markets of 2000 and 2008, advising investors to prepare for a major correction.

marsbit58m ago

Seeking Alpha's Hot Article: Why Might the U.S. Stock Market Crash in June?

marsbit58m ago

Trading

Spot
Futures

Hot Articles

What is $BITCOIN

DIGITAL GOLD ($BITCOIN): A Comprehensive Analysis Introduction to DIGITAL GOLD ($BITCOIN) DIGITAL GOLD ($BITCOIN) is a blockchain-based project operating on the Solana network, which aims to combine the characteristics of traditional precious metals with the innovation of decentralized technologies. While it shares a name with Bitcoin, often referred to as “digital gold” due to its perception as a store of value, DIGITAL GOLD is a separate token designed to create a unique ecosystem within the Web3 landscape. Its goal is to position itself as a viable alternative digital asset, although specifics regarding its applications and functionalities are still developing. What is DIGITAL GOLD ($BITCOIN)? DIGITAL GOLD ($BITCOIN) is a cryptocurrency token explicitly designed for use on the Solana blockchain. In contrast to Bitcoin, which provides a widely recognized value storage role, this token appears to focus on broader applications and characteristics. Notable aspects include: Blockchain Infrastructure: The token is built on the Solana blockchain, known for its capacity to handle high-speed and low-cost transactions. Supply Dynamics: DIGITAL GOLD has a maximum supply capped at 100 quadrillion tokens (100P $BITCOIN), although details regarding its circulating supply are currently undisclosed. Utility: While precise functionalities are not explicitly outlined, there are indications that the token could be utilized for various applications, potentially involving decentralized applications (dApps) or asset tokenization strategies. Who is the Creator of DIGITAL GOLD ($BITCOIN)? At present, the identity of the creators and development team behind DIGITAL GOLD ($BITCOIN) remains unknown. This situation is typical among many innovative projects within the blockchain space, particularly those aligning with decentralized finance and meme coin phenomena. While such anonymity may foster a community-driven culture, it intensifies concerns about governance and accountability. Who are the Investors of DIGITAL GOLD ($BITCOIN)? The available information indicates that DIGITAL GOLD ($BITCOIN) does not have any known institutional backers or prominent venture capital investments. The project seems to operate on a peer-to-peer model focused on community support and adoption rather than traditional funding routes. Its activity and liquidity are primarily situated on decentralized exchanges (DEXs), such as PumpSwap, rather than established centralized trading platforms, further highlighting its grassroots approach. How DIGITAL GOLD ($BITCOIN) Works The operational mechanics of DIGITAL GOLD ($BITCOIN) can be elaborated on based on its blockchain design and network attributes: Consensus Mechanism: By leveraging Solana’s unique proof-of-history (PoH) combined with a proof-of-stake (PoS) model, the project ensures efficient transaction validation contributing to the network's high performance. Tokenomics: While specific deflationary mechanisms have not been extensively detailed, the vast maximum token supply implies that it may cater to microtransactions or niche use cases that are still to be defined. Interoperability: There exists the potential for integration with Solana’s broader ecosystem, including various decentralized finance (DeFi) platforms. However, the details regarding specific integrations remain unspecified. Timeline of Key Events Here is a timeline that highlights significant milestones concerning DIGITAL GOLD ($BITCOIN): 2023: The initial deployment of the token occurs on the Solana blockchain, marked by its contract address. 2024: DIGITAL GOLD gains visibility as it becomes available for trading on decentralized exchanges like PumpSwap, allowing users to trade it against SOL. 2025: The project witnesses sporadic trading activity and potential interest in community-led engagements, although no noteworthy partnerships or technical advancements have been documented as of yet. Critical Analysis Strengths Scalability: The underlying Solana infrastructure supports high transaction volumes, which could enhance the utility of $BITCOIN in various transaction scenarios. Accessibility: The potential low trading price per token could attract retail investors, facilitating wider participation due to fractional ownership opportunities. Risks Lack of Transparency: The absence of publicly known backers, developers, or an audit process may yield skepticism regarding the project's sustainability and trustworthiness. Market Volatility: The trading activity is heavily reliant on speculative behavior, which can result in significant price volatility and uncertainty for investors. Conclusion DIGITAL GOLD ($BITCOIN) emerges as an intriguing yet ambiguous project within the rapidly evolving Solana ecosystem. While it attempts to leverage the “digital gold” narrative, its departure from Bitcoin's established role as a store of value underscores the need for a clearer differentiation of its intended utility and governance structure. Future acceptance and adoption will likely depend on addressing the current opacity and defining its operational and economic strategies more explicitly. Note: This report encompasses synthesised information available as of October 2023, and developments may have transpired beyond the research period.

363 Total ViewsPublished 2025.05.13Updated 2025.05.13

What is $BITCOIN

Discussions

Welcome to the HTX Community. Here, you can stay informed about the latest platform developments and gain access to professional market insights. Users' opinions on the price of BTC (BTC) are presented below.

活动图片