Analyzing Virtuals Protocol’s bounce from golden pocket – Will $1 be next?

ambcryptoPublished on 2026-03-24Last updated on 2026-03-24

Abstract

Virtuals Protocol (VIRTUAL) saw an 83% surge in daily trading volume and a 3% price increase in the past 24 hours. However, market sentiment remains bearish, indicated by a predominantly negative funding rate and only a slight 1.75% rise in Open Interest. Despite a bearish higher timeframe trend, the token defended the $0.68 support level after a rejection at $0.82. This bullish reaction suggests potential gains ahead, with a rally toward the $0.875–$0.955 range likely. In the coming weeks, VIRTUAL could target $1, especially if the current bullish structure holds.

Virtuals Protocol [VIRTUAL] witnessed an 83% boost in daily trading volume and saw a 3% price gain in the past 24 hours. Its Open Interest [OI] was only up 1.75%, which suggested speculative conviction behind the AI token was relatively weak.

Source: Coinalyze

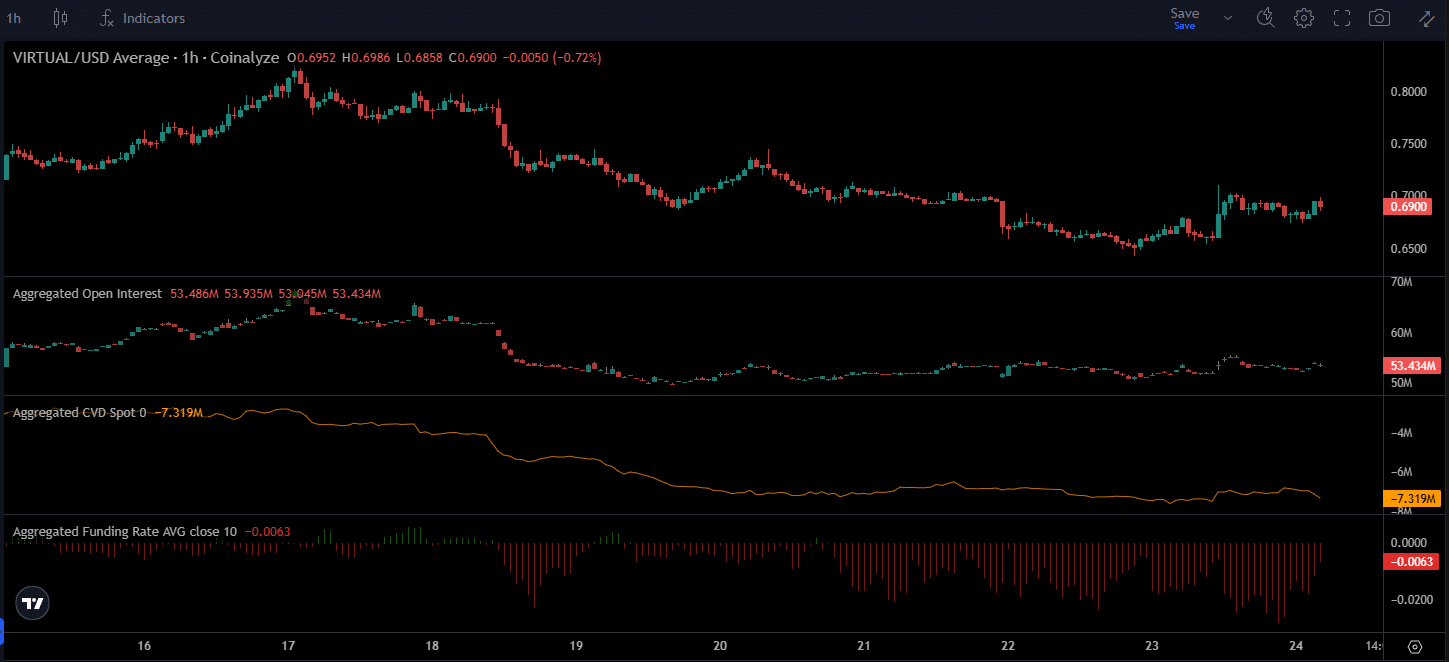
Coinalyze data showed that the Funding Rate was predominantly negative over the past week.

At the same time, the Spot CVD has been flat. Combined with the weak increase in OI, it showed that the VIRTUAL market sentiment remained bearish.

Let’s break it down from the higher timeframes.

Source: VIRTUAL/USDT on TradingView

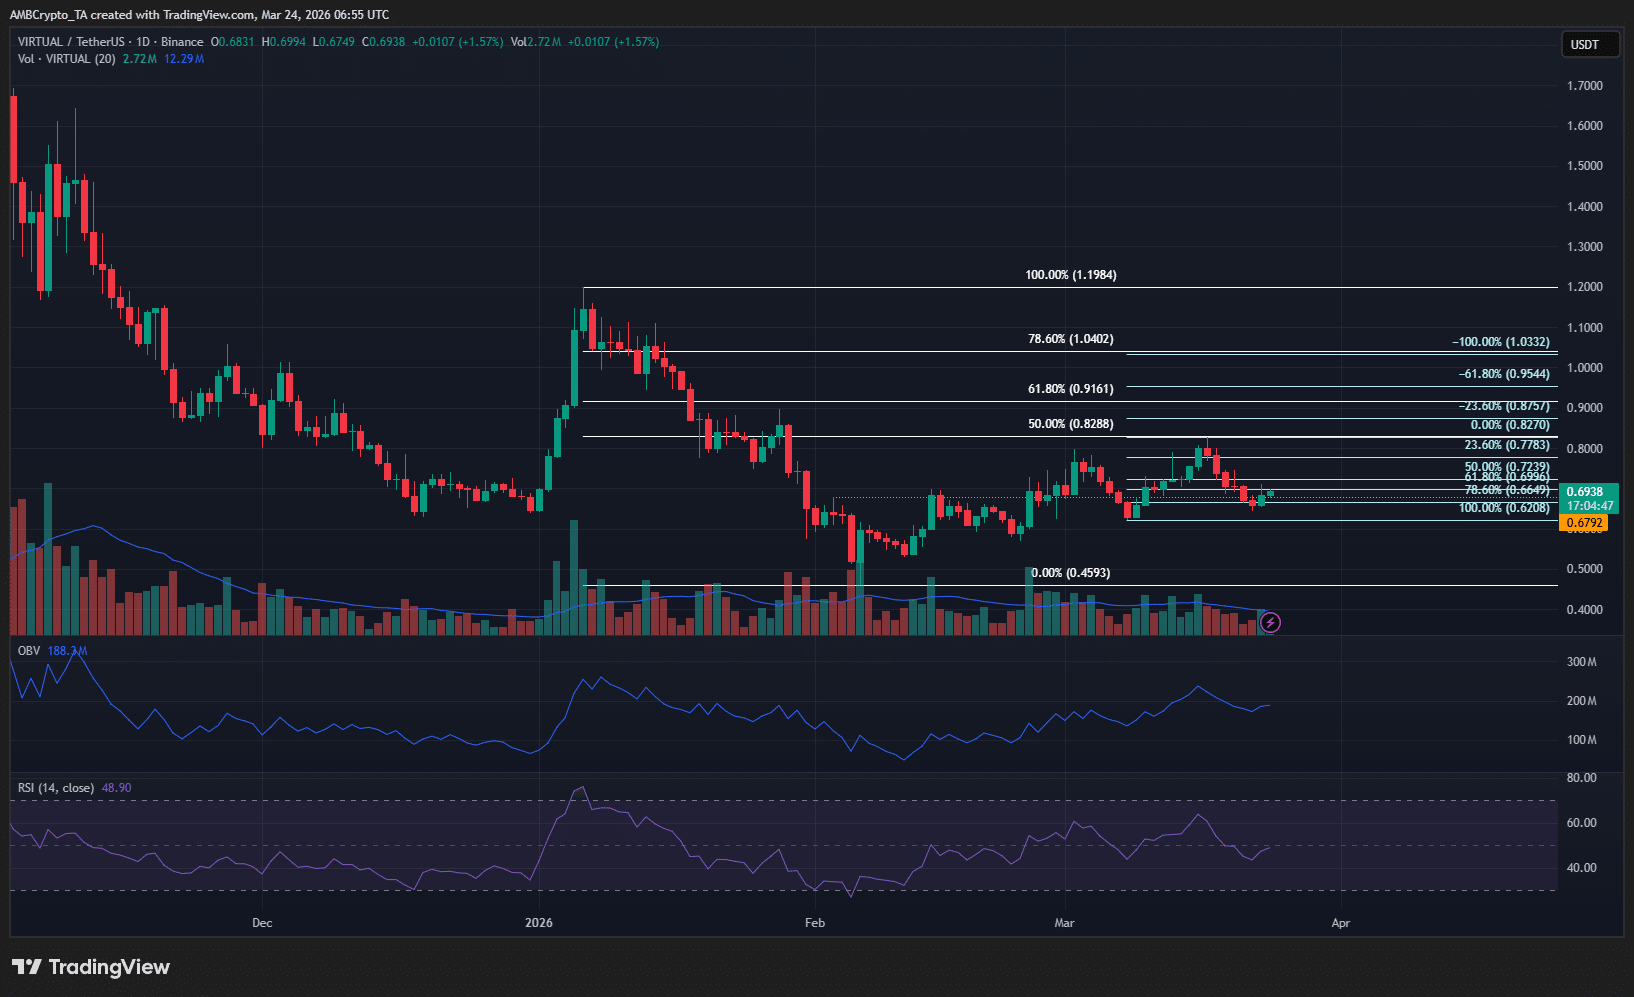
On the 1-day chart, the trend was bearish. The swing structure was bearish, and a set of Fibonacci retracement levels (white) was plotted using this.

At the same time, the internal structure was bullish.

The price faced rejection from the $0.82 level, the 50% retracement (white), but the $0.68 local support zone was defended.

This meant that further gains were likely. With Bitcoin [BTC] also back above $70k, the next week or two could see the bulls in control.

Virtuals Protocol token has completed its retracement

A week ago, AMBCrypto pointed out that downside risks were present for the popular AI token. This warning has been proven right, with VIRTUAL retracing from $0.82 to $0.64, a 22% move at its zenith.

This retracement was a healthy one for the bulls in the short-term. At the same time, the long-term structure was bearish. Traders can wait for a move toward $1 before they can begin to anticipate a bearish reaction.

Source: VIRTUAL/USDT on TradingView

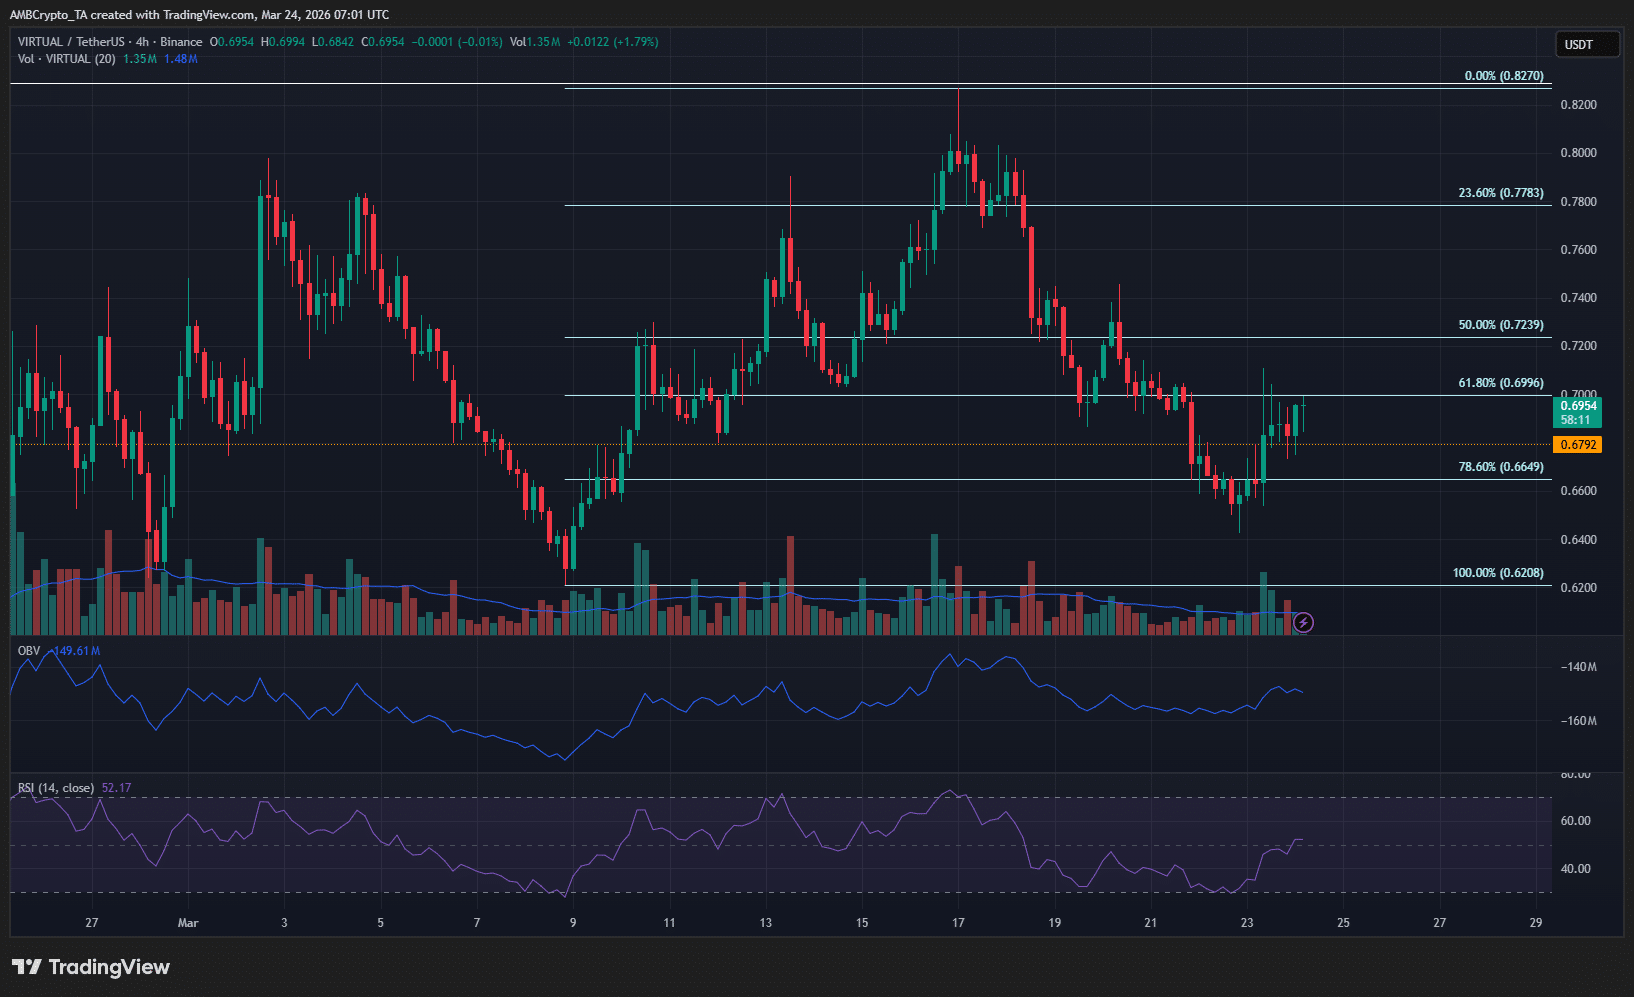
The 4-hour timeframe showed that the $0.665 level was the 78.6% retracement (light blue) of the previous impulse move VIRTUAL made, from $0.62 to $0.82. A bullish reaction at this key retracement level confirmed this bias.

Therefore, it is highly likely that Virtuals Protocol token prices would rally toward $0.875-$0.955 levels next. These were the 23.6% and 61.8% extension levels of this timeframe’s swing structure.


Final Summary

  • Virtuals Protocol exhibited a negative Funding Rate and low Open Interest despite its gains in the past 24 hours.
  • The defense of the $0.66-$0.68 zone confirmed bullish strength and VIRTUAL could rally to $0.95-$1.04 in the coming weeks.

Related Questions

QWhat were the key changes in Virtuals Protocol's trading volume and price in the past 24 hours?

AVirtuals Protocol witnessed an 83% boost in daily trading volume and a 3% price gain in the past 24 hours.

QWhat did the Open Interest (OI) and Funding Rate data suggest about market sentiment for VIRTUAL?

AThe Open Interest was only up 1.75%, and the Funding Rate was predominantly negative over the past week, suggesting speculative conviction was weak and market sentiment remained bearish.

QWhich key support level was defended, indicating potential for further gains?

AThe $0.68 local support zone was defended, which indicated that further gains were likely.

QWhat price levels are VIRTUAL expected to rally towards next according to the analysis?

AVIRTUAL is expected to rally toward the $0.875-$0.955 levels next, and potentially reach $0.95-$1.04 in the coming weeks.

QWhy was the recent retracement from $0.82 to $0.64 considered healthy for the bulls?

AThe retracement was considered healthy for the bulls in the short-term as it allowed for a bullish reaction at a key retracement level, confirming strength and setting the stage for a potential rally.

Related Reads

UBS: The Crowdedness of A-Share Tech Stocks Is Far From Reaching Historical Peaks

UBS: A-share tech stocks still far from peak crowding levels A-shares' technology sector has seen a strong rebound, with trading activity hitting record highs, raising concerns about market crowding. However, UBS Securities argues that a key indicator of institutional positioning suggests the current crowding level remains well below historical peaks. While the large-cap tech sector's share of total A-share trading volume and market capitalization have reached historical highs, the overweight ratio of domestic mutual funds in this sector stood at 9.9% in Q1 2026. This is down from 11.6% in Q3 2025 and significantly lower than the historical peak of 14.1% in Q4 2015. It also pales in comparison to the historical peak overweight of 18.7% for the consumer sector. UBS notes that typical cycles from a low to a peak in fund overweighting last about three years, and the current outperformance of the tech/growth style has lasted less than two years since the policy pivot in September 2024. UBS expects A-share earnings recovery to accelerate, providing fundamental support. It forecasts 2026 A-share profit growth to rise to 11% from 3.9% in 2025. Non-financial A-share profits grew 11.8% YoY in Q1 2026, with gross and net profit margins at their highest since 2023. Persistent fund inflows, the expansion of thematic ETFs, and a recovery in private fund issuance are supporting market liquidity. In tactical allocation, UBS favors growth and cyclical styles under its "slow bull" base case, with overweight ratings on six sectors: Electronics (benefiting from semiconductor inventory recovery and AI innovation), Communications (driven by AI computing demand), Machinery (aided by domestic capex recovery), Non-ferrous Metals (due to rising copper/aluminum prices), Chemicals (supported by anti-involution policies), and Electrical Equipment (driven by policy support and AI data center power demand).

marsbit21m ago

UBS: The Crowdedness of A-Share Tech Stocks Is Far From Reaching Historical Peaks

marsbit21m ago

Trading

Spot
Futures
活动图片