Analyzing if AAVE could target $92 after breaking KEY support

ambcryptoPublished on 2026-03-29Last updated on 2026-03-29

Abstract

AAVE breached the $100 support level amid a broader market decline, falling to a three-week low of $96 and trading at $97 at press time, down 7.7% daily. The market cap dropped by over $200 million. The altcoin fell below its short-term moving averages, reflecting strong bearish pressure. Market participants turned bearish, with the Bulls vs. Bears indicator turning negative after over a month of positivity. Exchange data showed a net inflow of tokens, indicating selling dominance, and the Exchange Supply Ratio hit a monthly high of 0.137. The RSI dropped to 34, nearing oversold conditions, suggesting continued seller control. If bearish momentum persists, AAVE could decline toward $92. A rebound would require reclaiming $100 and key moving averages at $107 and $110; otherwise, the downtrend may continue.

Aave [AAVE] breached the $100 support level amid a broader market slip and fell to a three-week low of $96. In fact, at press time, AAVE traded at $97, down 7.7% on the daily charts, while the market cap fell by over $200 million.

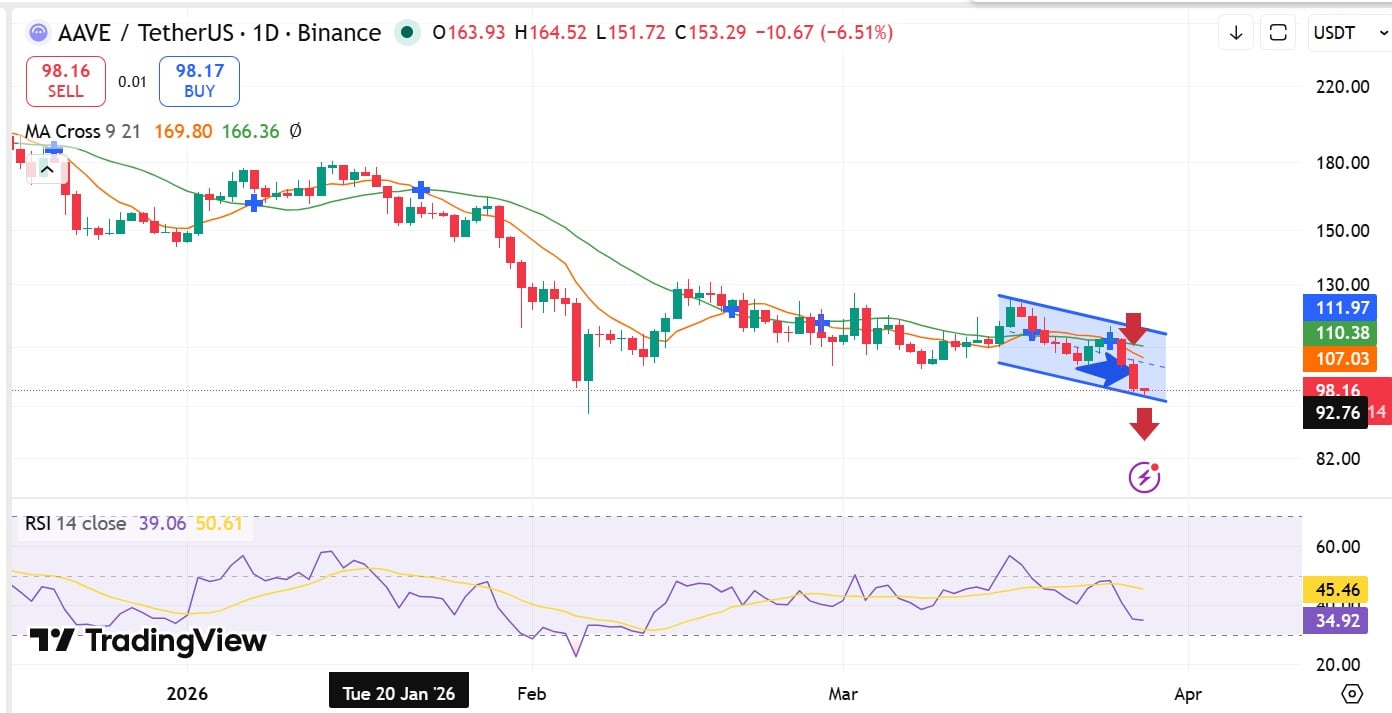
In doing so, the altcoin fell below its short-term Moving Averages (MA), the 9- and 21-day MAs, reflecting strong downside pressure.

AAVE drops below $100

As the crypto market retraced, AAVE market participants turned bearish and began exiting the market aggressively, thereby strengthening downside momentum.

In fact, the Bulls vs. Bears indicator turned negative after being positive for more than a month. When this metric turns negative, it suggests that sellers have dominated the market and displaced buyers.
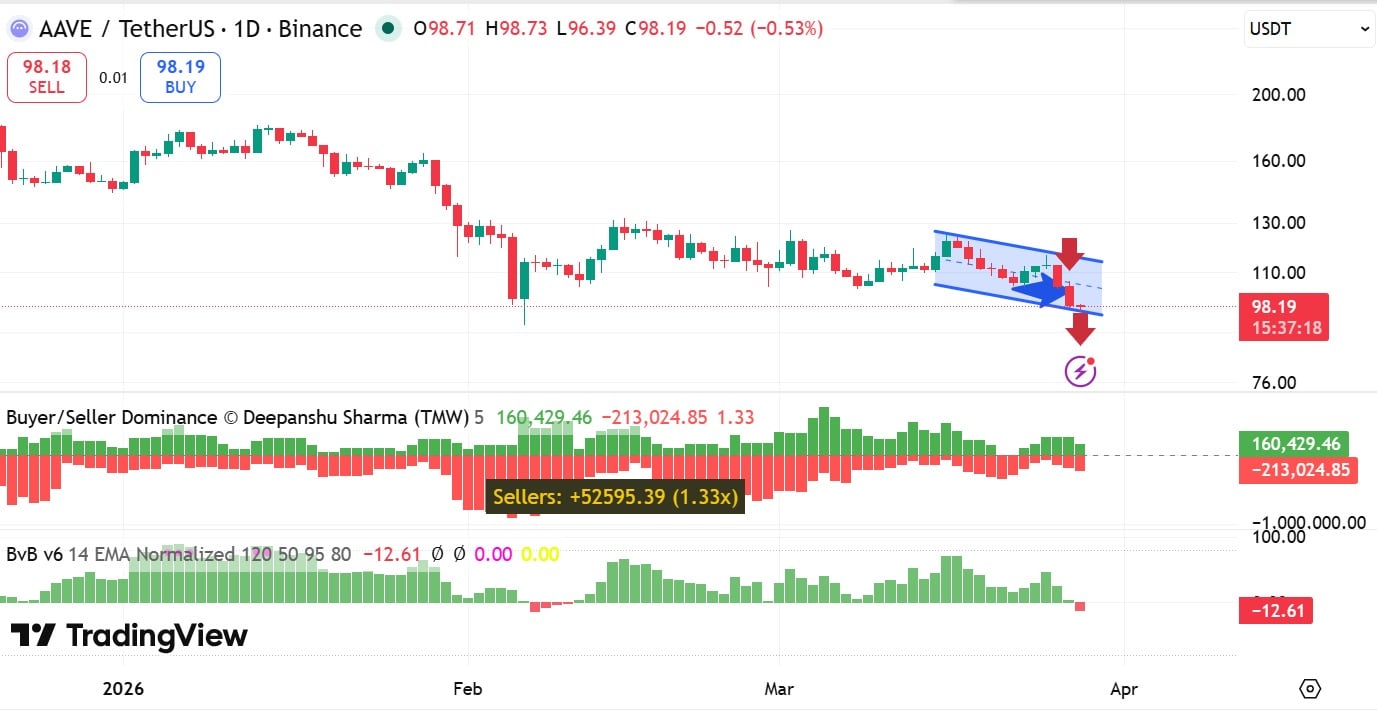
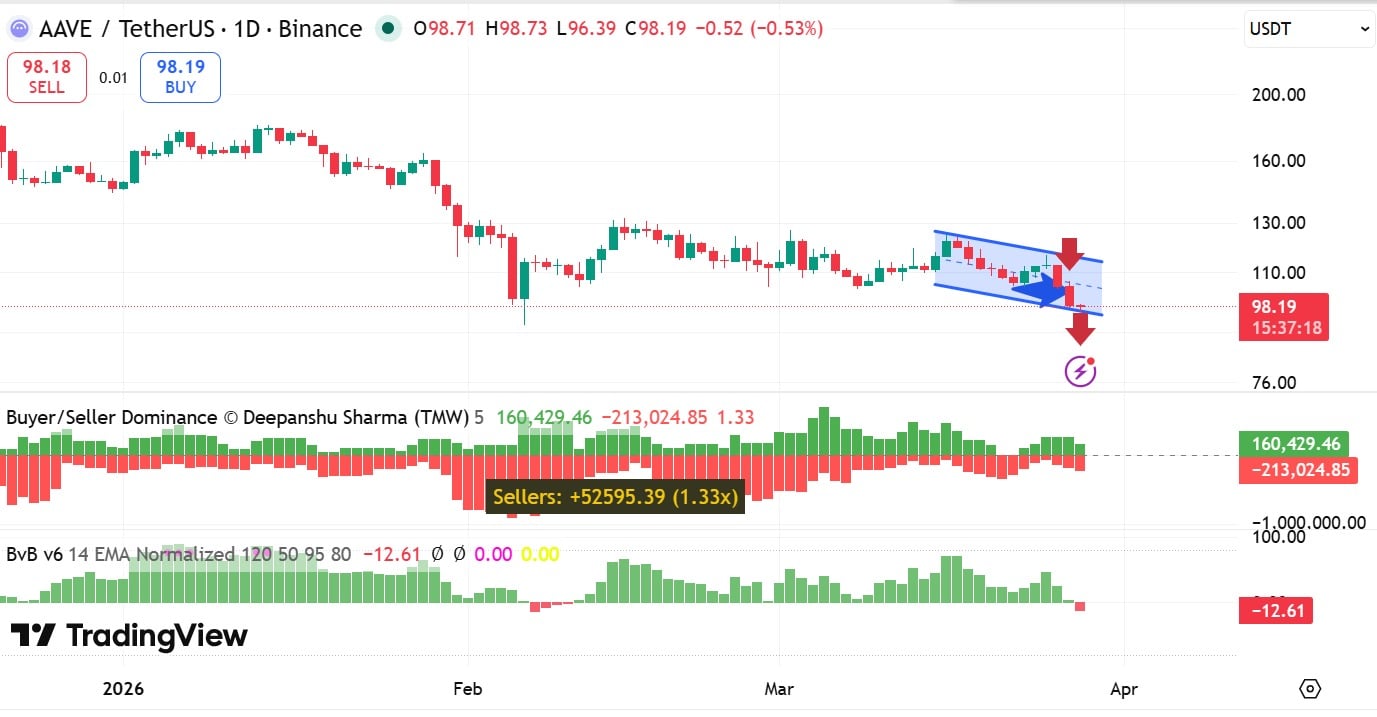
Source: TradingView

Furthermore, exchange activities echoed this seller dominance. According to CryptoQuant data, 79k AAVE tokens flowed into exchanges, compared to 74k flowing out.
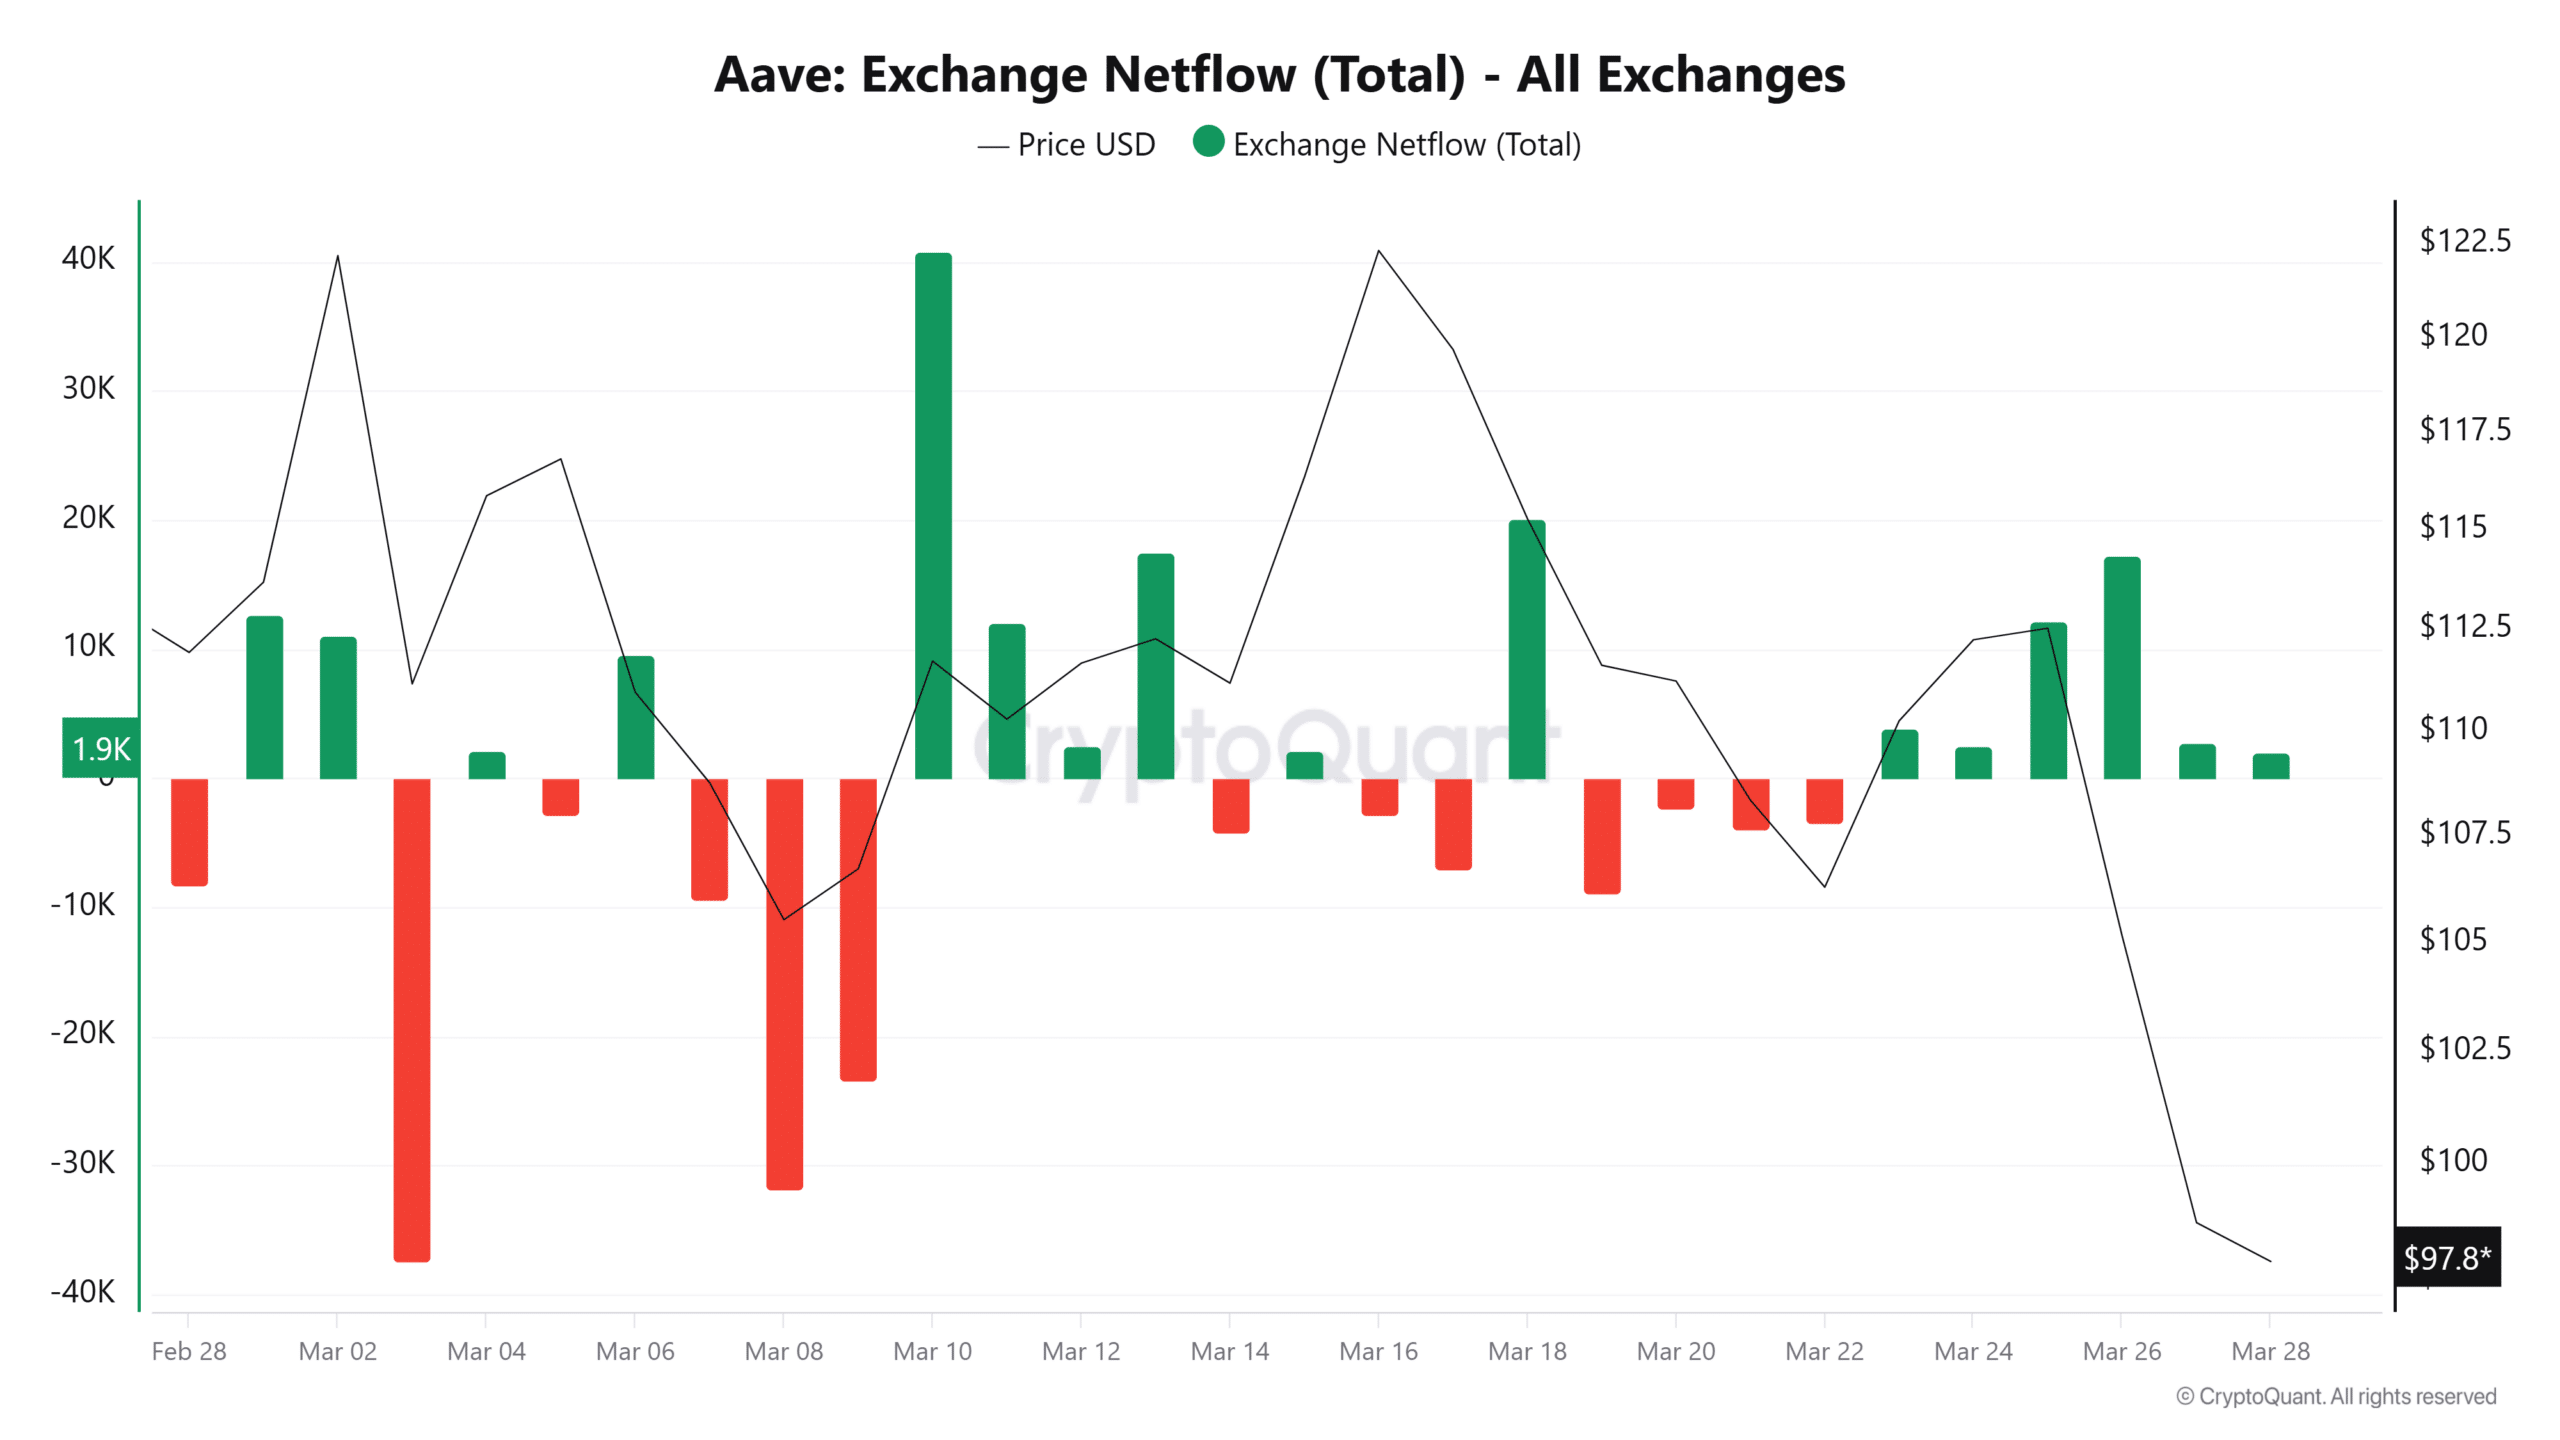
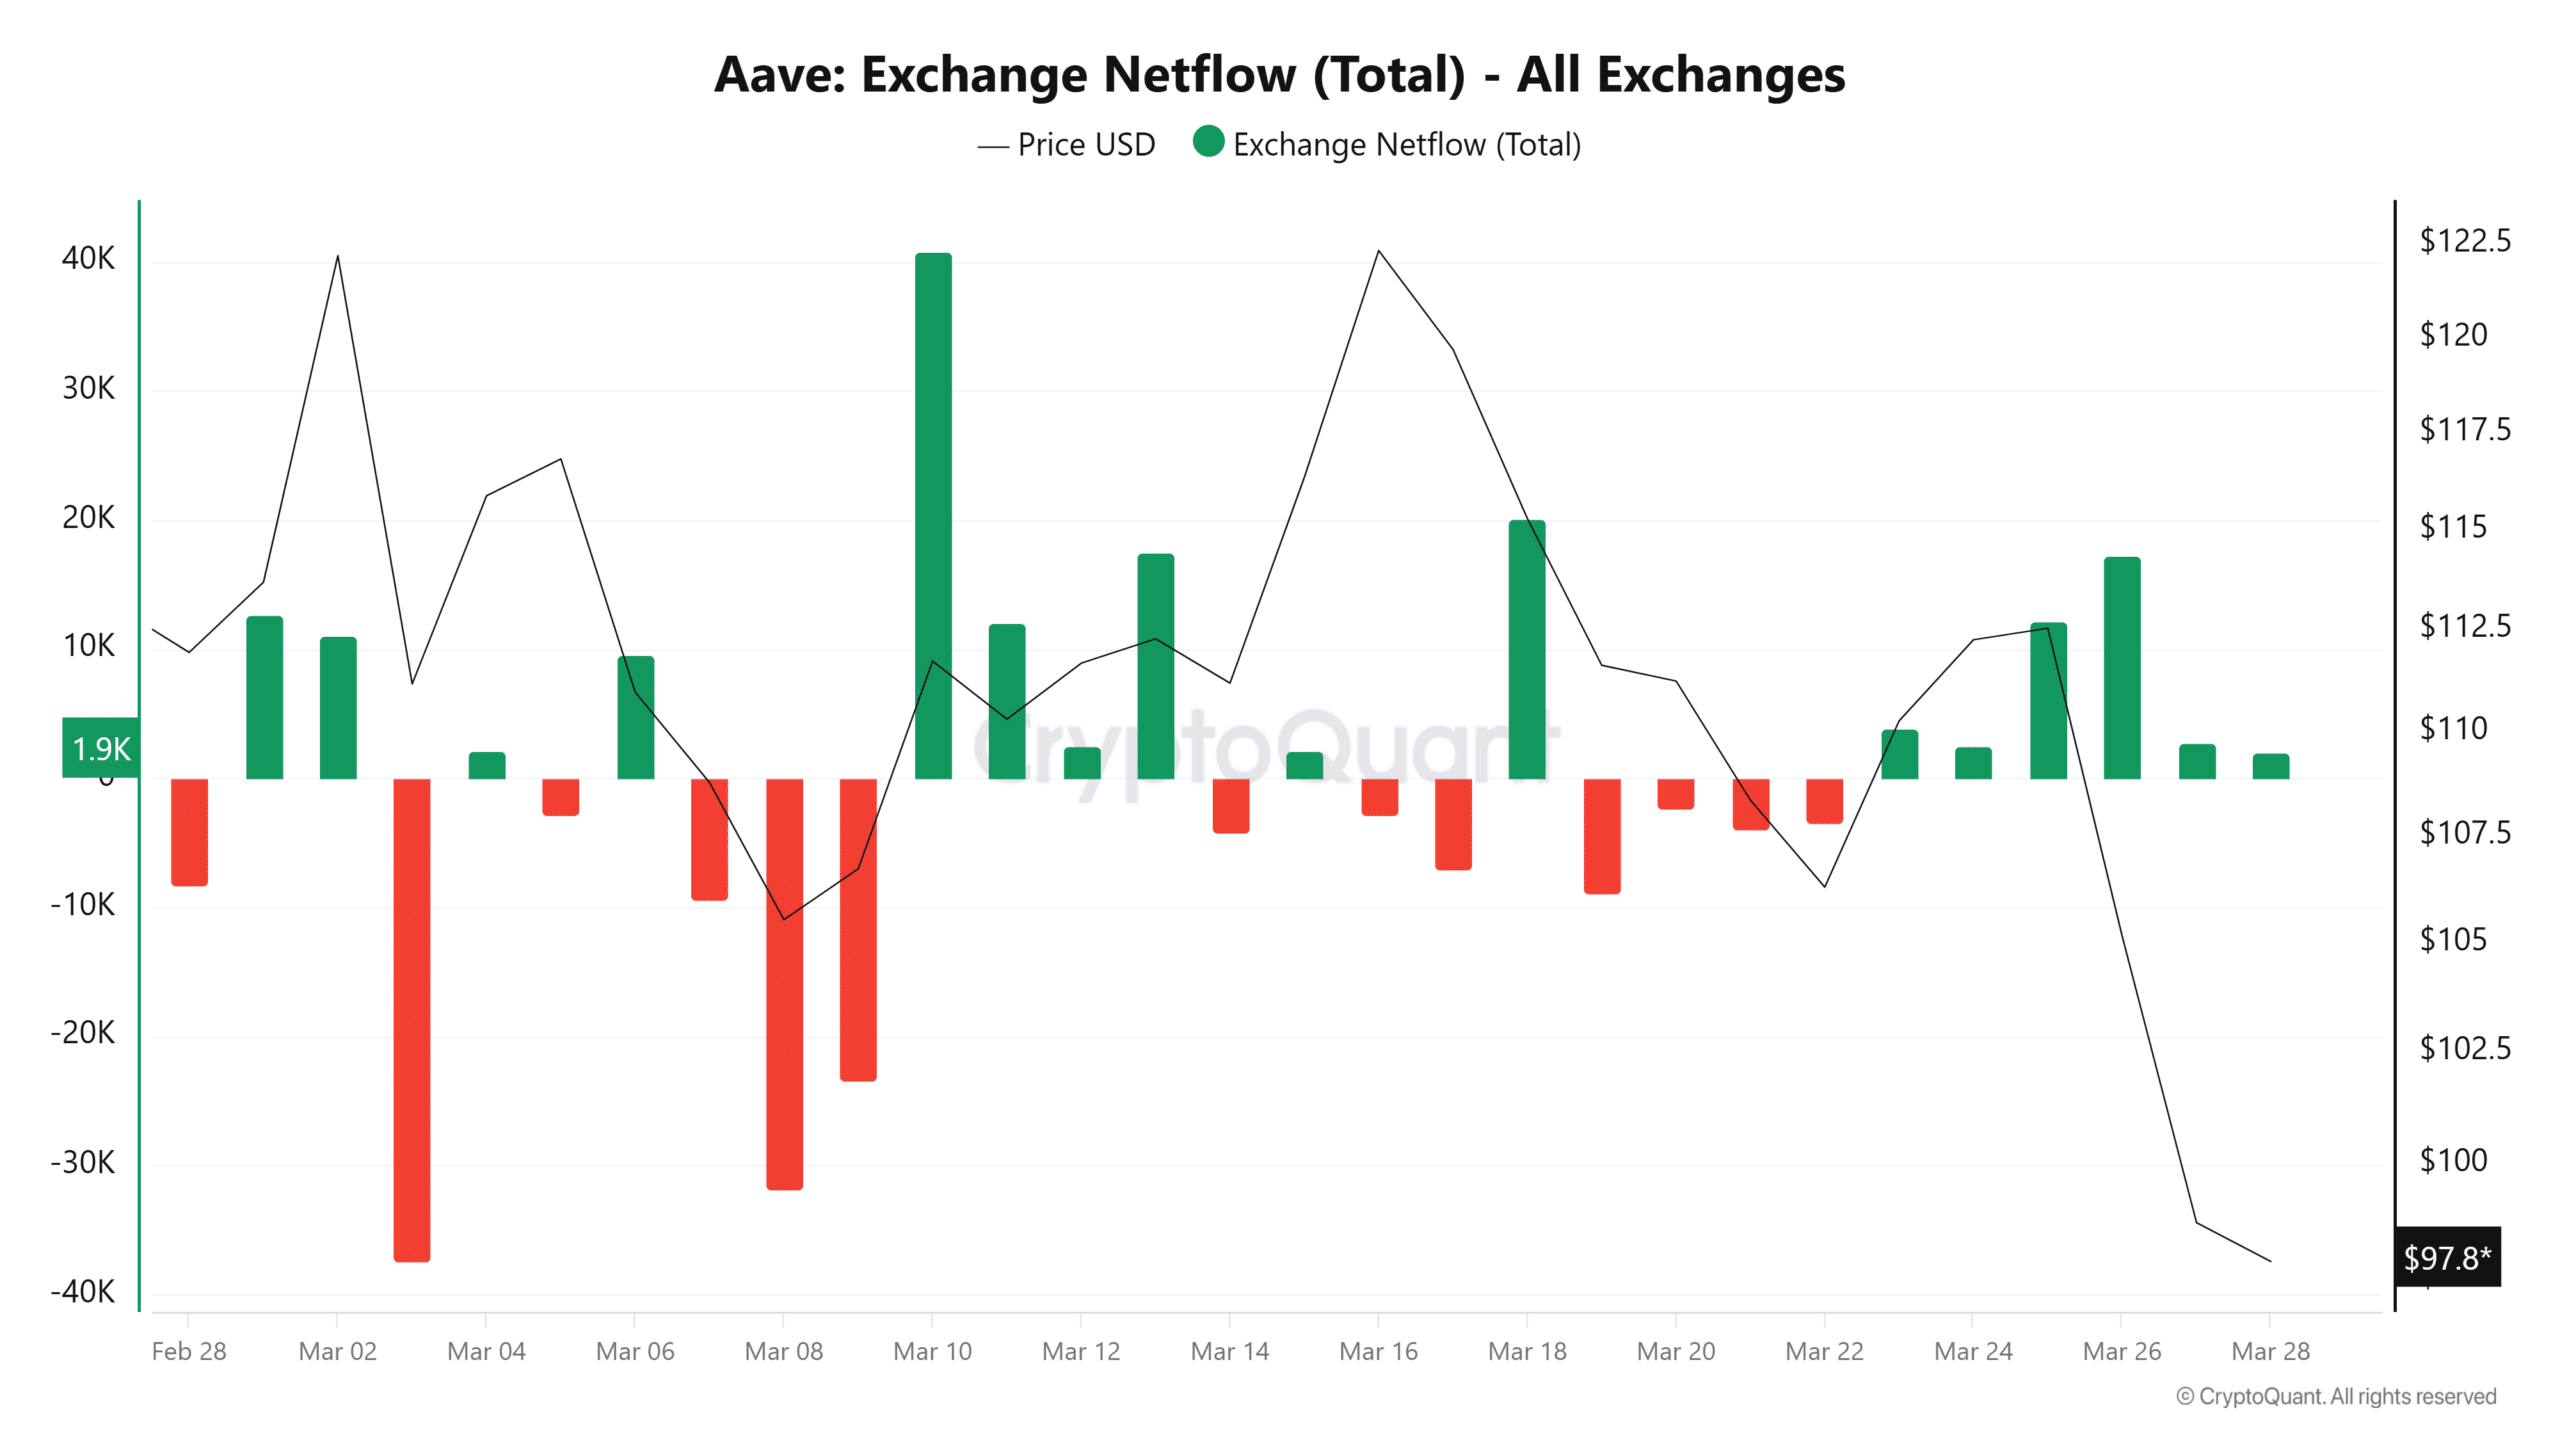
Source: CryptoQuant

Thus, the altcoin’s Netflow extended its hold within the positive zone for the sixth day, suggesting that sellers have had a strong dominance over the market.

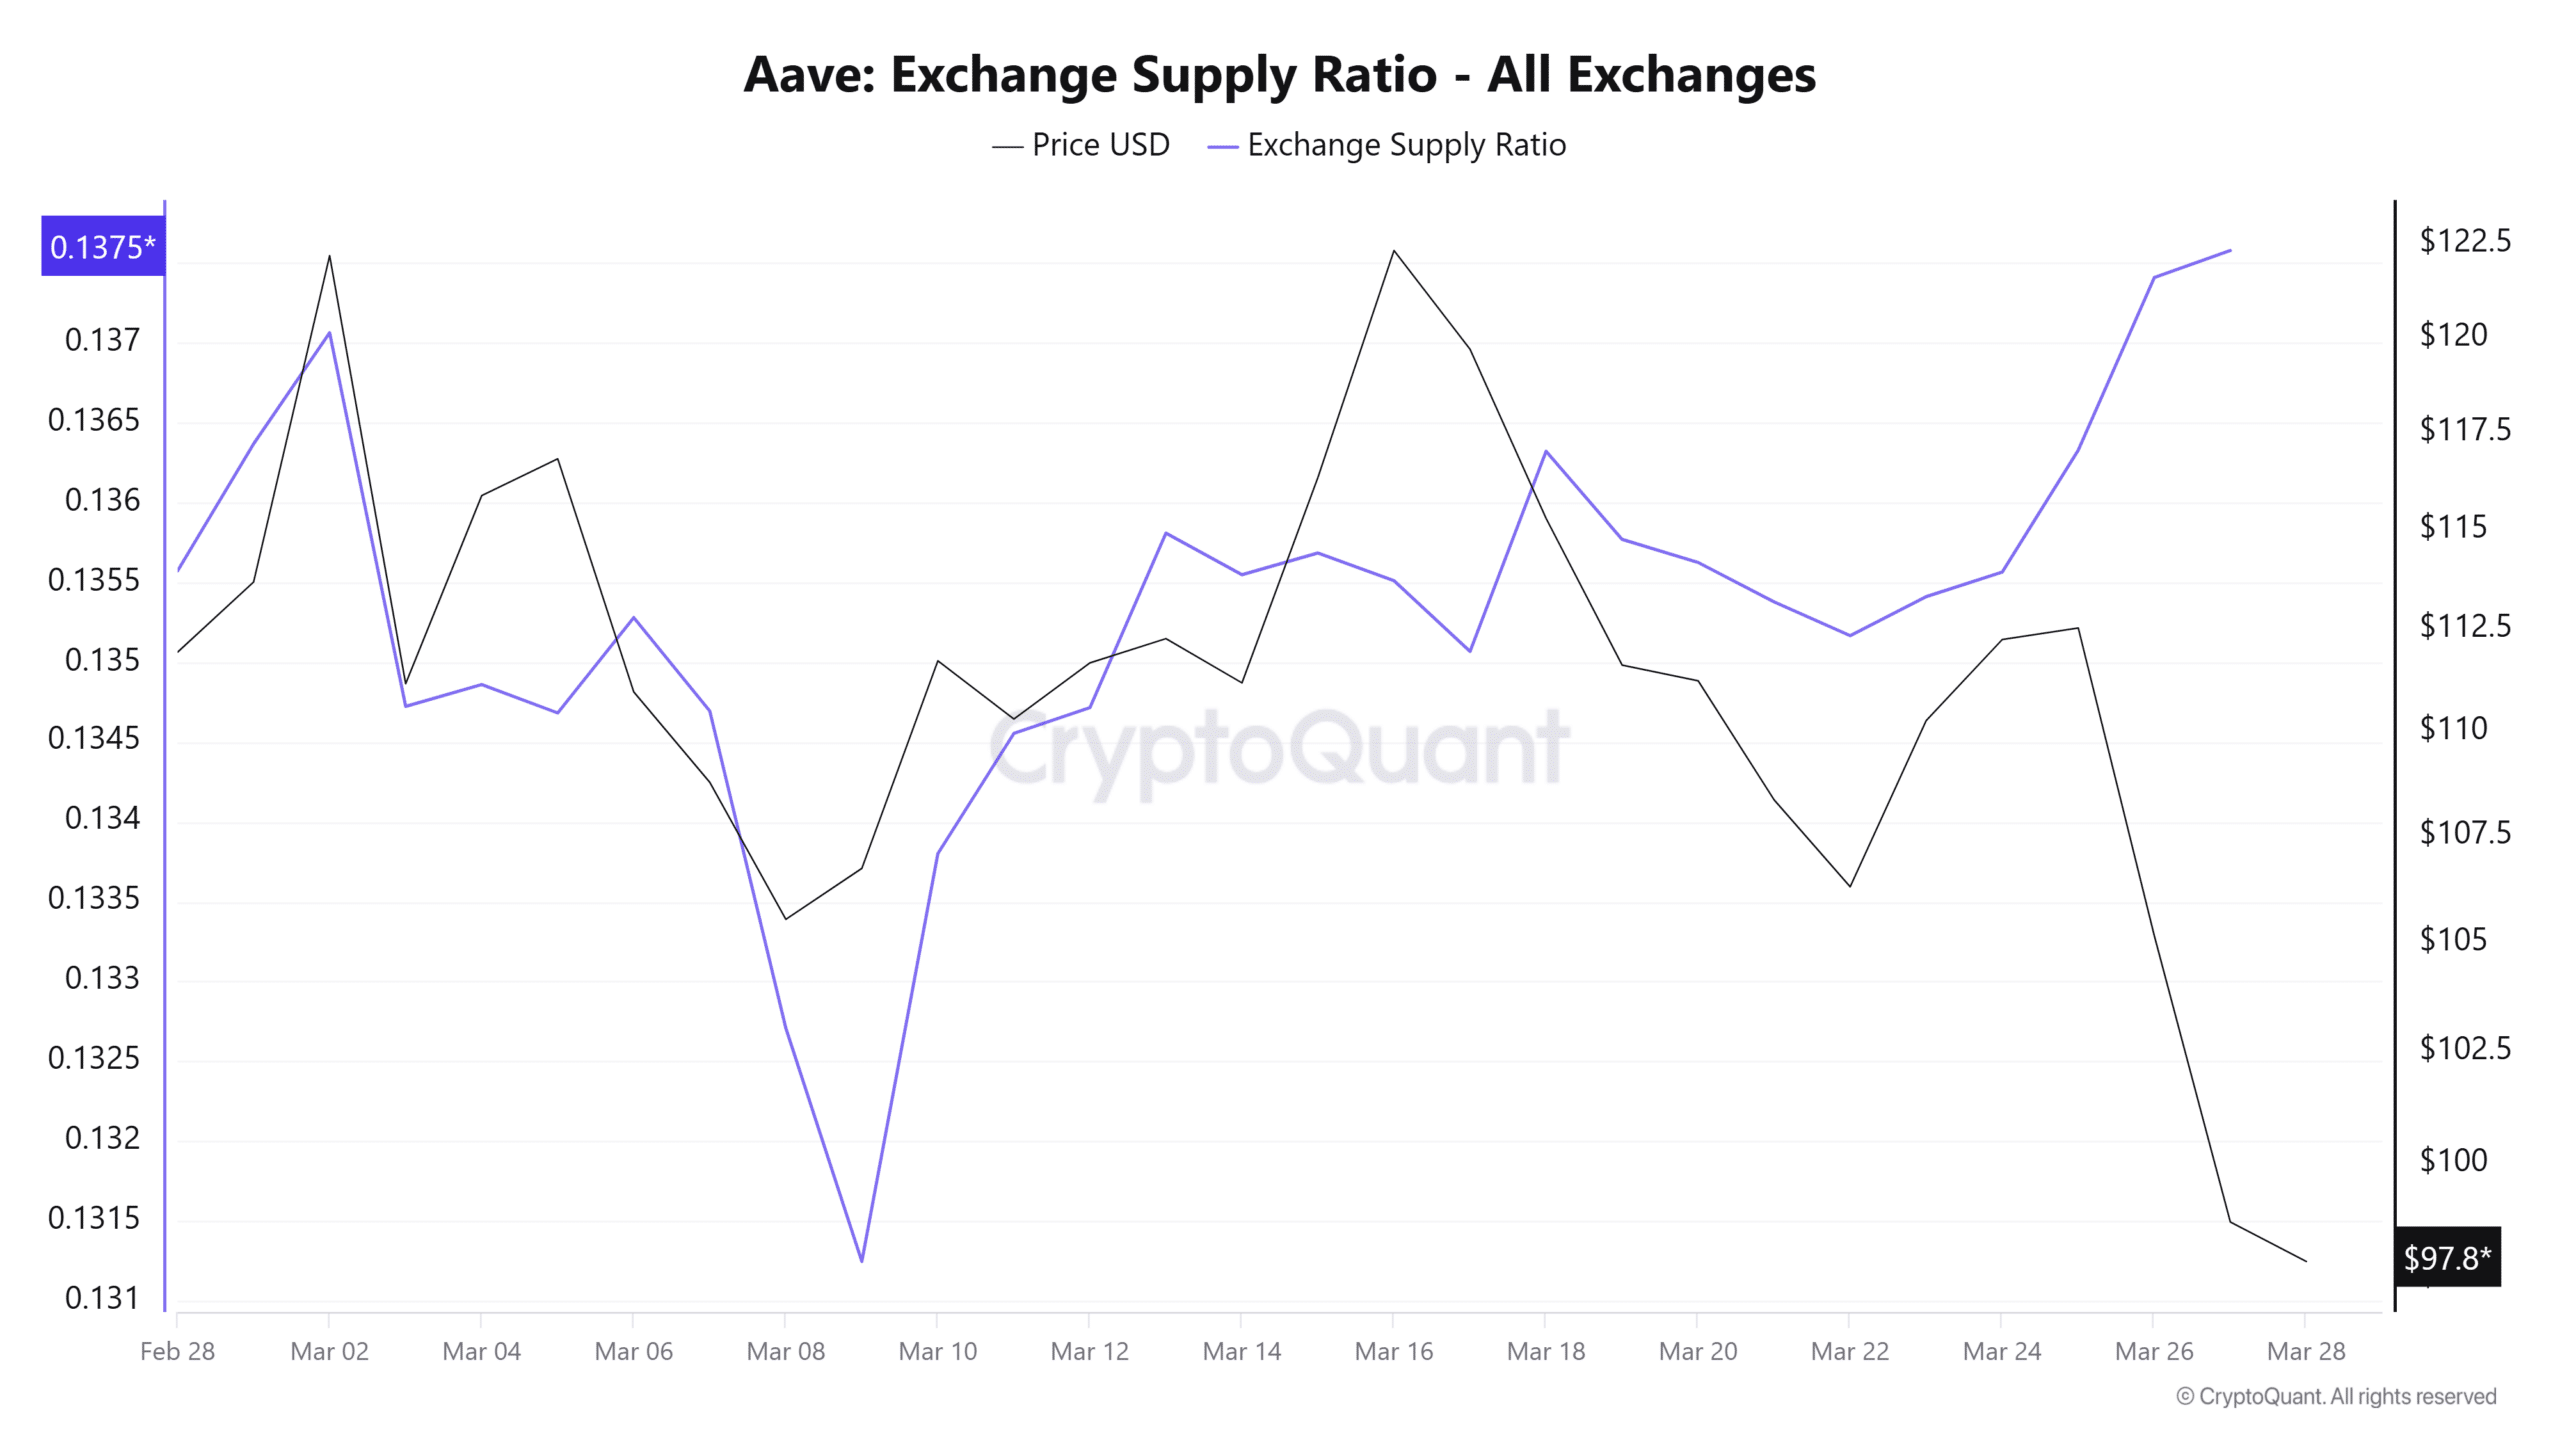
As a result, the altcoin’s Exchange Supply Ratio jumped to a monthly high of 0.137 as of writing, indicating increased selling activity. Often, such a jump in ESR reduces scarcity, thus increasing the supply available for immediate sale.
Source: CryptoQuant

Such a setup on exchanges has preceded strong downward momentum for the asset, leading to lower prices.

What momentum indicators suggest

AAVE has experienced strong downward momentum and breached a key support level, with sellers significantly outpacing buyers. Since then, the altcoin’s Relative Strength Index (RSI) dropped deeper into bearish territory, falling to 34 at press time.

With RSI nearing oversold territory, this suggests sellers’ control of the market, while buyers have largely stepped back. Traditionally, such market conditions have strengthened downward momentum, typically resulting in lower prices.
Source: TradingView

Therefore, if sellers continue to overrun the market with little resistance, AAVE is likely to slide towards $92 before attempting another leg up.

However, if the market cools down and bulls reclaim $100, the altcoin could set the ground for a rebound. But for a significant trend reversal, bulls need to flip $100 and reclaim the 9- and 21-day MAs at $107 and $110, respectively.

Failure to do so will see the altcoin enter an extended bearish streak, with a likelihood of staying below $100.


Final Summary

  • Aave dropped 7.7%, breaching $100 and dropping to a three-week low of $96.
  • AAVE faced intense selling pressure, with bears outpacing bulls, strengthening downside risk.

Related Questions

QWhat key support level did AAVE breach, and what was its price at the time of writing?

AAAVE breached the $100 support level and was trading at $97 at the time of writing.

QWhat does the Bulls vs. Bears indicator turning negative suggest about the AAVE market?

AIt suggests that sellers have dominated the market and displaced buyers, indicating strong bearish sentiment.

QAccording to the data, how did the Netflow and Exchange Supply Ratio (ESR) metrics reflect selling pressure?

AThe Netflow was positive for the sixth day, and the Exchange Supply Ratio jumped to a monthly high of 0.137, both indicating increased selling activity and dominance by sellers.

QWhat does the RSI value of 34 at press time imply for AAVE's price momentum?

AAn RSI of 34 suggests that the market is nearing oversold territory, with sellers in control and strong downward momentum, which could lead to lower prices.

QWhat are the two potential price scenarios for AAVE mentioned in the article?

AIf sellers continue to dominate, AAVE could slide towards $92. If bulls reclaim $100, it could set the stage for a rebound, but a significant reversal requires flipping $100 and reclaiming the 9- and 21-day MAs at $107 and $110.

Related Reads

Why Bitcoin Holds Above $64,000 After Fed's Hard Pause

**Bitcoin Stabilizes Near $64,000 Following Hawkish Fed Pause** The cryptocurrency market, led by Bitcoin, remained stable around $64,000 despite a volatile reaction to the latest U.S. Federal Reserve meeting. The Fed paused interest rates but signaled a hawkish stance, with three committee members voting for an increase—the highest dissent since 2016. This limits risk appetite but hasn't triggered panic selling. Key market highlights include Bitcoin ETFs seeing a net inflow of $32.1 million, breaking a streak of outflows, while Ethereum ETFs experienced outflows of $18.65 million. Liquidations affected about 90,000 traders. Technically, Bitcoin finds support around $63,000-$63,500, with major resistance near $66,000. While its price is about 49% below its all-time high, institutional demand via ETFs and the absence of mass capitulation support a potential recovery scenario in the second half of the year. Major altcoins showed mixed movements, with Solana attracting capital while Ethereum faced selling pressure despite strong on-chain metrics like a growing staking queue. Regulatory news took a pause as the U.S. Senate delayed the CLARITY Act vote until at least autumn. For the final trading day of July, U.S. inflation and consumer spending data will be crucial. Bitcoin's key levels to watch are $63,000 support and $66,000 resistance. Sustained ETF inflows and Bitcoin holding above $63,000 are seen as positive signs for a potential market recovery later in the year.

cryptonews.ru1h ago

Why Bitcoin Holds Above $64,000 After Fed's Hard Pause

cryptonews.ru1h ago

Trading

Spot
活动图片





