Analyst Exposes Bitcoin Market Maker Buy Strategy, Shows What Happens When Accumulation Ends

bitcoinistPublished on 2026-04-18Last updated on 2026-04-18

Abstract

A crypto analyst, Merlijn The Trader, has presented a market structure model suggesting Bitcoin is following an institutional trading cycle. The model outlines four key phases: a "Distribution" phase where large holders sold BTC near highs, a sharp "Flush" that dropped prices 38% to eliminate weak traders, the current "Accumulation" phase where institutions are buying in a tight range between $60k-$77k, and a future "Re-accumulation" period. The analyst projects that once accumulation ends, Bitcoin could break out to new all-time highs, with a potential target above $142,000 by early 2027. Holding above the $70,000 resistance level is critical for this bullish scenario to remain valid.

A crypto analyst has outlined a detailed market structure, suggesting that Bitcoin (BTC) may be entering a decisive stage after months of consolidation and price declines. His strategy maps recent price behavior into a sequence of institutionally driven phases, arguing that the end of accumulation often signals the start of a stronger upward expansion.

The Bitcoin MarketMaker Buy Strategy

Crypto market expert Merlijn The Trader has presented a market structure model on X, showing that Bitcoin’s recent price action is unfolding in line with an institutional trading cycle. The chart framework, known as the MarketMaker Buy Model, argues that large institutional players move markets in predictable stages designed to transfer Bitcoin from emotional retail traders into stronger, long-term holders before pushing prices significantly higher.

According to the analyst, the first stage of the cycle, highlighted in the first green box on the chart, began with a “Distribution” phase that occurred between about $100,000 and $120,000 in mid-2024. During this period, Bitcoin traded in a choppy downward pattern. This type of movement indicated that large holders were selling their Bitcoin amid strong demand from retail traders buying aggressively near the market top.

The second stage identified by Merlijn The Trader is the “Flush,” marked by the red box on the chart. This phase saw a sharp and aggressive price decline designed to force weaker traders out of the market. Here, Bitcoin reportedly fell from $100,000 to $62,000, a roughly 38% drop.
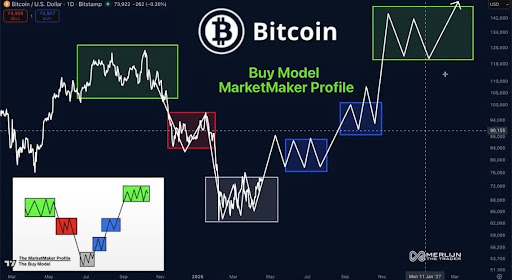
Source: Chart from Merlijn The Trader on X

Following this correction, the MarketMaker model transitions into the “Accumulation” phase, represented by the larger grey box on the chart. According to the model, this is the stage where the market is currently consolidating. Merlijn The Trader places this phase between roughly $60,000 and $77,000.

Within this zone, Bitcoin is trading in a relatively tight and choppy range rather than trending strongly in one direction. The sideways movement during this period also suggests that Bitcoin is building a foundation near a potential price bottom, as institutional buyers gradually accumulate more coins.

In the fourth stage, Merlijn The Trader identifies the two blue boxes on the chart as a “Re-accumulation.” This zone, between approximately $80,000 and $95,000, marks a secondary consolidation period that typically follows a price bottom. This phase provides another opportunity for large investors to strengthen their positions before BTC potentially begins its next upward movement.

What’s Next For BTC After Accumulation

Looking ahead, Merlijn The Trader projects a potential upside target above $142,000 once Bitcoin emerges from its accumulation and re-accumulation phases. In his chart model, the path to this level may involve another short consolidation period before a possible breakout into new all-time highs by January 2027.

The analyst also highlights a key resistance level around $70,000. Holding above this resistance is critical to maintaining the integrity of the MarketMaker model. Meanwhile, falling below the level suggests the structure may not be following the expected path.

BTC trading at $75,550 on the 1D chart | Source: BTCUSDT on Tradingview.com

Related Questions

QWhat is the name of the market structure model presented by the analyst Merlijn The Trader?

AThe MarketMaker Buy Model.

QAccording to the model, what is the purpose of the 'Flush' phase?

AThe 'Flush' phase is a sharp and aggressive price decline designed to force weaker traders out of the market.

QIn which price range is the current 'Accumulation' phase taking place, according to the analyst?

AThe 'Accumulation' phase is taking place between roughly $60,000 and $77,000.

QWhat is the potential upside price target for Bitcoin once it emerges from the accumulation phases?

AThe potential upside price target is above $142,000.

QWhat is the critical resistance level that Bitcoin must hold above to maintain the integrity of the MarketMaker model?

AThe critical resistance level is around $70,000.

Related Reads

MSX US Stock Daily Insight: Amazon 2026 Q2 Earnings: AWS Records Fastest Growth in Five Years

**MSX Daily US Stock Observation: Amazon's Q2 2026 Earnings: AWS Achieves Fastest Growth in Five Years** Amazon's latest quarterly results exceeded expectations, driven by a strong performance from its cloud computing unit. The company reported revenue of $200.66 billion, surpassing estimates of approximately $197 billion. The key highlight was Amazon Web Services (AWS), which generated $42.232 billion in revenue, surging 37% year-over-year. This marked the segment's fastest growth pace in 18 quarters, indicating robust demand for cloud services. Reported Earnings Per Share (EPS) of $5.75 significantly exceeded the $1.84 forecast. However, this figure included a substantial one-time, non-operating gain of $53.4 billion, primarily from the revaluation of Amazon's investment in AI company Anthropic. Excluding this item, core operating profit was $27.461 billion, a strong increase of 43% compared to the same period last year. Despite the positive results, Amazon provided guidance for the upcoming third quarter that fell short of market expectations. The company's revenue guidance midpoint is $199.5 billion, below the consensus estimate of around $204 billion. Operating profit guidance of $24.5 billion also slightly missed expectations of approximately $247.9 billion. Furthermore, Amazon raised its forecast for full-year capital expenditures to $220 billion, citing rising memory chip costs, which weighed on investor sentiment regarding future profitability. In summary, Amazon's quarter showcased accelerating momentum in its core AWS business. The underlying operational profit growth remains solid. However, cautious forward guidance and increased investment spending present key areas for monitoring in the coming quarters, as the market assesses whether the current growth phase will translate into sustained profit margin expansion.

Odaily星球日报5m ago

MSX US Stock Daily Insight: Amazon 2026 Q2 Earnings: AWS Records Fastest Growth in Five Years

Odaily星球日报5m ago

Cyclical Stock or Growth Stock? Coinbase's Q2 Earnings Report Reveals 'Valuation Disagreement'

Coinbase's Q2 2026 financial results revealed a mixed performance, reigniting debate over whether the company should be valued as a cyclical stock tied to crypto markets or a growth stock with future potential. Total revenue missed expectations at $1.22 billion, down 19% year-over-year. Transaction revenue fell to $599 million, with retail crypto spot trading revenue dropping 30% to $452 million, back to 2023 levels. The company reported a net loss of $359 million, marking its third consecutive quarterly loss. Despite CEO Brian Armstrong's positive commentary on metrics like a 10.3% overall crypto trading market share and 106% growth in prediction markets, the market reacted negatively, with shares dropping over 5% after-hours. A key issue is the decline in core retail trading. While Coinbase touted record market share, this figure includes derivatives and new products. Its traditional crypto spot trading share is likely shrinking. New ventures like prediction markets, while growing, contributed less than $30 million, insufficient to offset the core revenue decline. The valuation debate hinges on perspective. As a cyclical stock, Coinbase remains deeply tied to the crypto bear market, with user attrition and competitive pressures justifying a lower valuation. The company's strategy appears focused on surviving until the next bull cycle. Viewed as a growth stock, however, Coinbase shows promising diversification. Subscription and service revenue reached $555 million, nearly matching transaction revenue. Stablecoin revenue, its second-largest source at $292 million, remains strong through its partnership with Circle. Critically, Coinbase is positioning itself as a leader in the emerging on-chain "agent economy." Over 90% of agent-based stablecoin transactions occur on its Base network, which it believes could handle trillions in future agent transactions. The recent acquisition of Deribit also aims to boost its international derivatives offering. In summary, Coinbase's present struggles are clear, but its future hinges on whether its investments in revenue diversification, stablecoins, and the agent economy can ultimately transform its business model and justify a growth premium.

Odaily星球日报25m ago

Cyclical Stock or Growth Stock? Coinbase's Q2 Earnings Report Reveals 'Valuation Disagreement'

Odaily星球日报25m ago

Global Market Share Survey: Japanese Firms Lead in Semiconductor Materials

Global Market Share Survey: Japanese Firms Lead in Semiconductor Materials According to the 2025 "Major Goods and Services Market Share Survey" by Nikkei, Japanese companies maintain strong positions in semiconductor-related materials. In silicon wafers, Shin-Etsu Chemical ranks first with a 26.3% share, followed by SUMCO at 17.8%. Together, they hold 44.1% of the market, widening their lead over competitors from Taiwan, Germany, and South Korea. In photoresists, Tokyo Ohka Kogyo, JSR, and Shin-Etsu Chemical occupy the top three spots, with a combined share of 60.5%. Despite their strength in materials, Japanese firms have a weaker presence in core semiconductor segments like DRAM and NAND flash memory, where South Korean and U.S. companies dominate. For instance, SK Hynix and Samsung lead in DRAM, while China’s CXMT doubled its share to 6% in 2025. The semiconductor market is projected to grow rapidly, with WSTS forecasting a 90% increase to $1.5112 trillion by 2026. Major players like Samsung, SK Hynix, and Micron are making massive investments to expand capacity. To maintain their edge in materials, Japanese companies must similarly commit to large-scale, risk-taking investments. In contrast, Japan’s automotive sector shows stagnation. Toyota remains the global leader but with only a slight share increase to 12.3%, while Japanese brands are absent from the top five in the EV market. In shipbuilding, Imabari Shipbuilding rose to third place globally with a 7.2% share, benefiting from large container ship deliveries. However, Chinese and South Korean firms dominate the sector, holding the top two positions. Japan aims to revitalize its shipbuilding industry through government and corporate efforts, targeting a near doubling of output by 2035. Addressing labor shortages and adopting advanced technologies like physical AI will be critical for competitiveness.

marsbit50m ago

Global Market Share Survey: Japanese Firms Lead in Semiconductor Materials

marsbit50m ago

Trading

Spot
活动图片