Agentic Workflows for Crypto Research

insights.glassnodePublished on 2026-04-01Last updated on 2026-04-01

Abstract

AI coding agents are transforming crypto research by automating data analysis through natural language. This article demonstrates using an agent (like Claude Code) with the Glassnode CLI to test a hypothesis: whether extreme Bitcoin exchange inflows predict 7-day price drawdowns. The agent autonomously discovers metrics, fetches data, performs statistical analysis, and generates insights. Results show a moderate association—spike days saw ~1.9% greater drawdowns—though the sample is small. A follow-up prompt produces visualizations for validation. The workflow allows rapid iteration and is applicable to various research questions using Glassnode data, requiring only an API key and an AI agent.

AI coding agents are changing the way analysts and researchers interact with data. Instead of writing scripts line by line, you provide a hypothesis or research question to an AI agent and – it writes the code, fetches the data, runs the analysis, and returns results.

In this article we present a step-by-step real-world example: Asking an AI agent to download data via the Glassnode CLI, run a statistical analysis, and generate publication-ready charts, all from natural-language prompts.

What you will need

  1. Access to an AI agent

We use Claude Code in this walkthrough, but any agent able to execute Python and shell commands will work, including ChatGPT's Codex, Cursor, Github Copilot, Google Gemini CLI, OpenClaw, or similar tools.

  1. The Glassnode CLI (gn)

A command-line interface for the Glassnode API. Install it and configure your API key by following the Glassnode CLI docs. An API key is required.

The prompt

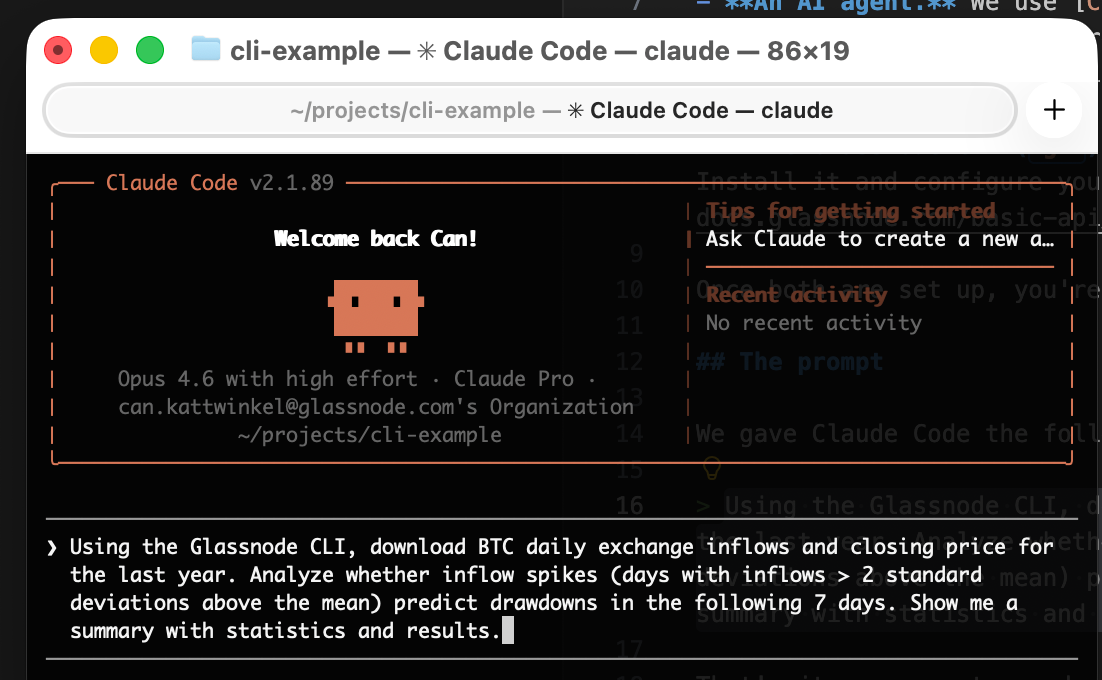
We will evaluate the following hypothesis: Extreme BTC exchange inflow events are predictive of 7-day forward drawdowns. To do that, we will instruct Claude Code using the following prompt:

Using the Glassnode CLI, download BTC daily exchange inflows and closing price for the last year. Analyze whether inflow spikes (days with inflows > 2 standard deviations above the mean) predict drawdowns in the following 7 days. Show me a summary with statistics and results.

That's it. One sentence describing the question, and another sentence defining the methodology. The agent takes it from there.

A simple prompt for the AI agent

What the agent does

Behind the scenes, the agent executes a sequence of steps:

  1. Discovers the right metrics by running gn metric list and gn metric describe to find the correct metric paths and valid parameters.
  2. Downloads the data via gn metric get, saving CSV files for both exchange inflows (transactions/transfers_volume_to_exchanges_sum) and closing price (market/price_usd_close).
  3. Writes and runs a Python analysis that computes the spike threshold, identifies spike days, calculates forward 7-day max drawdowns, and compares spike days to normal days.

The agent comes back with a readable summary:

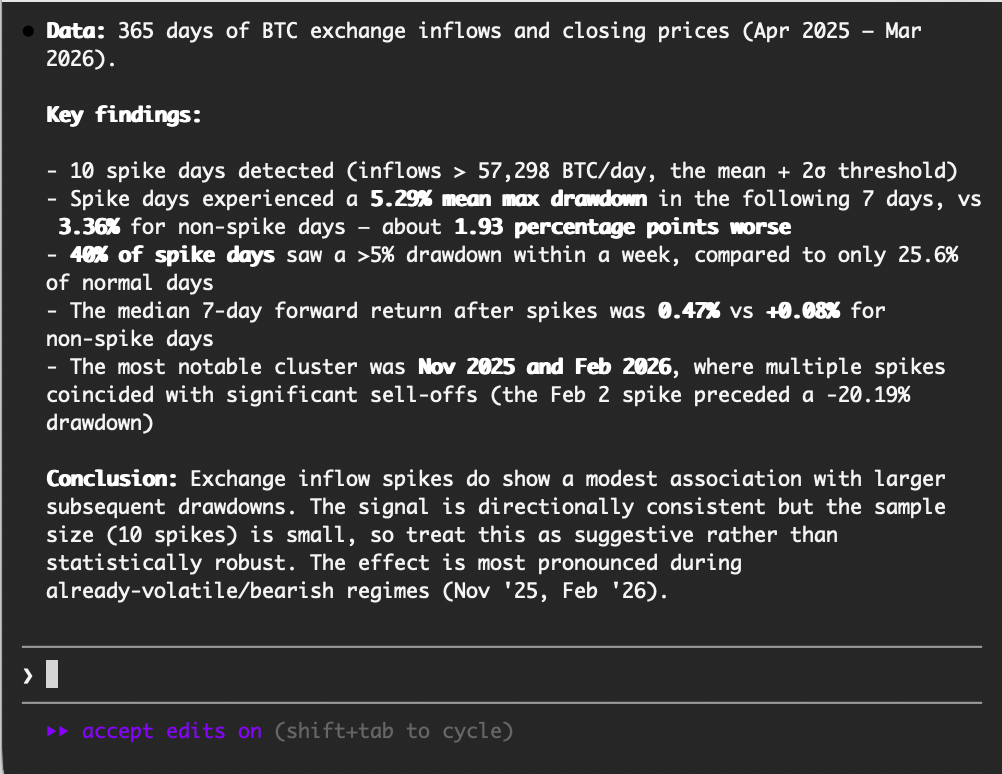
While this is just an illustrative example, our experiment does reveal a moderate association between exchange inflow spikes and subsequent drawdowns. Spike days see roughly 1.9 percentage points more drawdown on average. That said, with only 10 spike days in the sample and the effect concentrated in two volatile periods, the signal is suggestive rather than statistically robust. A rigorous backtest would need to account for overlapping windows, control for volatility regimes, use point-in-time data, and validate out-of-sample.

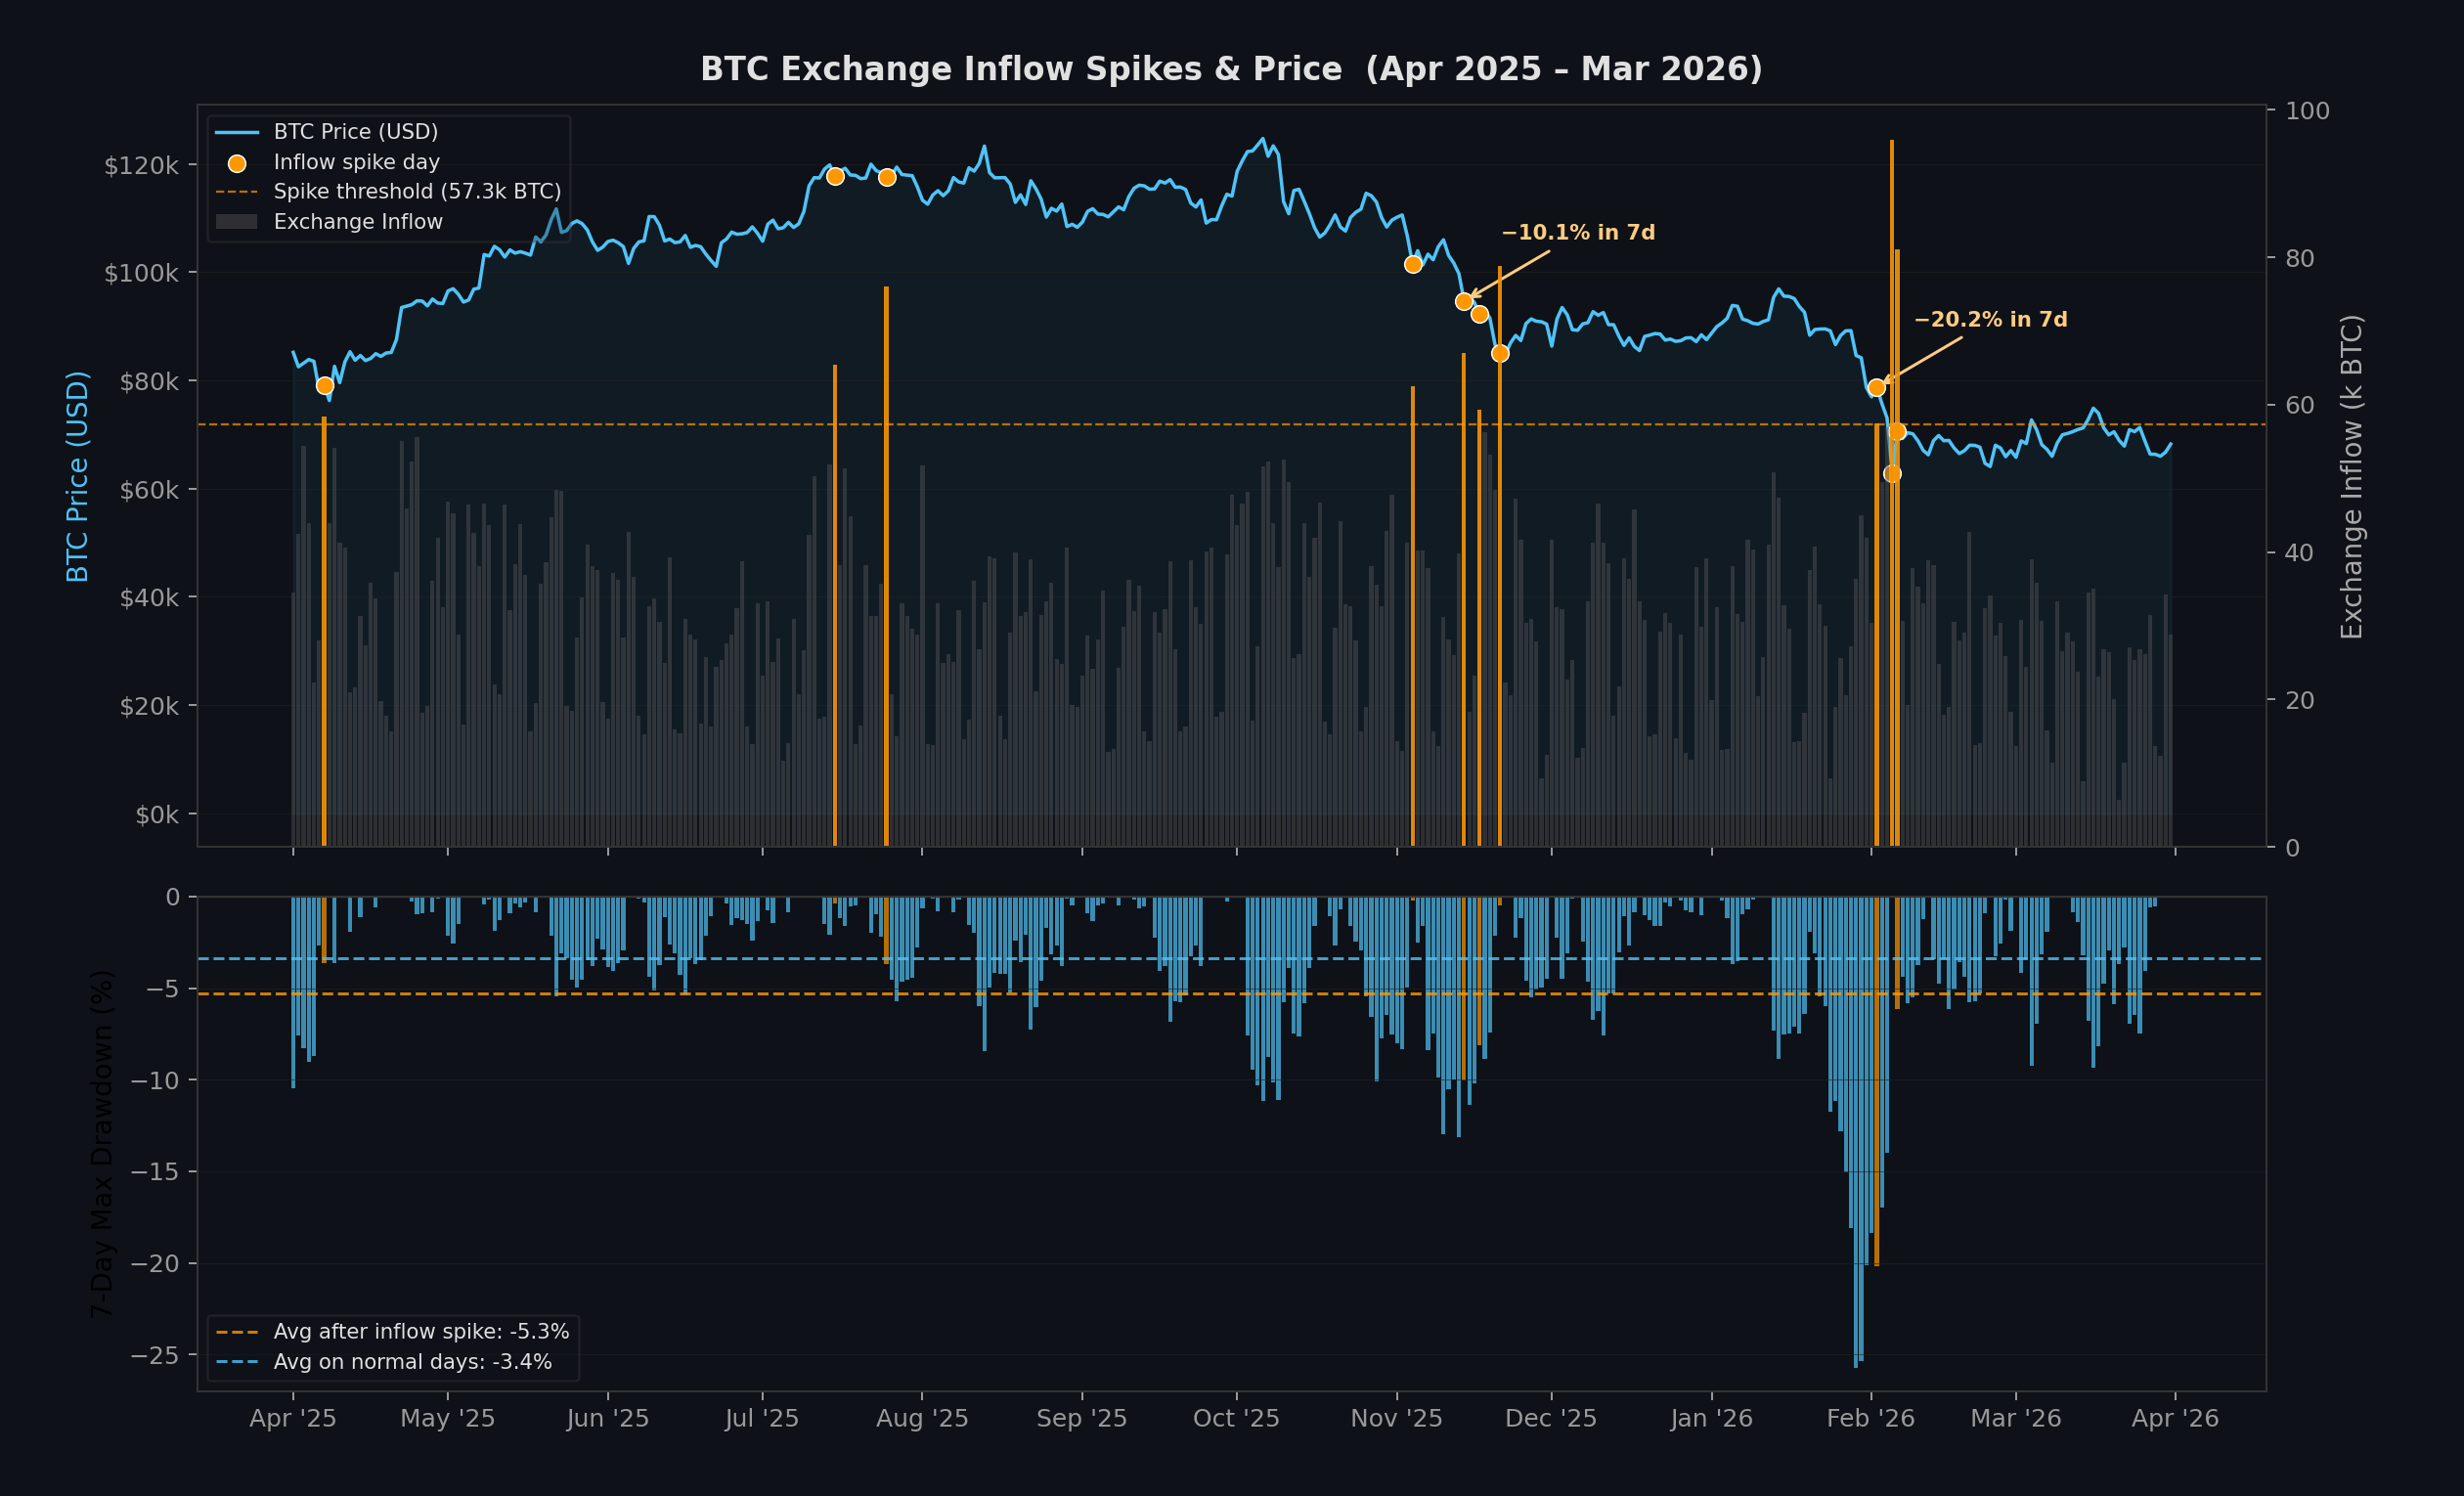
Visualizing the results

Visualizing the data is a good way to validate whether the numbers hold up. In this process, a simple follow-up prompt is enough:

Create a visualization that shows the data as a timeseries.

From here, you can keep iterating: adjust the chart, refine the analysis, or take the research in a different direction, all through natural language conversation.

The AI-generated visualisation of Glassnode data

Get started with AI Crypto Research on Glassnode Data

The Glassnode CLI requires an API key, available to Glassnode Professional subscribers.

  1. Install the Glassnode CLI and configure your API key. See documentation
  2. Open your preferred AI coding agent (Claude Code, Codex, Cursor, Gemini CLI, OpenClaw, etc.)
  3. Start prompting. Try questions such as:
    • "Download ETH staking deposits for the last 6 months and plot the trend"
    • "Compare BTC and ETH exchange netflows over the last 90 days"
    • "Find which metric has the highest correlation with BTC 30-day returns"

The Glassnode CLI allows agents to discover and retrieve metric data without requiring manual API lookup or writing boilerplate code. Combined with an AI coding agent, the Glassnode CLI turns a research question into results in minutes.

Related Questions

QWhat is the main advantage of using AI coding agents for crypto research as described in the article?

AThe main advantage is that AI coding agents automate the entire research workflow, allowing analysts to provide a natural-language hypothesis or research question, and the agent handles writing the code, fetching data, running analysis, and returning results, significantly speeding up the process.

QWhich specific AI agent is used in the walkthrough example for analyzing BTC exchange inflows?

AThe walkthrough uses Claude Code, but it notes that any AI agent capable of executing Python and shell commands, such as ChatGPT's Codex, Cursor, GitHub Copilot, Google Gemini CLI, or OpenClaw, would work.

QWhat hypothesis is tested in the example prompt given to the AI agent?

AThe hypothesis tested is: 'Extreme BTC exchange inflow events (days with inflows > 2 standard deviations above the mean) are predictive of 7-day forward drawdowns.'

QWhat are the key steps the AI agent performs behind the scenes after receiving the prompt?

AThe agent discovers the right metrics using Glassnode CLI commands, downloads the data (exchange inflows and closing price), writes and runs a Python analysis to compute spike thresholds and drawdowns, and returns a statistical comparison and summary.

QWhat is required to use the Glassnode CLI for AI-assisted research as mentioned in the article?

ATo use the Glassnode CLI, you need an API key, which is available to Glassnode Professional subscribers, and you must install and configure the CLI tool following the documentation.

Related Reads

A Hair Dryer Blows Away $34,000 from Polymarket

A hairdryer was used to manipulate a temperature sensor at Paris Charles de Gaulle Airport (LFPG) on April 6 and 15, 2026, causing short-lived artificial temperature spikes. These false readings were used to exploit a prediction market on Polymarket, where users bet on Paris’s daily maximum temperature. The attacker targeted low-probability high-temperature outcomes, which settled as "Yes" based on the corrupted data, netting a total of $34,000 in profit. The attacker’s a newly created anonymous account funded just two days before the first incident. After the successful manipulations, the funds were quickly moved through mixers and decentralized exchanges to avoid tracing. French meteorological experts and authorities confirmed the anomalies were inconsistent with actual weather conditions and nearby station data, pointing to physical intervention. Legal action was initiated for "disrupting automated data processing systems," which carries severe penalties under French law. Polymarket’s market rules relied solely on a single, publicly accessible sensor and did not account for subsequent data revisions, making the system vulnerable to such physical oracle attacks. In response, Polymarket silently switched its data source to Paris-Le Bourget Airport (LFPB) without public explanation or refunding the exploited funds. The incident highlights the risks of single-point data dependencies in prediction markets and the low-cost, high-reward potential of real-world manipulation.

marsbit16m ago

A Hair Dryer Blows Away $34,000 from Polymarket

marsbit16m ago

In-Depth Report on the On-Chain Lending Market: When Off-Chain Credit Meets On-Chain Liquidation

The on-chain lending market has evolved from a peripheral DeFi niche into core financial infrastructure. As of early 2026, total value locked (TVL) in on-chain lending protocols has reached $64.3 billion, accounting for 53.54% of total DeFi TVL, making it the largest and most mature vertical within decentralized finance. Aave dominates the sector with approximately $32.9 billion in TVL, commanding nearly half of the market—a leadership position that is unlikely to be challenged in the foreseeable future. However, the path of on-chain lending forward is not without risk. Liquidation cascades, credit defaults, and cross-chain vulnerabilities remain systemic threats hanging over the industry. At the same time, a deeper structural transformation is underway: on-chain lending is shifting from a “leverage tool for crypto-native users” to a “compliant gateway for institutional capital”. The scale of RWA (Real World Asset) lending has surpassed $18.5 billion, with U.S. Treasuries and government securities increasingly serving as core collateral. Institutional capital inflows are reshaping both the user base and risk appetite of the sector. This report systematically analyzes the evolution of on-chain lending definitions, competitive dynamics, core risks, and future trends, providing a comprehensive industry outlook for investors and trade practitioners. Key findings suggest that the “one dominant player with several strong challengers” structure will persist in the short term, while fixed-rate lending, compliant collateral, and institutional credit underwriting will define the next phase of competition. For investors focused on DeFi infrastructure, three key opportunity tracks stand out, namely, the Aave ecosystem (Morpho, Spark), RWA lending protocols (Ondo, Maple) and fixed-rate innovation (Notional, Pendle).

HTX Learn1h ago

In-Depth Report on the On-Chain Lending Market: When Off-Chain Credit Meets On-Chain Liquidation

HTX Learn1h ago

Trading

Spot
Futures
活动图片