Aave launches Stable Vaults—but can AAVE extend its rally?

ambcryptoPublished on 2026-07-11Last updated on 2026-07-11

Abstract

DeFi protocol Aave introduced Stable Vaults, allowing fintechs and payment providers to embed fixed-rate stablecoin yields. The announcement, alongside record deposit numbers from the Aave V4 upgrade, boosted the AAVE token, with its price and trading volume rising. Technical analysis, however, suggests caution. While a short-term rally towards the $100-$106 resistance zone is possible, the higher-timeframe trend remains bearish. A move above the key $118.87 level would signal a bullish shift; until then, the current upward momentum might be a trap for buyers.

In a blog post on Thursday, July 9, DeFi giant Aave [AAVE] introduced Stable Vaults. This infrastructure allows fintechs, wallets, exchanges, and payment providers to embed fixed-rate stablecoin yield into their products.

Possible use cases include neobank embedded savings powered by Aave market, and a payments company letting merchants earn on idle settlement balances, among others, according to the announcement.

The Aave V4 upgrade also drew record deposit numbers, AMBCrypto reported. This has given the AAVE token a positive jolt. The daily trading volume of the token was up 14.5%, and the price was up by just under 3.5% in the past 24 hours.

Here’s why this momentum might be able to push prices another 12% higher.

Should investors buy the Aave move beyond $100?

In short, buyers might be on the wrong side in this battle. Here’s why.
Source: AAVE/USDT on TradingView

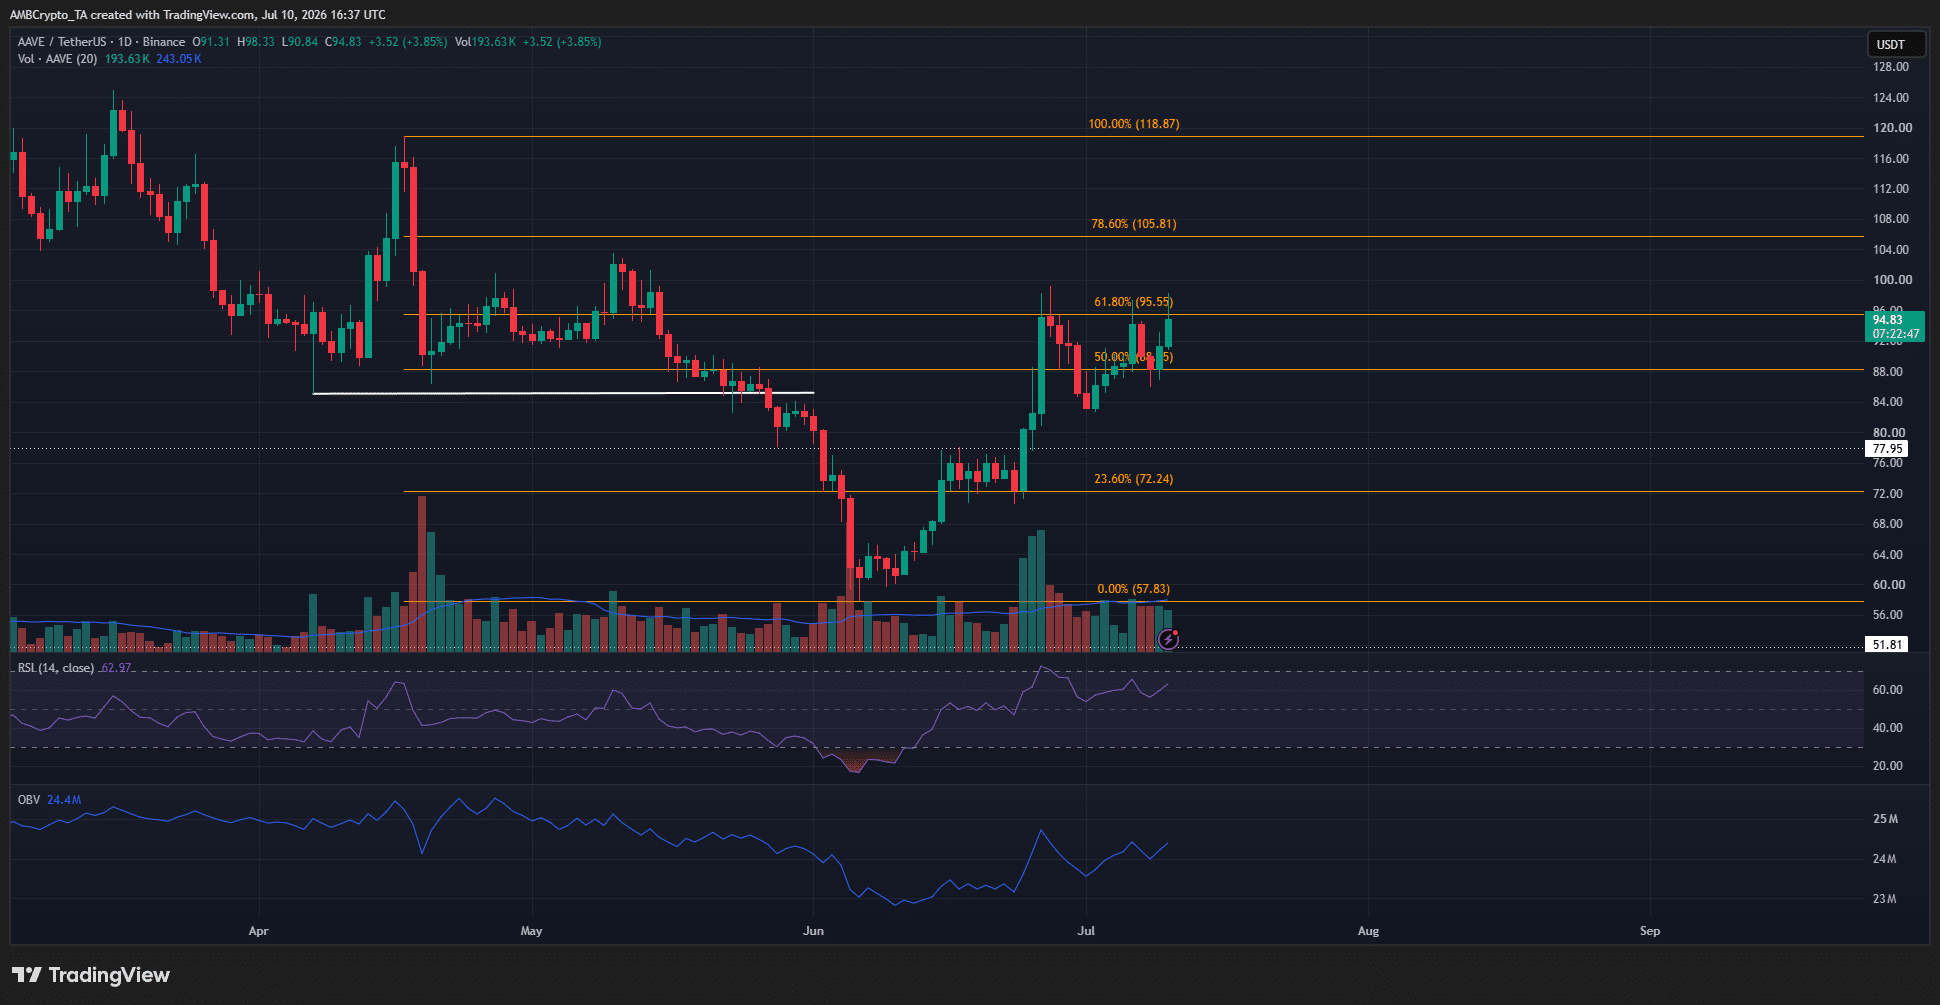
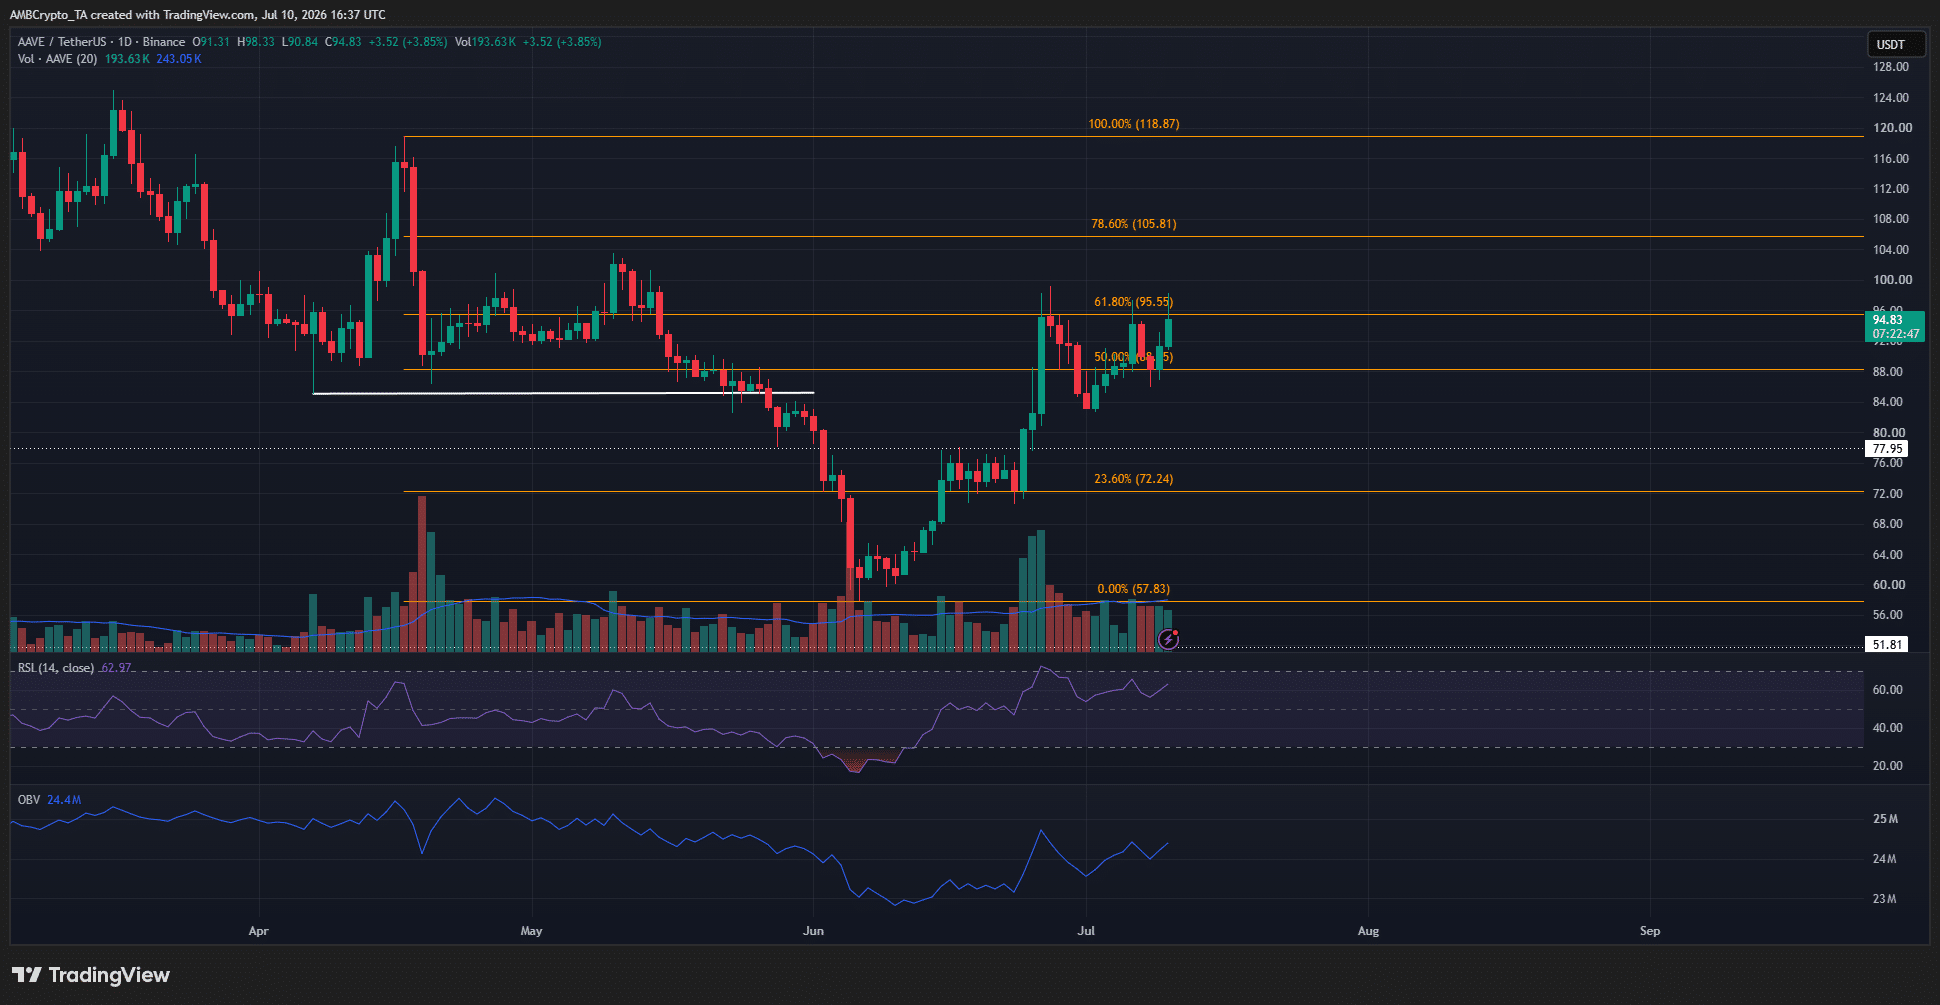
The 1-day chart showed a bearish swing structure in place. A bearish continuation was established in May, when Aave prices slid below the swing low at $85.05 to reach a new low of $57.83.

This downward impulse move was used to plot a set of Fibonacci retracement levels [orange]. At the time of writing, AAVE bulls were battling against the 61.8% retracement level at $95.55.

This resistance was also just below the $100 round-number resistance. On one hand, it appeared that a breach of this level would be bullish confirmation.

Traders’ call to action- Watch out for a trap

Such a rally could prove to be a bullish trap if AAVE fails to reclaim the higher-timeframe resistance levels. The trend on the higher timeframes, such as daily and weekly, were firmly bearish. A continued move up to $105.81, the 78.6% retracement level, is possible.

This is the trap traders and investors should watch out for. Short-term holders might want to use this bounce to exit at a profit.

If the rally continues and breaks the $118.87 swing high, a bullish structural shift would have occurred. Until then, caution would be the safer approach.


Final Summary

  • Aave’s Stable Vaults launch adds another fundamental catalyst to the protocol’s growing ecosystem, helping lift short-term sentiment around AAVE.
  • However, the higher-timeframe trend remains bearish, meaning any rally toward $100–$106 could face heavy selling unless buyers reclaim $118.87.


Related Questions

QWhat new product did Aave launch on July 9th, and what is its purpose?

AAave launched Stable Vaults. Its purpose is to allow fintechs, wallets, exchanges, and payment providers to embed fixed-rate stablecoin yield into their products.

QAccording to the article, what was the immediate impact of the Aave V4 upgrade and the new launch on the AAVE token?

AThe Aave V4 upgrade drew record deposit numbers. This gave the AAVE token a positive jolt, with its daily trading volume up 14.5% and its price up by just under 3.5% in the past 24 hours.

QWhat key resistance level are AAVE bulls battling against according to the 1-day chart analysis?

AAccording to the 1-day chart, AAVE bulls are battling against the 61.8% Fibonacci retracement level at $95.55, which is also just below the $100 round-number resistance.

QWhy does the article warn that a rally towards $100-$106 could be a 'bullish trap'?

AThe article warns it could be a bullish trap because the higher-timeframe (daily and weekly) trends are still firmly bearish. A rally without reclaiming the key higher-timeframe resistance level of $118.87 could lead to heavy selling.

QAccording to the final summary, what condition must be met for a bullish structural shift to occur for AAVE?

AAccording to the final summary, for a bullish structural shift to occur, the rally must continue and break the $118.87 swing high.

Related Reads

Why Bitcoin Holds Above $64,000 After Fed's Hard Pause

**Bitcoin Stabilizes Near $64,000 Following Hawkish Fed Pause** The cryptocurrency market, led by Bitcoin, remained stable around $64,000 despite a volatile reaction to the latest U.S. Federal Reserve meeting. The Fed paused interest rates but signaled a hawkish stance, with three committee members voting for an increase—the highest dissent since 2016. This limits risk appetite but hasn't triggered panic selling. Key market highlights include Bitcoin ETFs seeing a net inflow of $32.1 million, breaking a streak of outflows, while Ethereum ETFs experienced outflows of $18.65 million. Liquidations affected about 90,000 traders. Technically, Bitcoin finds support around $63,000-$63,500, with major resistance near $66,000. While its price is about 49% below its all-time high, institutional demand via ETFs and the absence of mass capitulation support a potential recovery scenario in the second half of the year. Major altcoins showed mixed movements, with Solana attracting capital while Ethereum faced selling pressure despite strong on-chain metrics like a growing staking queue. Regulatory news took a pause as the U.S. Senate delayed the CLARITY Act vote until at least autumn. For the final trading day of July, U.S. inflation and consumer spending data will be crucial. Bitcoin's key levels to watch are $63,000 support and $66,000 resistance. Sustained ETF inflows and Bitcoin holding above $63,000 are seen as positive signs for a potential market recovery later in the year.

cryptonews.ru1h ago

Why Bitcoin Holds Above $64,000 After Fed's Hard Pause

cryptonews.ru1h ago

Trading

Spot
活动图片