A Bullish Pennant Just Appeared On The Dogecoin Monthly Chart, Here’s What To Expect

bitcoinistPublished on 2026-03-10Last updated on 2026-03-10

Abstract

A massive bullish pennant pattern is forming on the Dogecoin (DOGE/USD) monthly chart, a development that began after the cryptocurrency's historic rally in 2021. The pattern started with a sharp "flagpole" surge that took DOGE from under $0.01 to its all-time high of $0.73. Since that peak, the price has been compressing between two converging trendlines, creating a symmetrical triangle with a series of lower highs and higher lows. The price is currently testing a critical juncture, trading near the lower, rising support trendline around $0.09. Holding this support is crucial for the pattern's validity; a monthly close below it would weaken the bullish outlook. For the pattern to confirm and trigger a significant breakout, DOGE must first push above the upper, descending trendline, which requires closing consecutive months above the $0.32 level. If a breakout occurs, the measured move target—calculated from the height of the 2021 flagpole—projects a substantial upward move. Conservative estimates suggest a target well above $1, with more optimistic projections reaching the $3 to $4 range.

Most traders are watching Dogecoin on the daily or weekly chart, reacting to intraday price action. However, the monthly candlestick chart tells a different story, one that has been developing since the 2021 cycle and is now approaching an inflection point.

Technical analysis shows a massive bullish pennant is forming on the DOGE/USD monthly timeframe. Dogecoin is now at a lower high support in the pennant, and the technical implications are significant.

Giant Pennant Has Been Forming Since The 2021 Rally

The monthly chart shows Dogecoin’s price compressing between two converging trendlines, forming what appears to be a large bullish pennant. The structure begins with the flagpole: the near-vertical surge that launched Dogecoin from below $0.01 to its all-time high of $0.73 in May 2021.

Since that peak, DOGE’s price action has been forming a symmetrical triangle on the monthly chart, a series of lower highs and higher lows converging steadily toward an apex. The upper boundary slopes downward from the peak reached during the 2021 surge, creating a descending resistance line that has rejected several major rallies since then.
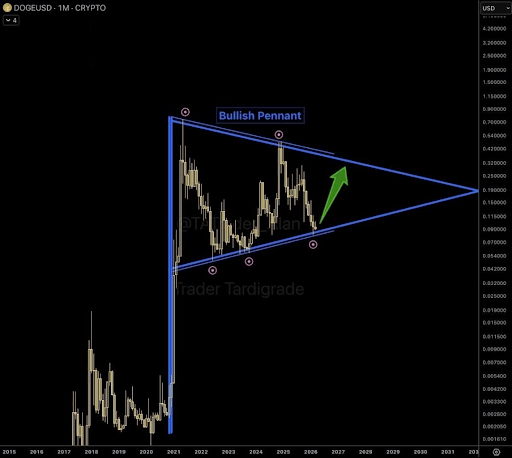
Source: Chart from TheMoonHailey on X

The lower boundary, on the other hand, rises gradually from the base that formed once the previous rally cooled to create a higher low. The lower trendline has provided consistent support, and critically, it held last month when the price tested the $0.08 zone.

As shown in the Dogecoin monthly candlestick chart below, these two lines have created a triangular formation that has continued to narrow since 2021. Multiple turning points on the chart show price reacting precisely at these boundaries, and the structure has been respected repeatedly over time.

Here’s What To Expect From The Bullish Pennant

One of the most important details in the chart is the most recent interaction with the lower trendline. Dogecoin dipped to the rising support boundary in February and bounced. That rebound occurred around the same area where Dogecoin has been trading recently, just below the $0.09 level.

At the time of writing, Dogecoin is trading at $0.094, still close to the support. Holding this support and closing above it in March is important for the structure because a bullish pennant depends on price remaining inside the converging boundaries. If DOGE were to close the month below the lower trendline, then the bullish outlook would weaken.

On the other hand, the bullish outlook depends on Dogecoin breaking above the upper end of the bullish pennant. The measured move target of a bullish pennant is calculated from the height of the flagpole, projected from the breakout point. Given the scale of Dogecoin’s 2021 flagpole, even conservative projections point well above $1, with upper-range targets in the $3 to $4 territory.

However, there is still much work to do for DOGE to return to the upper trendline before a breakout. Particularly, Dogecoin needs to push above $0.32 and close consecutive months above this level.

DOGE trading at $0.09 on the 1D chart | Source: DOGEUSDT on Tradingview.com

Related Questions

QWhat pattern is forming on the Dogecoin monthly chart according to the article?

AA massive bullish pennant is forming on the DOGE/USD monthly timeframe.

QWhat was the starting point (flagpole) of this bullish pennant pattern?

AThe flagpole was the near-vertical surge that launched Dogecoin from below $0.01 to its all-time high of $0.73 in May 2021.

QWhat is the critical support level that Dogecoin recently tested and held?

ADogecoin recently tested and held the support at the lower trendline around the $0.08 zone in February.

QWhat is the significance of Dogecoin closing a month above the $0.32 level?

AClosing consecutive months above the $0.32 level is necessary for Dogecoin to push towards the upper trendline and attempt a breakout from the pennant.

QWhat is the potential price target if the bullish pennant pattern completes with a successful breakout?

AThe measured move target, based on the height of the 2021 flagpole, points well above $1, with upper-range targets in the $3 to $4 territory.

Related Reads

Bitcoin Withdrawals Continue: 8 Years of Storage in a Coldcard Cold Wallet Ended in Zero

Coldcard Hardware Wallet Hacked: Losses Mount Due to Vulnerable Seed Generation A critical vulnerability in Coldcard hardware wallets has led to a continued wave of fund thefts. According to Galaxy Research, the total stolen has reached 1,367.05 BTC (approx. $88.6 million) from 4,585 addresses, a significant increase from the initial 594.5 BTC reported on July 30, 2026. Most of the stolen funds remain on the attackers' addresses. The issue is not with the current firmware, which Coinkite has updated, but with seed phrases generated on vulnerable devices between March 2021 and the release of fixed firmware versions. Due to a programmer error, devices switched from using a hardware random number generator to the software-based Yasmarang generator, which was initialized with publicly accessible data like the chip's serial number. This made the seed phrases predictable through offline brute-force attacks, meaning wallets remain at risk until funds are moved to a new wallet generated with the patched firmware. Affected devices include Mk2/Mk3 with firmware 4.0.1–4.1.9 (and up to 5.0.3), Mk4/Mk5 up to version 5.6.0, and Q models up to 1.5.0Q. The only exceptions are seeds created with a high-entropy method like at least 50 independent dice rolls or a strong unique BIP-39 passphrase. All other owners must generate a new seed on the fixed firmware and transfer their assets. A case highlighting the human impact involves a 39-year-old long-term investor who lost 2 BTC (approx. $130,000) in minutes. He had accumulated the Bitcoin over eight years through physical labor, viewing it as a financial lifeline and a retirement plan in a country suffering from hyperinflation. His story underscores that even conservative "buy and hold in cold storage" strategies can be compromised by such underlying technical flaws. From a technical perspective, this incident echoes historical failures where weak random number generators undermined cryptographic security, challenging the assumption that offline storage is automatically foolproof.

cryptonews.ru5h ago

Bitcoin Withdrawals Continue: 8 Years of Storage in a Coldcard Cold Wallet Ended in Zero

cryptonews.ru5h ago

Trading

Spot
活动图片