Stablecoin supply nears $318B: Fresh inflows or just capital rotation?

ambcryptoPublished on 2026-03-20Last updated on 2026-03-20

Abstract

Stablecoin supply is approaching $318 billion, signaling a period of controlled expansion. While fresh capital is entering through fiat on-ramps, a significant portion of this growth reflects internal capital rotation into yield-bearing and regulated assets rather than entirely new inflows. Tether (USDT) continues to dominate the market, though its growth has slowed, while others like USDC and USDS are expanding more rapidly. This liquidity is increasingly being actively deployed, evidenced by rising DEX volumes and exchange inflows. However, the market remains split between genuine capital inflows and internal redistribution, with a large share of stablecoins still held on exchanges.

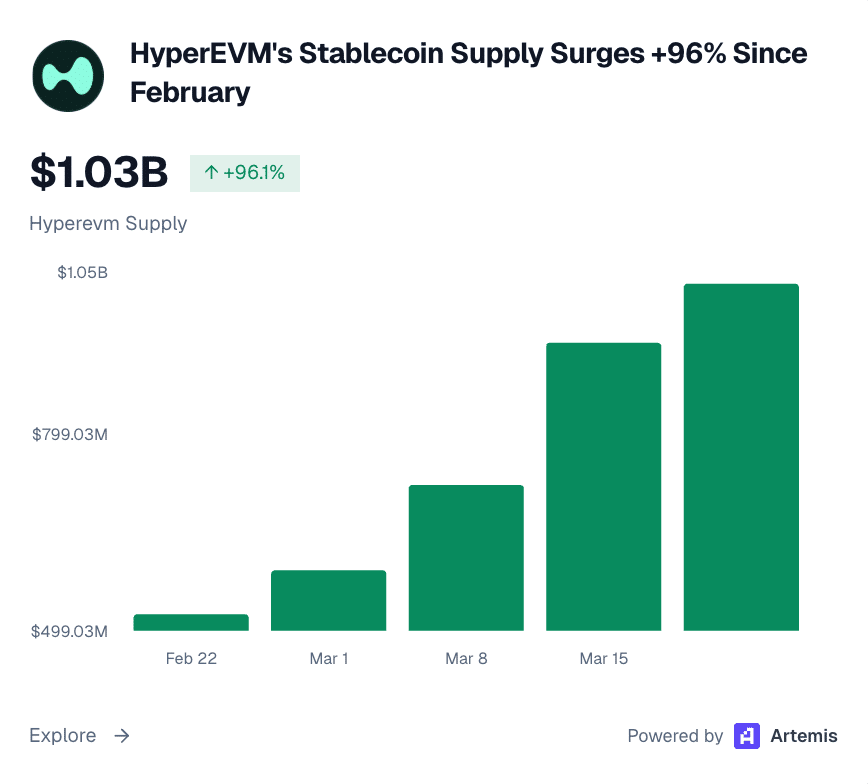
HyperEVM is emerging as a strong liquidity hub, with stablecoin supply and TVL both surpassing $1 billion soon after launch. At the same time, Hyperliquid [HYPE] L1 holds over $5 billion in stablecoins, which reinforces broader ecosystem momentum.

However, bridges such as HyperCore receive the majority of inflows, which transfer USDHL, USDe, and feUSD across chains, indicating a reallocation of liquidity rather than its creation.

Source: Artemis/ X

USDhl minting adds treasury-backed supply while supporting demand through HYPE-linked incentives, which sustains short-term activity. As these flows continue, unique active wallets steadily increase, reflecting growing participation.

Simultaneously, platforms like Hyperlend, DEXs, and perpetual venues absorb this capital and drive usage. Still, this growth leans on incentives and yield opportunities, which may fade. For now, HyperEVM shows traction, although lasting expansion depends on steady organic demand.

Stablecoin supply near $318B reflects growth

Stablecoin supply is approaching $318 billion, rising 0.47% weekly and 2.86% monthly, which reflects controlled expansion rather than aggressive inflows. Building on this trend, Tether [USDT] still dominates at $184 billion, although its 0.10% weekly growth shows slowing momentum.

Meanwhile, USDC at $79.24 billion expands faster with 7.75% monthly gains, while USDS and USYC surge by 20.87% and 40.59%, highlighting shifting demand. As these changes unfold, minting continues to exceed burns, suggesting fresh capital entering through fiat on-ramps.

Source: DeFiLlama

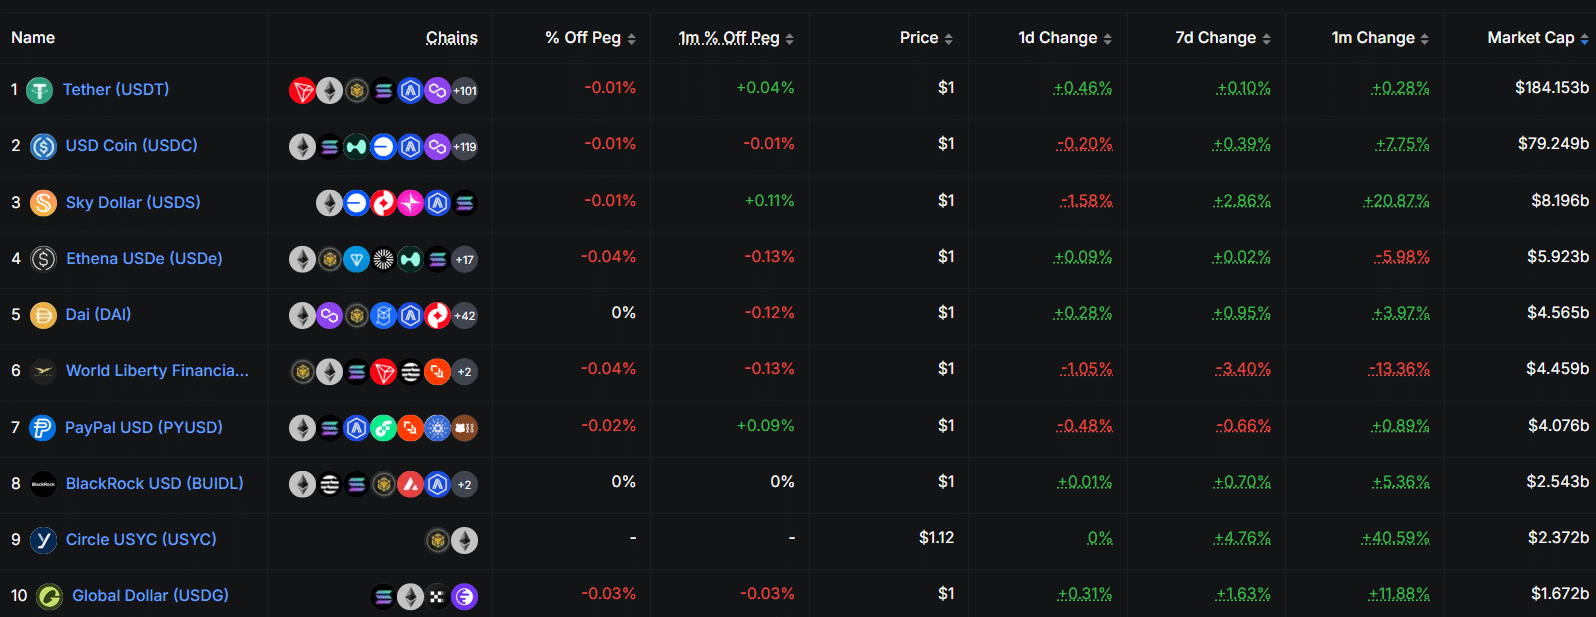
However, part of this rise also reflects capital rotating into yield-bearing and regulated assets. In parallel, the stablecoin ratio holds near 9–10% of the $2.5 trillion crypto market cap, showing relative balance.

This steady structure suggests liquidity is gradually expanding, yet not accelerating sharply, leaving the market split between real inflows and internal redistribution.

Stablecoins move from storage to utilization across crypto markets

Stablecoin growth is increasingly translating into active deployment, as DEX volume reaches $7.65 billion and rises 8.91% weekly. Building on this, Uniswap [UNI] processes $1.289 billion, while PancakeSwap [CAKE] sustains steady stablecoin-pair activity, reinforcing spot demand.

Perpetual Open Interest holds near $48–51 billion, showing sustained positioning without sharp liquidations. As flows deepen, stablecoin netflows turn positive, with ERC-20 inflows around $484 million moving toward exchanges.

This shift aligns with holdings data, where exchanges control $70.4 billion, or 45%, anchoring liquidity concentration. From here, consumer balances reach $65.3 billion, or 41%, reflecting growing retail usage.

Source: Allium/ X

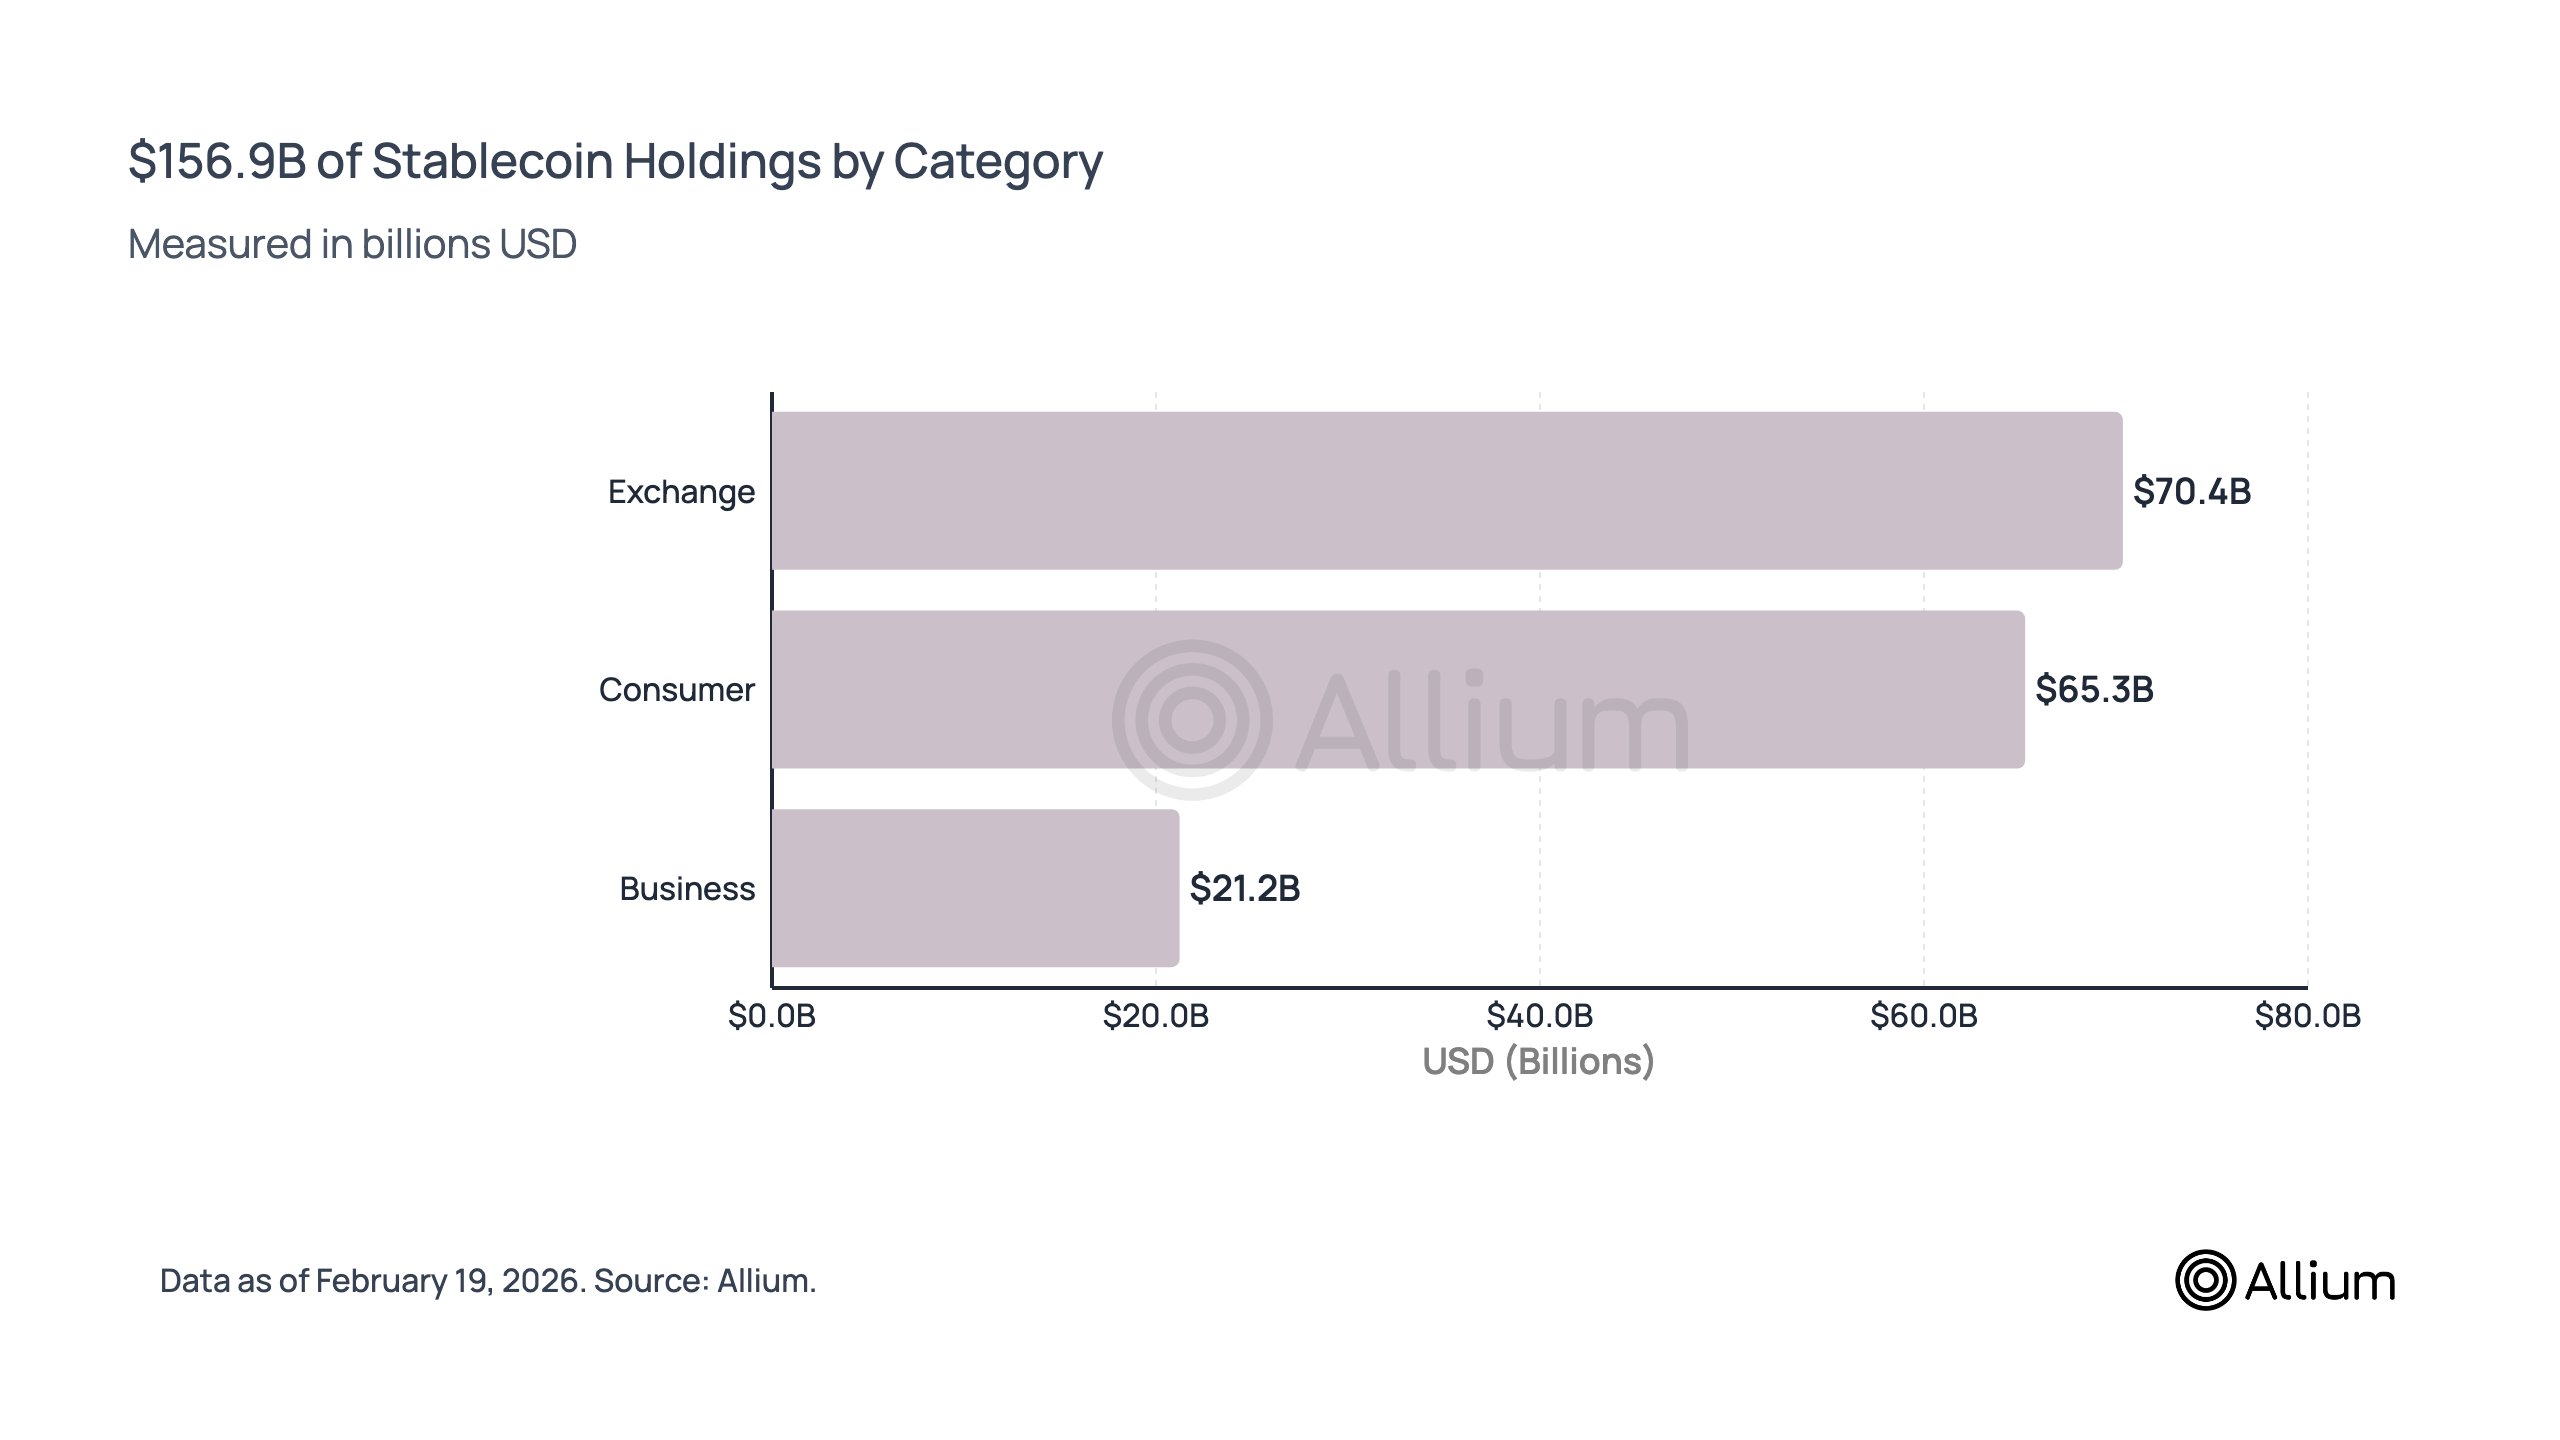
Business holdings at $21.2 billion support payment flows tied to $374.5 billion in volume. As distribution broadens, capital appears actively deployed, although exchange dominance suggests part of liquidity remains positioned rather than fully utilized.


Final Summary

  • Hyperliquid ecosystem growth reflects rising liquidity and user activity, yet heavy reliance on bridged inflows and incentives questions sustainability.
  • Stablecoins, led by Tether [USDT], show gradual expansion and active deployment, although a portion of liquidity still rotates internally across exchanges and DeFi.

Related Questions

QWhat is the total stablecoin supply approaching according to the article, and what does this growth reflect?

AThe total stablecoin supply is approaching $318 billion, reflecting controlled expansion rather than aggressive inflows, with a 0.47% weekly and 2.86% monthly increase.

QWhich stablecoin dominates the market in terms of supply, and what is its current growth trend?

ATether [USDT] dominates the market with a supply of $184 billion, but its weekly increase of only 0.10% shows a deceleration in its growth momentum.

QWhat does the majority of inflows into bridges like HyperCore indicate about the nature of the liquidity?

AThe majority of inflows into bridges like HyperCore, which transfer assets such as USDHL, USDe, and feUSD across chains, indicate a reallocation or rotation of existing liquidity rather than the creation of new capital.

QHow is the growing stablecoin supply being actively utilized in the crypto markets?

AThe growing stablecoin supply is being actively utilized, as evidenced by a DEX volume of $7.65 billion (an 8.91% weekly rise) and Perpetual Open Interest holding near $48-51 billion, showing capital is moving from storage to active deployment in trading and yield opportunities.

QWhat is a key factor questioning the sustainability of the HyperEVM ecosystem's current growth?

AA key factor questioning the sustainability of HyperEVM's growth is its heavy reliance on bridged inflows and incentive programs, as lasting expansion depends on steady organic demand rather than these potentially temporary drivers.

Related Reads

From Theory to Countdown: Google Sounds the Blockchain Quantum Resistance Alarm with Zero-Knowledge Proofs

An article discusses the significant threat quantum computing poses to blockchain and classical encryption systems, triggered by Google's recent research. By optimizing Shor's algorithm, Google reduced the logical qubits required to break 256-bit elliptic curve encryption from around 6,000 to just 1,200—slashing computational costs by 20 times. This advancement sets a potential countdown, with Google estimating 2029 as the deadline for upgrading to quantum-resistant cryptography. Both Bitcoin and Ethereum face severe risks. About 25-35% of Bitcoin addresses have exposed public keys, making them vulnerable to attacks, especially during transaction processing. Ethereum’s design exposes public keys upon first use, jeopardizing its entire network if signatures aren’t updated. Historical blockchain data remains permanently available for future quantum attacks. The solution lies in adopting post-quantum cryptography (PQC). Ethereum is already implementing account abstraction and PQC-based signatures, leveraging its upgradeable architecture. Bitcoin is considering BIP-360 to introduce quantum-resistant algorithms like FALCON or CRYSTALS-Dilithium, though consensus may delay action. Notably, Google used zero-knowledge proofs to disclose this threat responsibly, aiming to prevent panic. Collaboration with Ethereum Foundation researchers suggests抗量子 (quantum resistance) could become a major narrative, aligning with crypto’s cryptographic roots.

marsbit18m ago

From Theory to Countdown: Google Sounds the Blockchain Quantum Resistance Alarm with Zero-Knowledge Proofs

marsbit18m ago

How is the 'Bottom Structure' of a Bear Market Formed, and Where Are We Now?

This article analyzes the formation of Bitcoin's bear market "bottom structure" by examining the relationship between cost basis and price action, particularly the behavior of short-term holders (STH). Historically, the cost basis of coins held for 1-3 months (1-3m_RP) has acted as a key resistance level during bear market rallies. This group's supply is often less committed; many entered the market expecting quick gains but were trapped. When the price rebounds to their break-even point, they tend to sell, creating resistance. Data shows that as of mid-April, the 1-3m_RP is approximately $75,400, a level Bitcoin is currently testing for the second time this cycle. The first test in mid-January failed, leading to a pullback. The author suggests a high probability of a similar outcome this time, as historical cycles show the second test rarely results in an immediate reversal. An alternative, less likely scenario is a break above this level, only to face stronger resistance at the broader STH-RP (average cost basis for all short-term holders) near $81,000, where a much larger supply of 2.31 million BTC resides. This could lead to price consolidation around the 1-3m_RP. A definitive bottom structure is confirmed only when the 1-3m_RP trend reverses from down to up, signaling a transition from a bear to a bull market. This process takes time, requiring patience to observe whether breakouts are genuine.

marsbit1h ago

How is the 'Bottom Structure' of a Bear Market Formed, and Where Are We Now?

marsbit1h ago

Trading

Spot
Futures
活动图片