Original Author / Castle Labs
Compiled / Odaily Planet Daily Golem(@web 3_golem)

Editor's Note: This article systematically studies the differences in crude oil contract trading data between Hyperliquid and CME during weekdays and weekends, drawing some important conclusions. Currently, Hyperliquid indeed cannot match CME in absolute metrics like liquidity depth or slippage, with overall liquidity being less than 1%. This is related to the fact that the main users of RWA trading platforms are still crypto-native retail investors.
The difference with Hyperliquid is that the trading volume of crude oil contracts on Hyperliquid significantly increases during weekend periods.This indicates that besides retail investors with speculative needs, traders who want exposure to crude oil trades or engage in hedging operations before Monday are also trading on Hyperliquid. And this trend is becoming increasingly obvious, giving Hyperliquid price discovery capabilities for commodities.
However, for institutional investors, the high transaction costs on the Hyperliquid platform remain a major obstacle to its expansion in the commodity trading space compared to CME. If Hyperliquid does not promptly improve its ability to handle institutional-grade orders, it can only be a temporary weekend trading venue for traditional traders, ultimately becoming a minor supplement to the traditional financial landscape.
Research Methodology and Data Sources
This analysis evaluates the microstructure of the crude oil market through two studies, covering weekday and weekend markets respectively, utilizing tick-by-tick transaction data from two trading venues: Hyperliquid's xyz:CL perpetual contract and the Chicago Mercantile Exchange (CME)'s CLJ6 (April 2026 NYMEX WTI crude oil futures) contract.
CME data comes from the Databento trade data source, which captures tick-by-tick transaction data, not order book snapshots. Therefore, all depth and slippage estimates for CME are based on actual trading volume, not quoted depth. Hyperliquid data comes from Hyperliquid's public S3 database, which contains a complete on-chain transaction record.
Therefore, the analysis for both trading venues is based on actual trading volume. All depth data represents explicit liquidity, i.e., the volume within a specific basis point range around the VWAP mid-price in a 5-minute window, not the full resting depth on the order book.
Research Period and Market Context
The research period is from February 27 to March 16, 2026, a time of geopolitical turmoil following Iran's attack on February 28, 2026.
- Pre-attack market close: The last CME trading day before the attack occurred.
- Monday open: The market reopened under significant pressure, with CME prices gapping up sharply, while the Hyperliquid xyz:CL market was constrained by discovery boundaries.
- Subsequent weekends: Due to high oil prices, market volatility kept trading volume on the Hyperliquid platform elevated.
xyz:CL launched in early 2026, meaning these three weekends of observation cover the early maturation stage of the Hyperliquid market. The observed trends, including improved liquidity depth, increased trading volume, and user base growth, partly reflect market maturation. But we believe on-chain exchanges currently cannot compete with traditional exchanges in absolute metrics like liquidity depth or slippage.
Our research aims to track directional trends: whether the gap between the two is narrowing, how fast it's narrowing, and under what conditions it narrows.
Data Analysis
Data analysis is divided into two parts by time period:
- Weekday Period: Covers the full three-week period, comparing the depth, slippage, and premium/discount traded between Hyperliquid and CME during weekdays. For Hyperliquid, we also analyze its funding rate over the entire period.
- Weekend Period: Within the given timeframe, covering three weekends, we analyze price discovery and the price gap deviation of Hyperliquid relative to the CME opening price.
Weekday Period Data Analysis
This analysis covers the full three-week period, focusing on times when both exchanges are active.
Liquidity depth is measured by the dollar trading volume within ±2, ±3, and ±5 basis points of the VWAP mid-price in each 5-minute interval, summarized as the median of all weekday intervals. As mentioned, this reflects the volume within the interval, not the resting quoted depth. This method may underestimate the liquidity depth of both CME and Hyperliquid.
Execution slippage is estimated using a synthetic order book sorted by trade price. Within each 5-minute period, observed taker trade records are sorted in ascending price order (simulating walking the sell side) and executed sequentially until the target order size is reached. The arrival price is set as the lowest trade price in that period (representing the best ask price when the order arrives). Slippage is calculated as the difference between the executed volume-weighted average price (VWAP) and the arrival price, expressed in basis points. This method is applied to incremental order sizes from $10,000 to $1,000,000.
Weekday Period Hypeliquid-CME Basis: Tracks the signed price difference between the Hyperliquid mid-price and the CME last price in all 5-minute windows during weekday periods. This reflects any structural premium or discount of Hyperliquid relative to the CME reference price during active hours. The Hyperliquid mid-price is derived from the volume-weighted average price (VWAP) of trades in each 5-minute trading period, not real-time order book quotes.
Hyperliquid funding rate is calculated hourly, expressed in basis points per hour.
Weekend Period Data Analysis
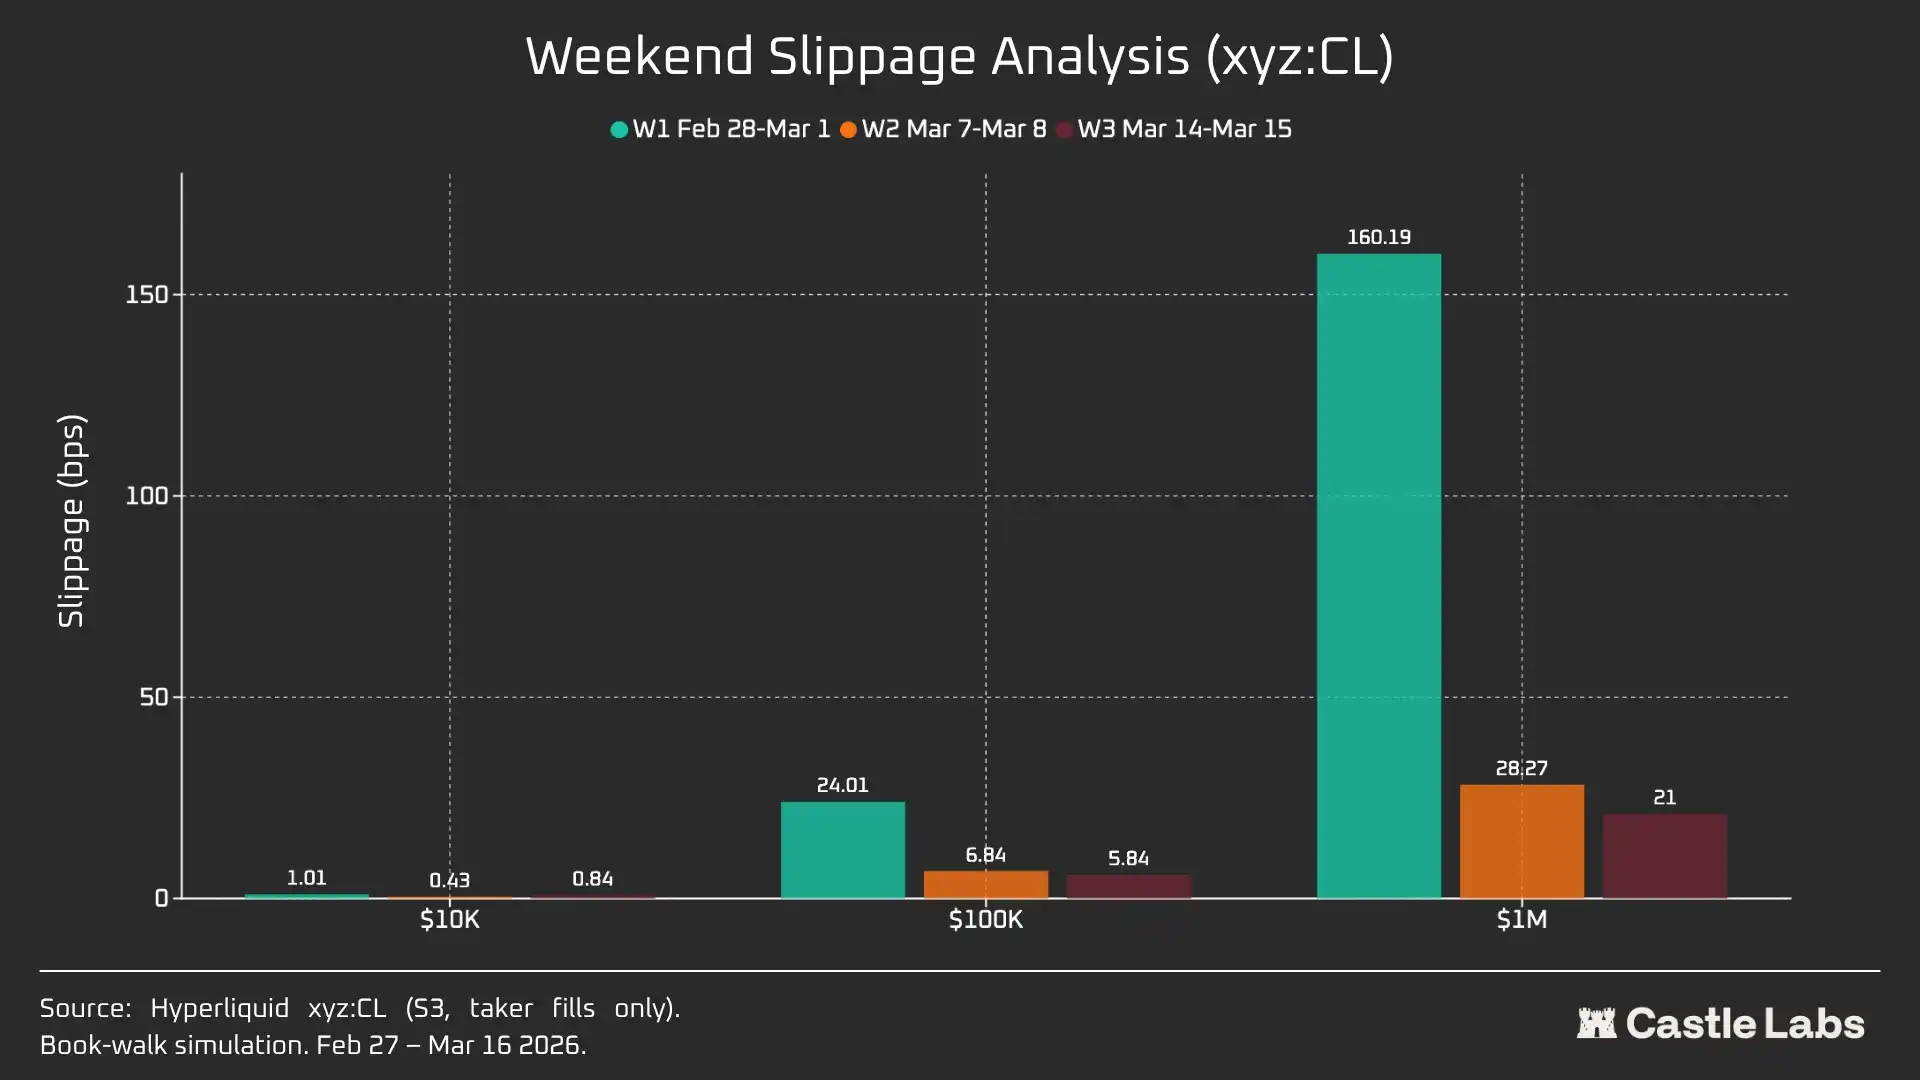
This analysis focuses on three distinct CME weekend closure periods:
- W1: February 28 - March 1, 2026
- W2: March 7 - March 8, 2026
- W3: March 14 - March 15, 2026
In W1 and W2, the Hyperliquid perpetual contract was restricted, meaning the mark price could not exceed the "Discovery Boundary" (DB). When the oracle price freezes (e.g., when the primary reference market (CME) is closed and external price data sources stop updating), the protocol effectively restricts the price to a narrow range.
For each weekend window, we report key data metrics for Hyperliquid xyz:CL, including price, volume, and number of trades. To measure the Monday opening price gap deviation, each weekend we measure the price gap between Hyperliquid and CME at three reference points:
- 3 hours before CME reopens
- 1 hour before CME reopens
- At CME open (T=0)
All gaps are expressed in basis points, with positive values indicating Hyperliquid is above the CME open price, and negative values indicating a discount.
Quantitative Analysis
This section begins with an analysis comparing the liquidity situation of the Hyperliquid xyz:CL HIP-3 crude oil market with NYMEX CLJ6 during overlapping weekday hours.
Liquidity Depth: Hyperliquid is Less Than 1% of CME
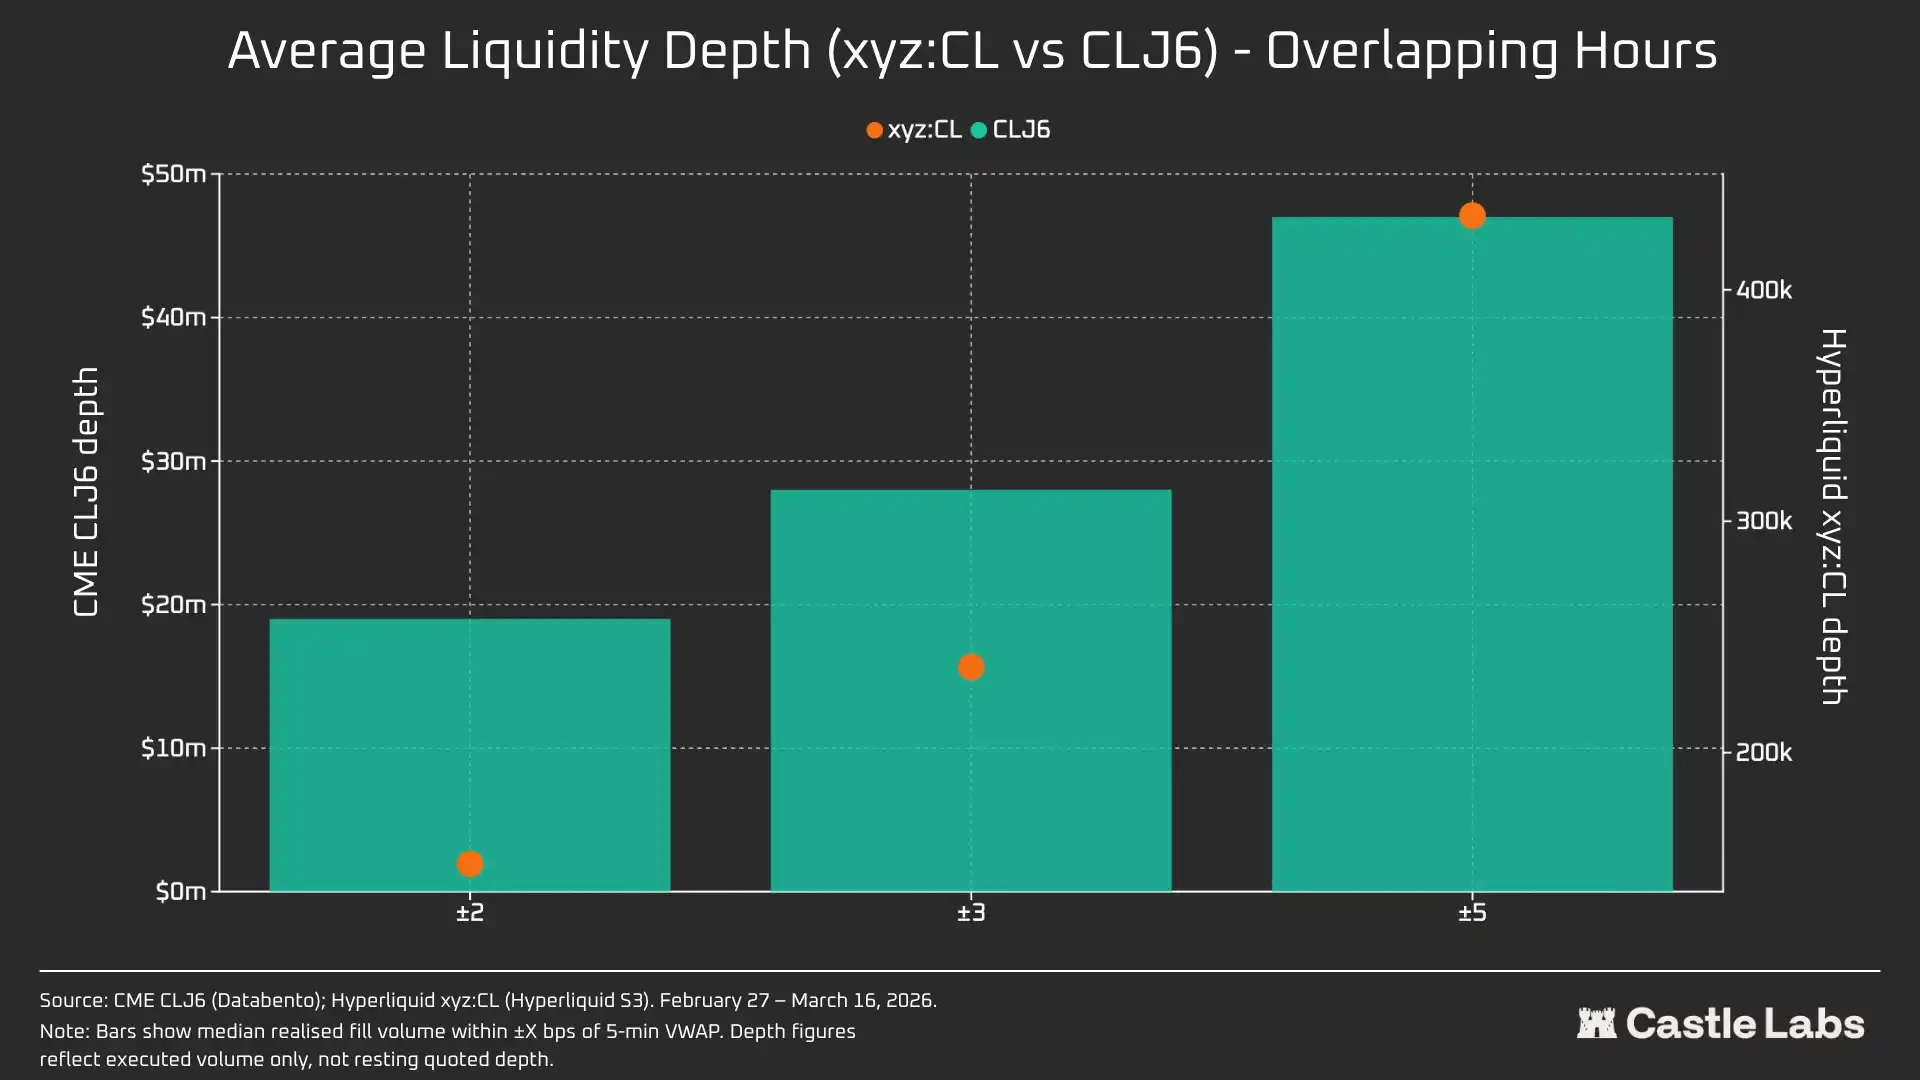
Unsurprisingly, the liquidity profile of on-chain exchanges is starkly different from CME. The average liquidity depth of CL on Hyperliquid is less than 1% of CLJ6, and the depth is consistent across price ranges (109x at ±5 bps). Within the ±2 bps range around the mid-price, the executable depth on CME is $19 million, while on Hyperliquid it is only $152,000, a difference of 125 times.
This is not unexpected given the novelty of the CL market on Hyperliquid and its different target user base. The primary value of on-chain exchanges lies in providing permissionless trading channels for users traditionally excluded from institutions like CME.
However, as weekend trading volume grows on DEXs like Hyperliquid, perceptions of these platforms are beginning to shift, and institutional investors' interest in hedging positions during non-trading hours is increasing. Therefore, it becomes increasingly important for Hyperliquid to create a market environment suitable for both traditional investors and retail traders.
For retail traders with order sizes of $10,000, this cost gap is negligible. But for institutional investors with order sizes exceeding $1 million, the on-chain transaction costs for CL (and most other markets) remain prohibitive.
Indeed, the inherent differences in user base are reflected in the median trade sizes during these overlapping market hours.
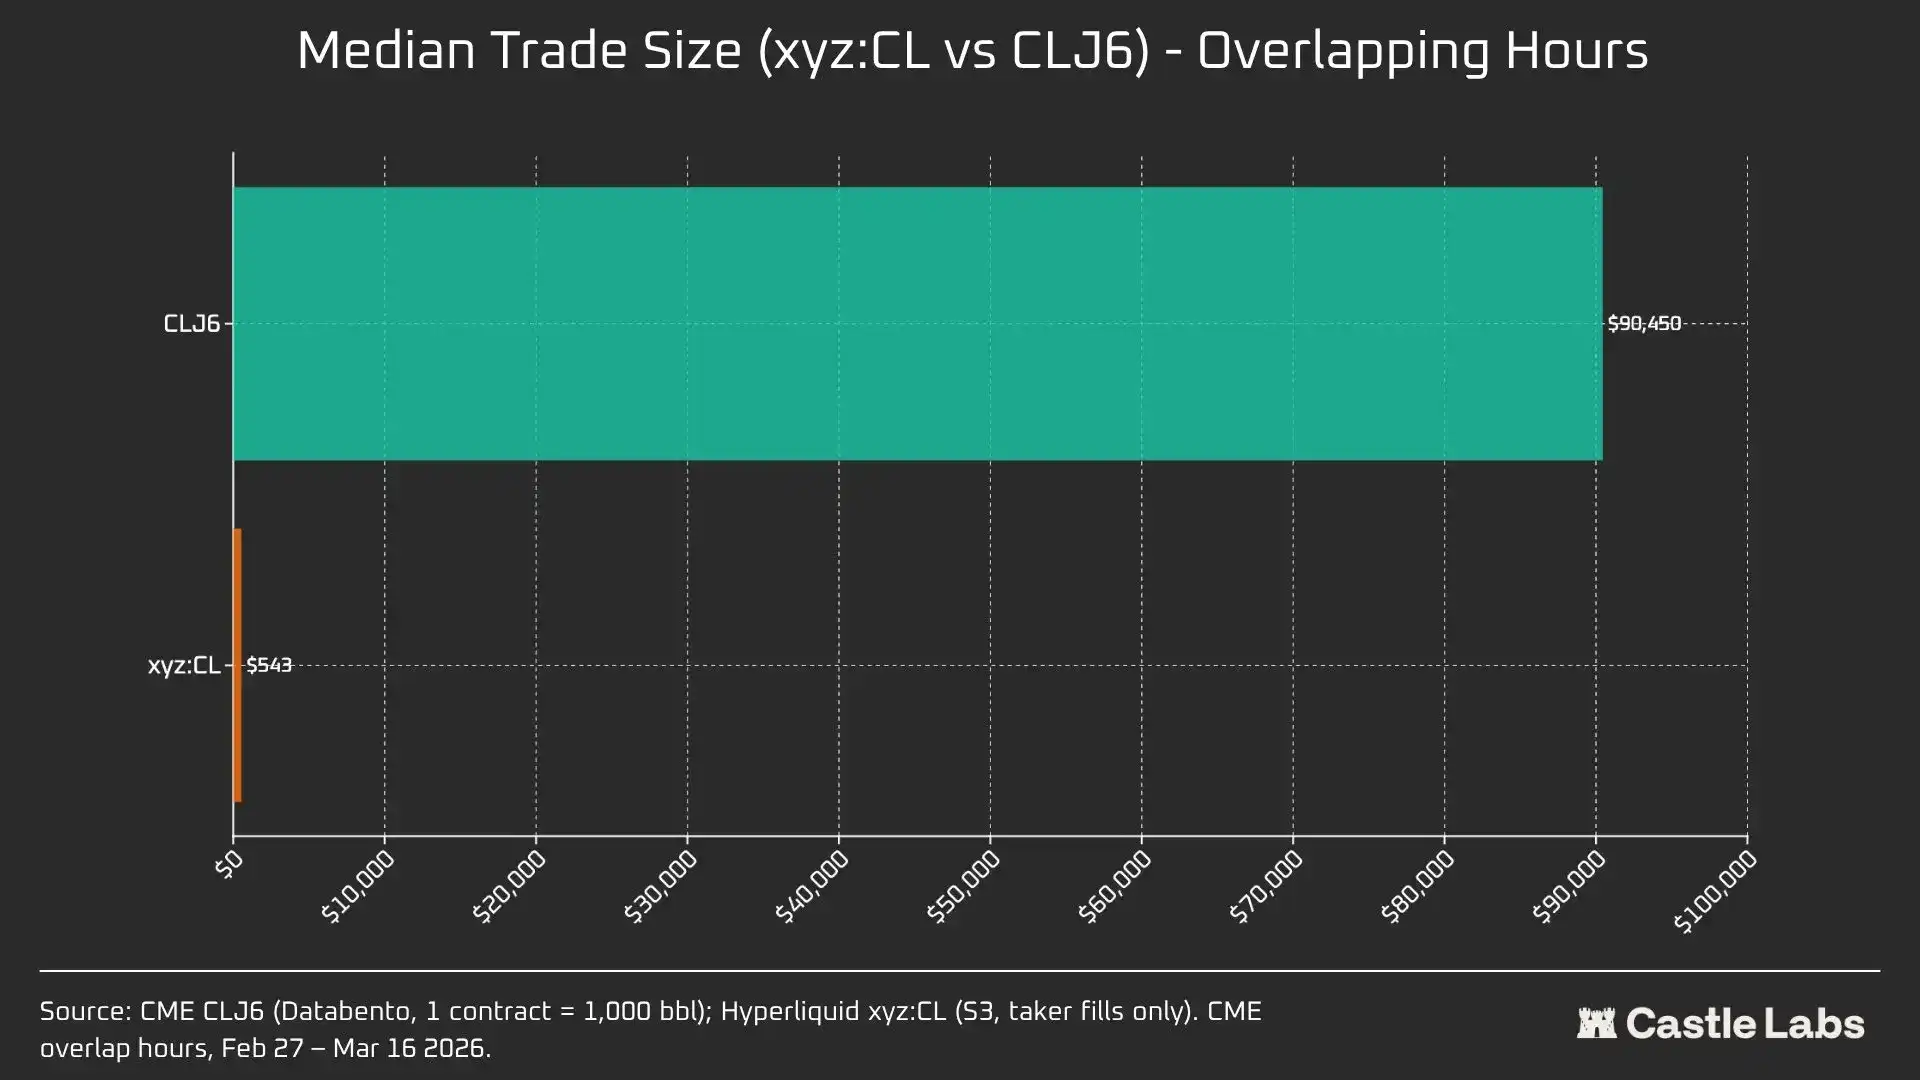
A 166-fold difference in median trade size ($90,450 vs $543) most clearly demonstrates the fundamental difference in the user groups served by these trading venues. The median trade size for CLJ6 is comparable to one standard crude oil futures contract (nominal value ~$94,000 at current prices), while Hyperliquid's median trade size of $543 reflects leveraged directional bets by crypto-native retail traders.
We expect the median trade size on Hyperliquid's commodity markets to reach an inflection point as these markets become increasingly legitimized in the eyes of more traditional investors and capital moves on-chain.
To further distinguish between different trade sizes, we conducted order simulations with order size caps ranging from $10,000 to $1,000,000.
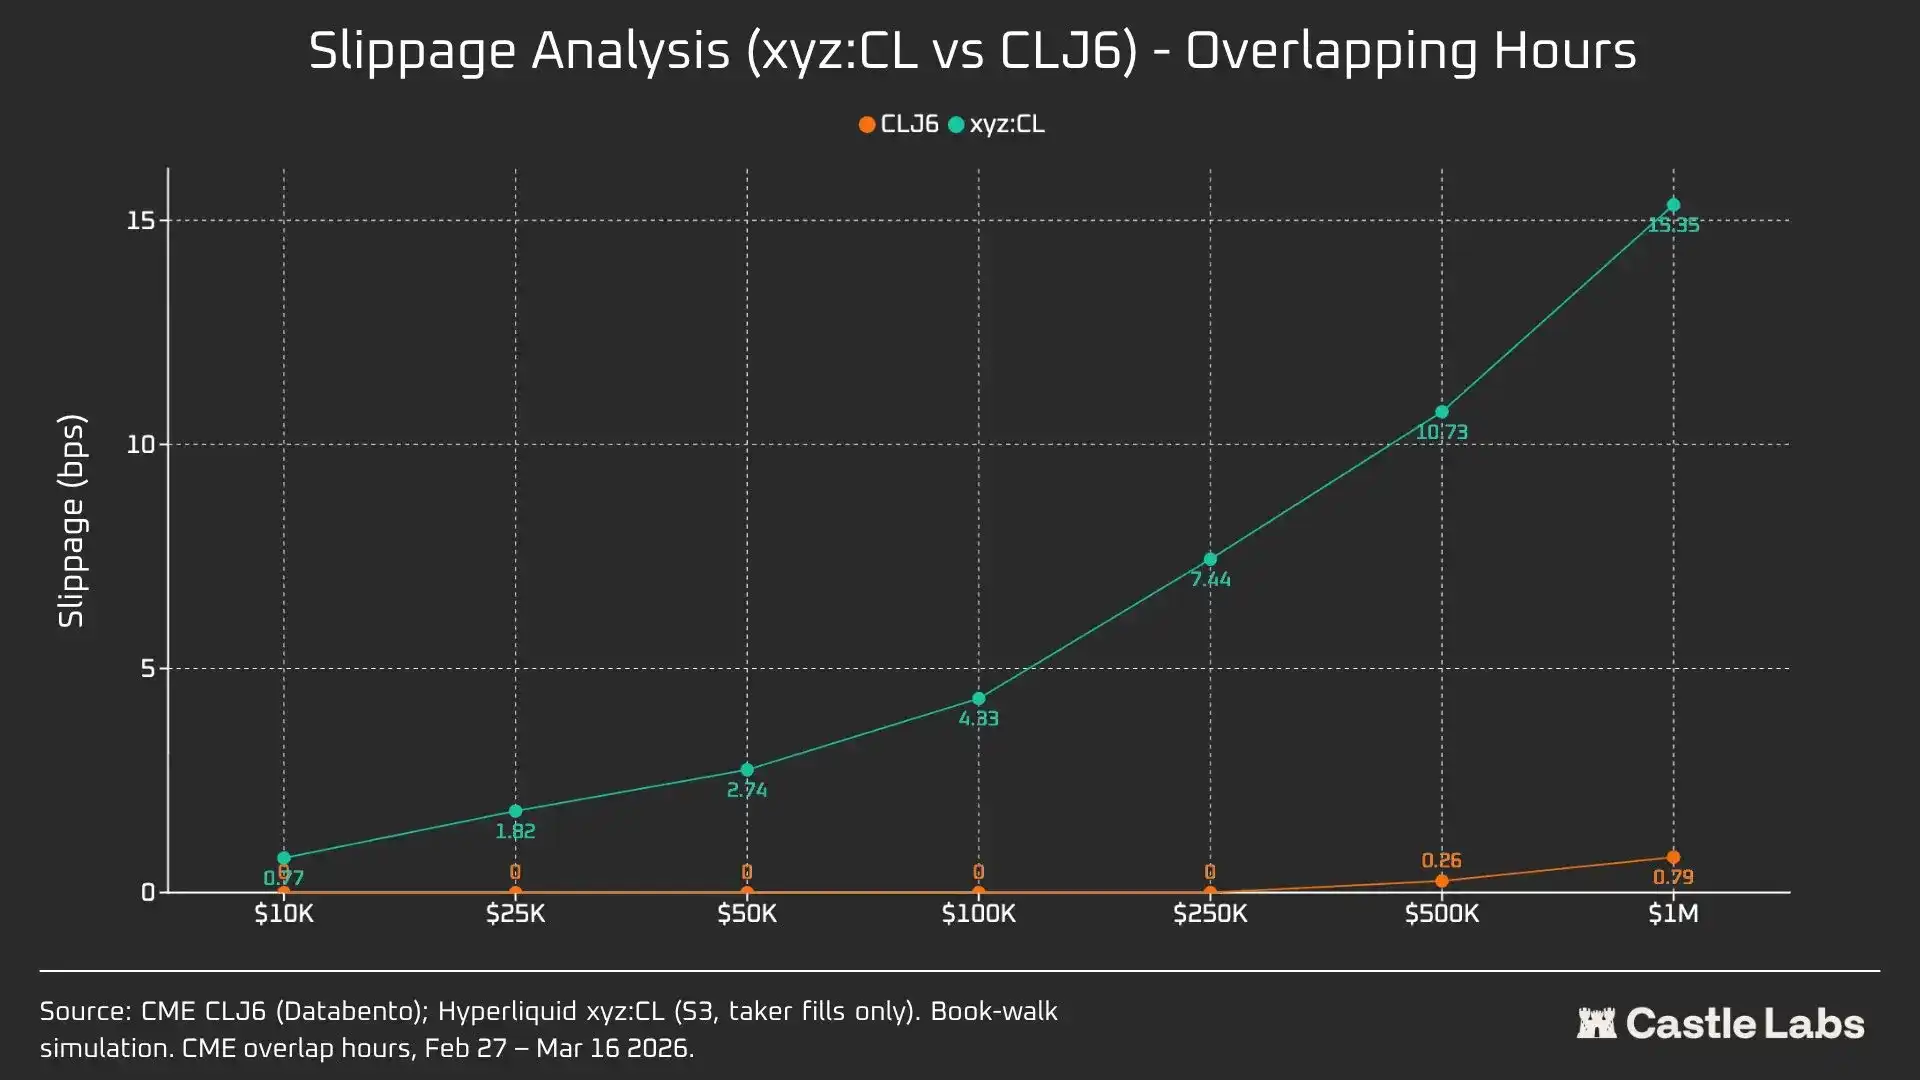
For a $10,000 order, CLJ6 traders experience no slippage, as expected, while Hyperliquid users have a median execution slippage of less than 1 basis point, at 0.77 bps. The gap appears at the $100,000 order size, where Hyperliquid users' slippage rises to 4.33 bps, approaching the 5 bps threshold, while CME CLJ6 still has no slippage.
Notably, this is higher than the median trade size ($90,450) in the CLJ6 market.
At the $1,000,000 trade size, Hyperliquid's 15.4 bps is about 20 times CME's 0.79 bps, confirming that this venue currently lacks the capacity to handle institutional-grade orders. Given Hyperliquid's average trade size, the platform can provide equally good service to its users without generating slippage.
CLJ6 orders only start to show significant slippage affecting execution around the $500,000 trade size.
When we extend the order size analysis to weekends, slippage decreases for all order sizes, especially for $100,000 and $1,000,000 orders, indicating market maturation. Over the three weeks analyzed, the slippage reduction for simulated orders was as follows:
- $10,000: -16%
- $100,000: -75%
- $1,000,000: -86.9%
Funding Rate
The funding rate for CL is more volatile during CME closing hours but less volatile during delivery hours. This helps us reveal the internal pricing dynamics of the market during non-trading hours. Weekend opening means the CL market can utilize internal price discovery mechanisms (supported by DB and other risk reduction mechanisms). Therefore, the funding rate is expected to be more volatile, as highlighted below.
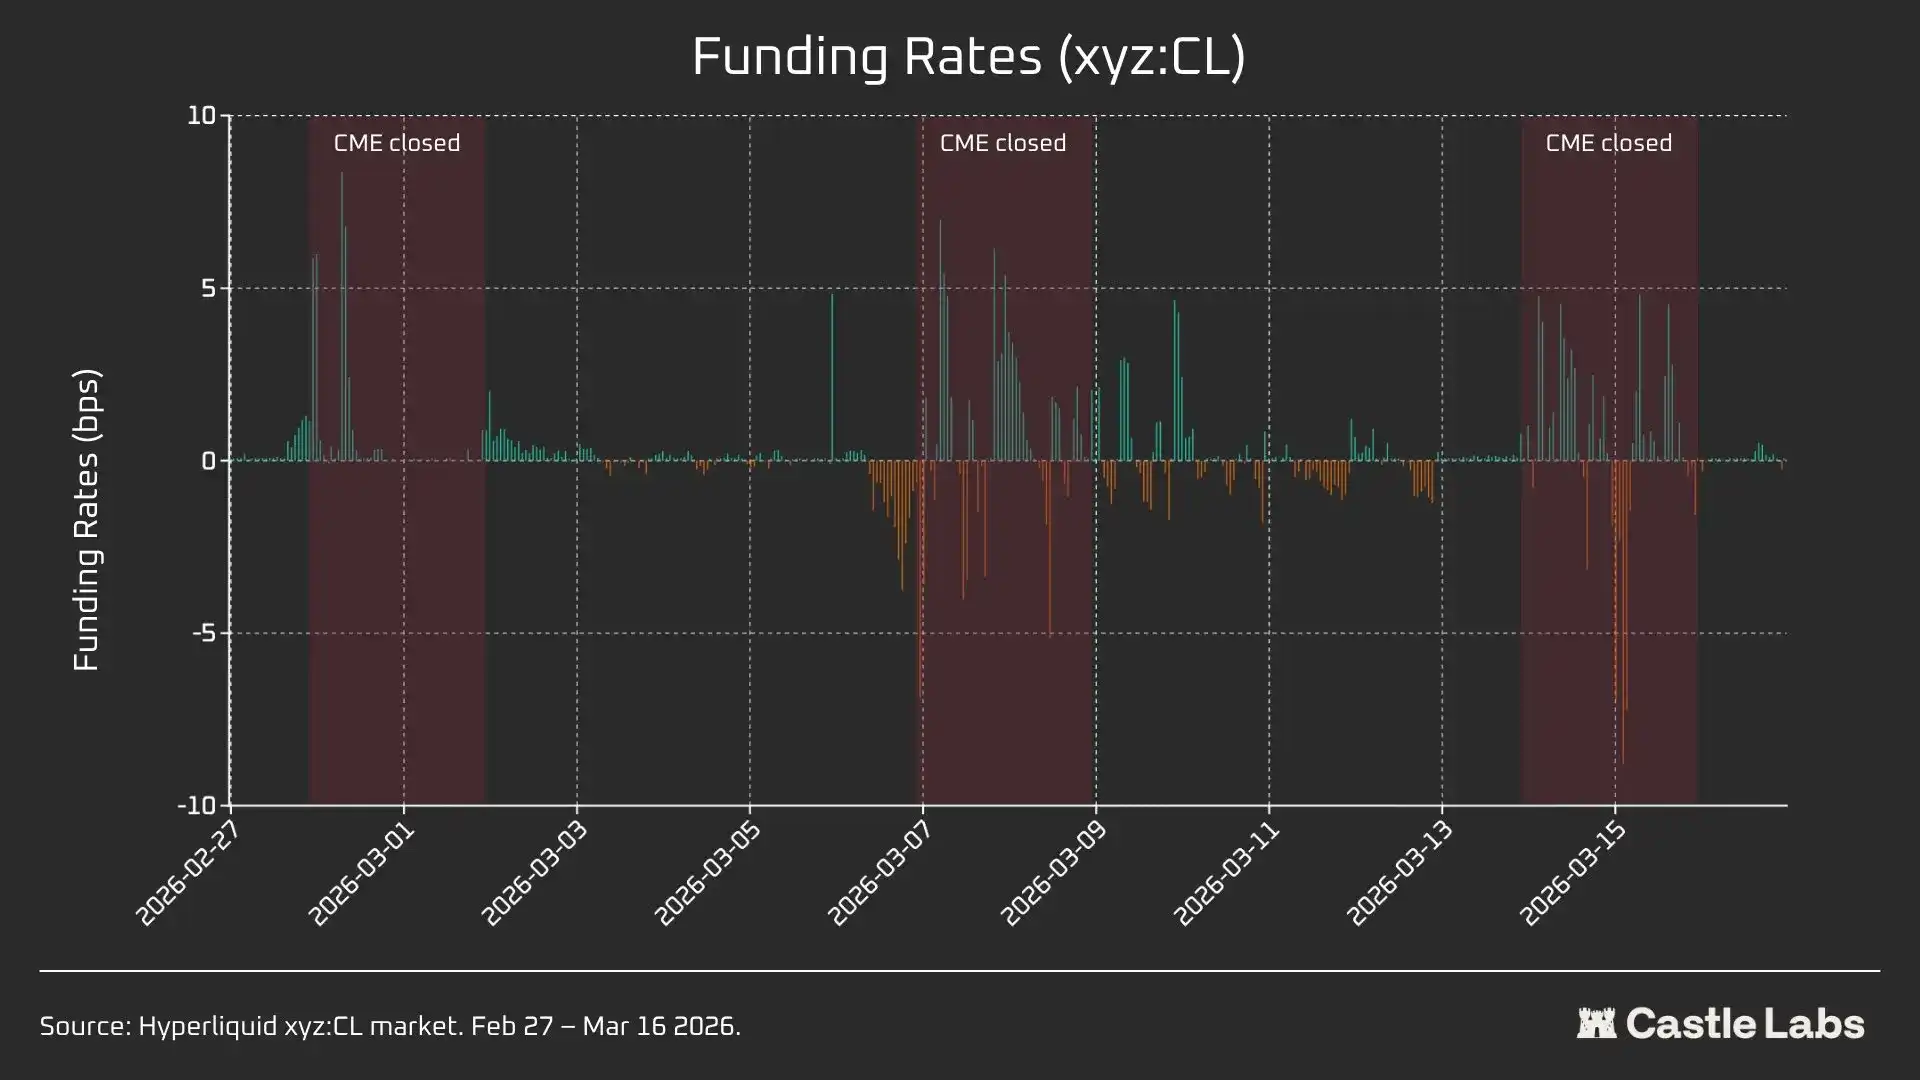
During active trading hours, Hyperliquid's xyz:CL closely follows CME's CLJ6, but a structural discount emerged and widened as oil prices rose, likely due to funding rate pressure from accumulated long positions. During weekends, when CME is closed, Hyperliquid's price discovery is further restricted by the Discovery Boundary (DB) mechanism, which limits mark price fluctuations in the absence of a real-time reference market.
Separate Analysis of Weekend Periods: Hyperliquid Already Has Price Discovery Capability
These three weekends demonstrate the rapid maturation process of the Hyperliquid market:
W1: February 28 - March 1, 2026 (Iran Attack Event)
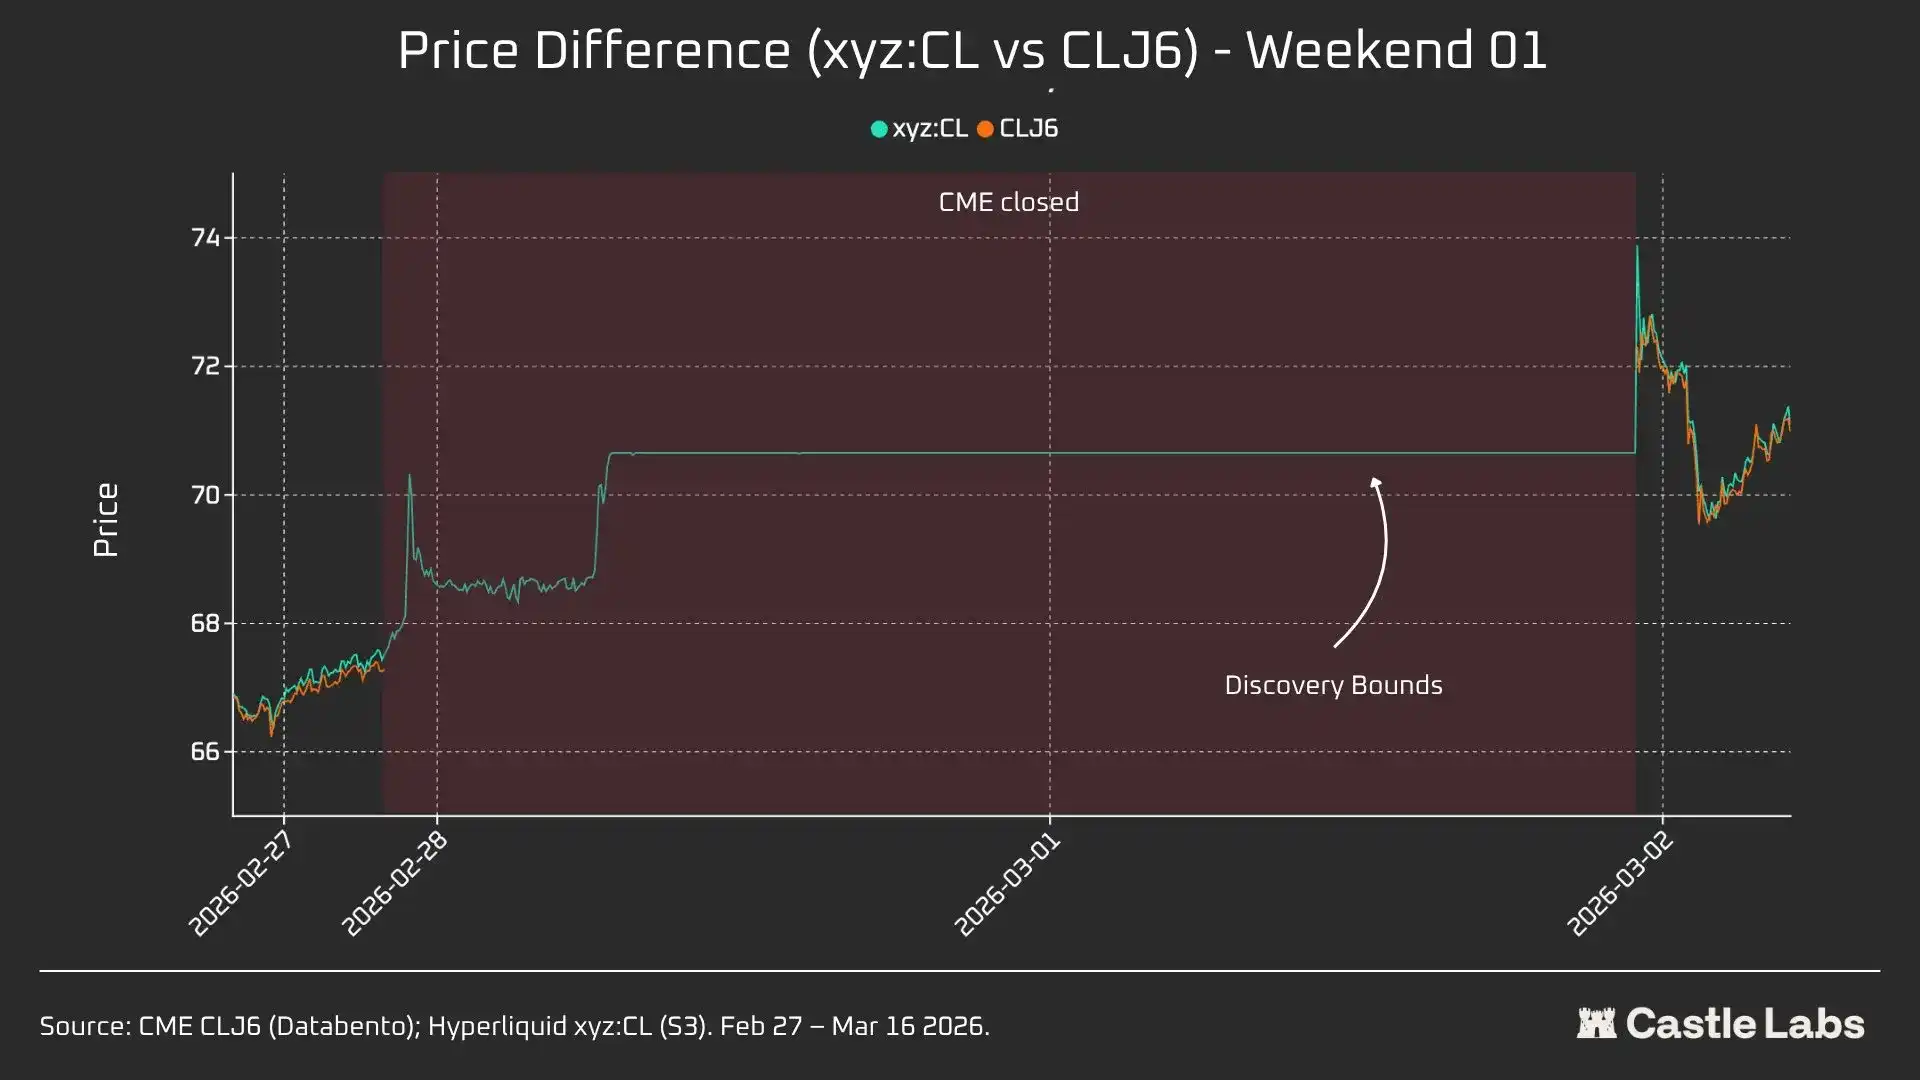
The price on Hyperliquid rose from near CME's $67.29 to about $70.80, capturing about 45% of Monday's final gap up to $75 (+1146 bps).
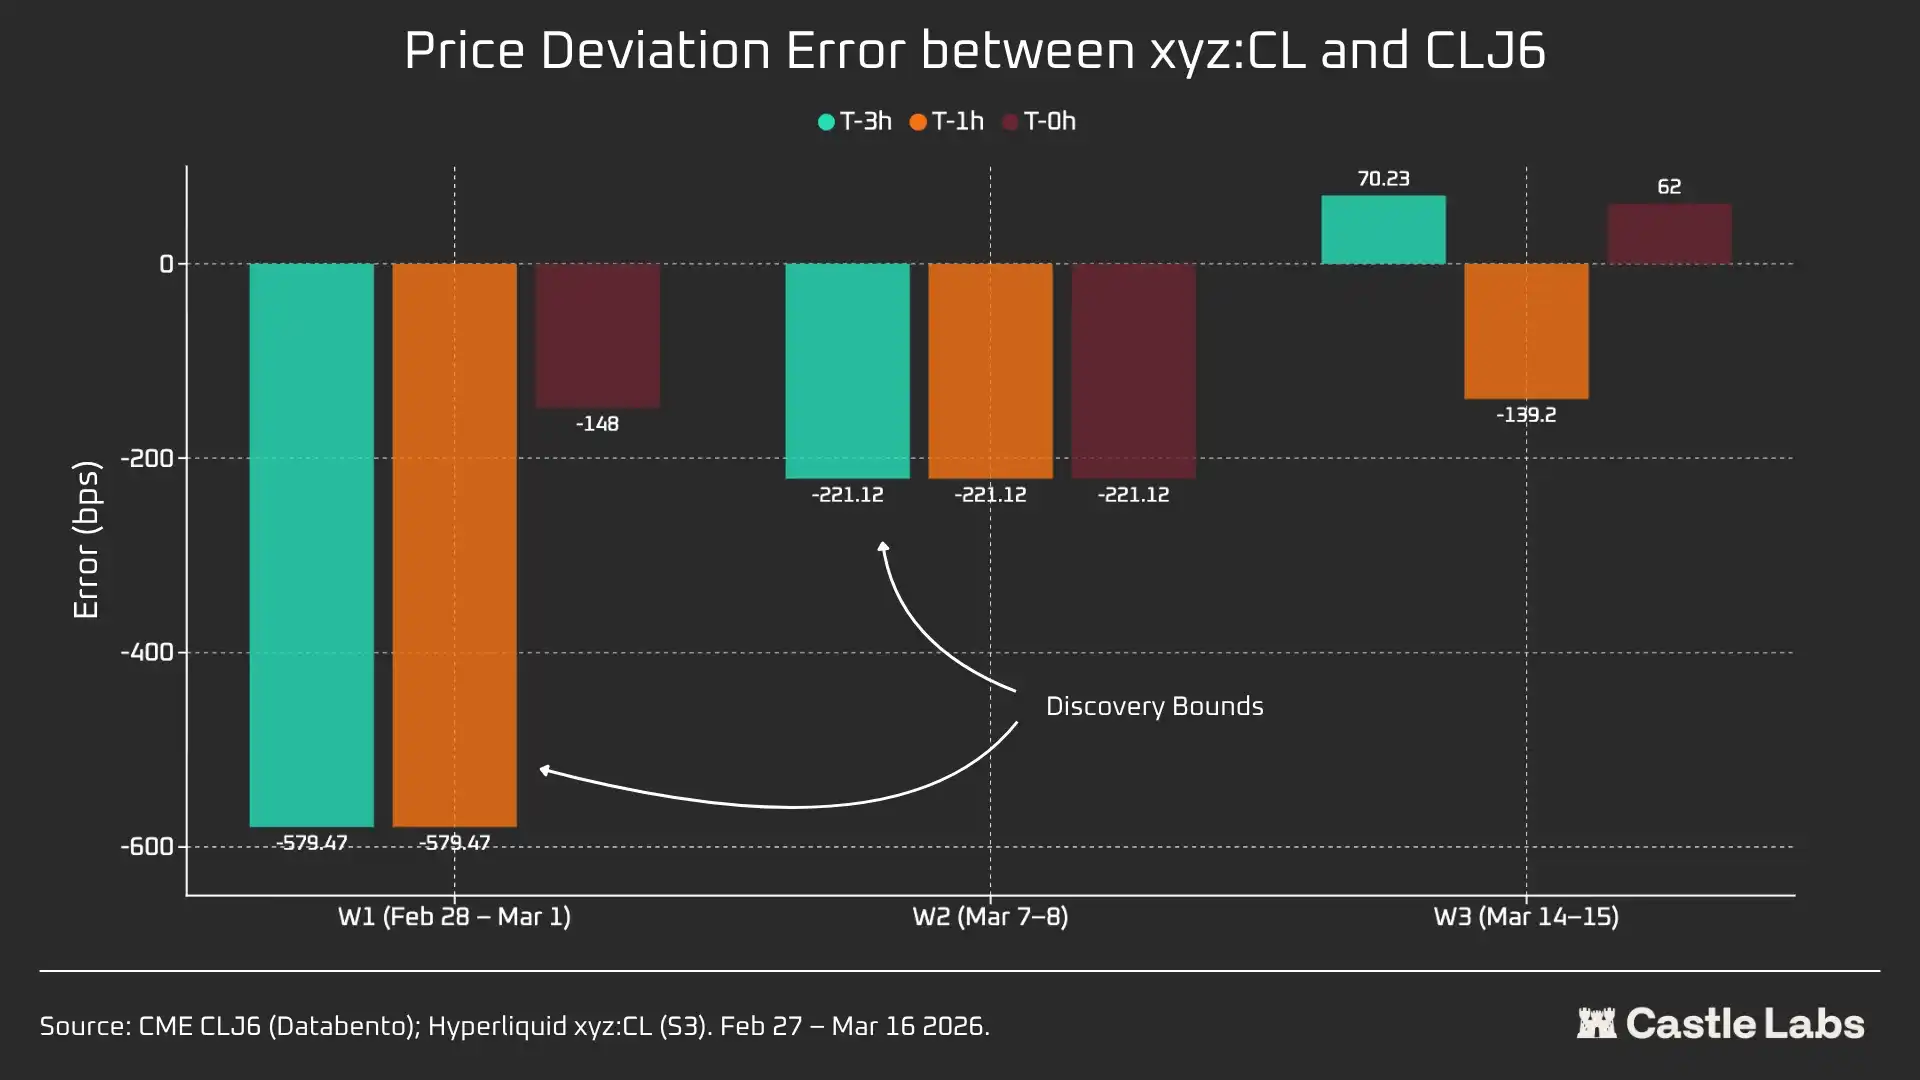
It is important to note that price discovery this weekend was limited by the ±5% price boundary restriction mechanism (DB) mentioned above on trade.xyz. This explains the flatter curve in the chart and Monday's gap up. Nevertheless, in the first second paired data was published, the gap between Hyperliquid xyz:CL ($73.89) and CME CLJ6 ($75) was within 1.5%.
This is not a "mistake" or "failure," but risk protection achieved through market design. Therefore, from a data perspective, the first weekend has the lowest correlation, but it highlights that xyz:CL reacted to the initial shock of the Iranian airstrike, while also recognizing the importance of DB as a weekend price discovery mechanism, especially for emerging markets.
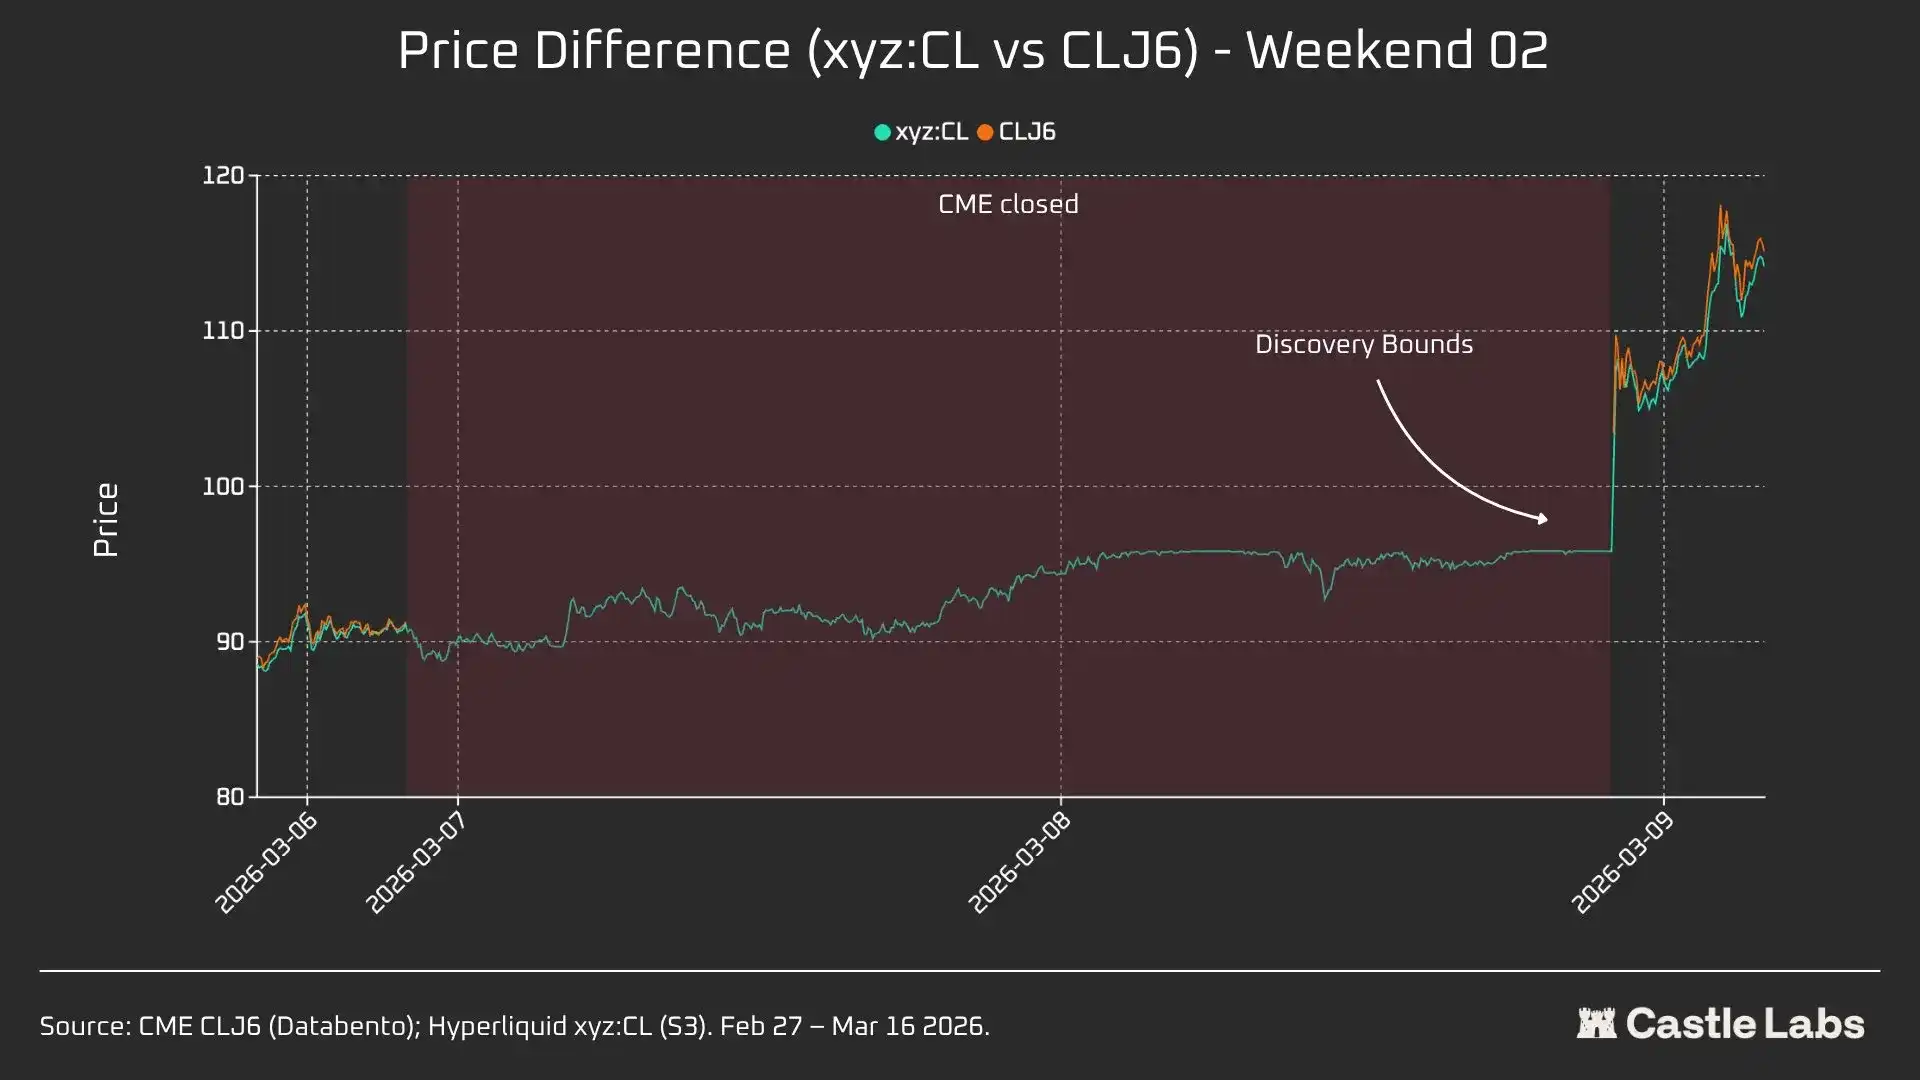
W2: March 7 - March 8, 2026
The second weekend was the real test, as xyz:CL hit the boundary price late in the market session. CLJ6 opened at $98 (up 737 bps from the $91.27 close), while xyz:CL peaked at about $95.83, capturing only 68% of the gain.
In the second weekend, xyz:CL better captured the market move and was closer to CME's opening price than the previous weekend.
W3: March 14 - March 15, 2026
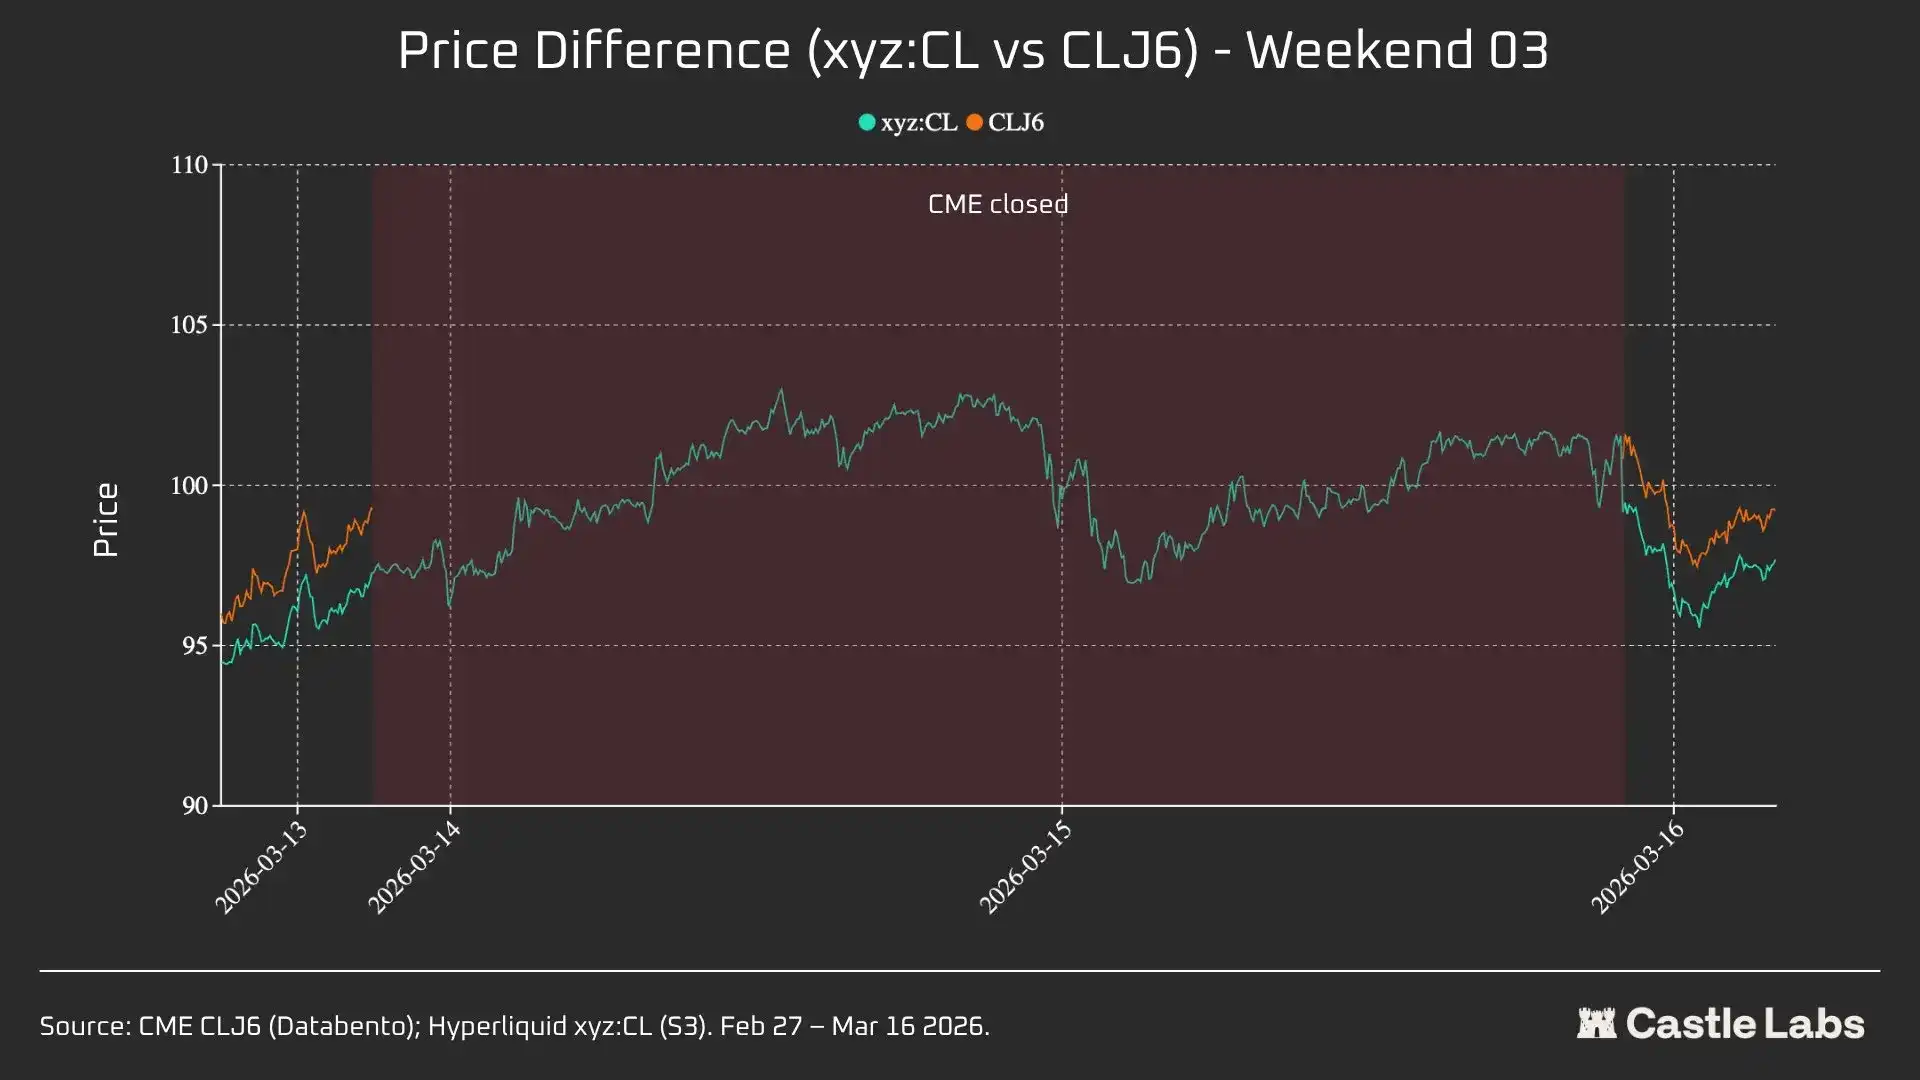
Data from the third weekend indicates that in calmer market conditions, Hyperliquid can more reliably predict CME's final opening direction.
This weekend saw the best convergence between xyz:CL and CLJ6: up 226 bps from the CME close, slightly above Monday's open of 62 bps. CLJ6 closed Friday at $99.31 and opened at $100.93 (up 163 bps), while xyz:CL opened at $101.56.
Taken together, these three snapshots show a structural change in the xyz:CL market on the Hyperliquid platform, transitioning from an emerging market constrained by DB price discovery (Weekend 1 and 2) to one with increasingly free price discovery, exhibiting overshoot and correction (Weekend 3).
Analyzing the price bias error at different times before the CME open (3 hours, 1 hour, 0 hours) across weekends, W3 data is the most reliable, as the xyz:CL market was affected by DB in the first two weekends. In W3, xyz:CL had errors of approximately +70 and -139 bps at 3 hours and 1 hour before the CME open, respectively, indicating better price discovery capability than the previously analyzed weekends.
Other Metrics
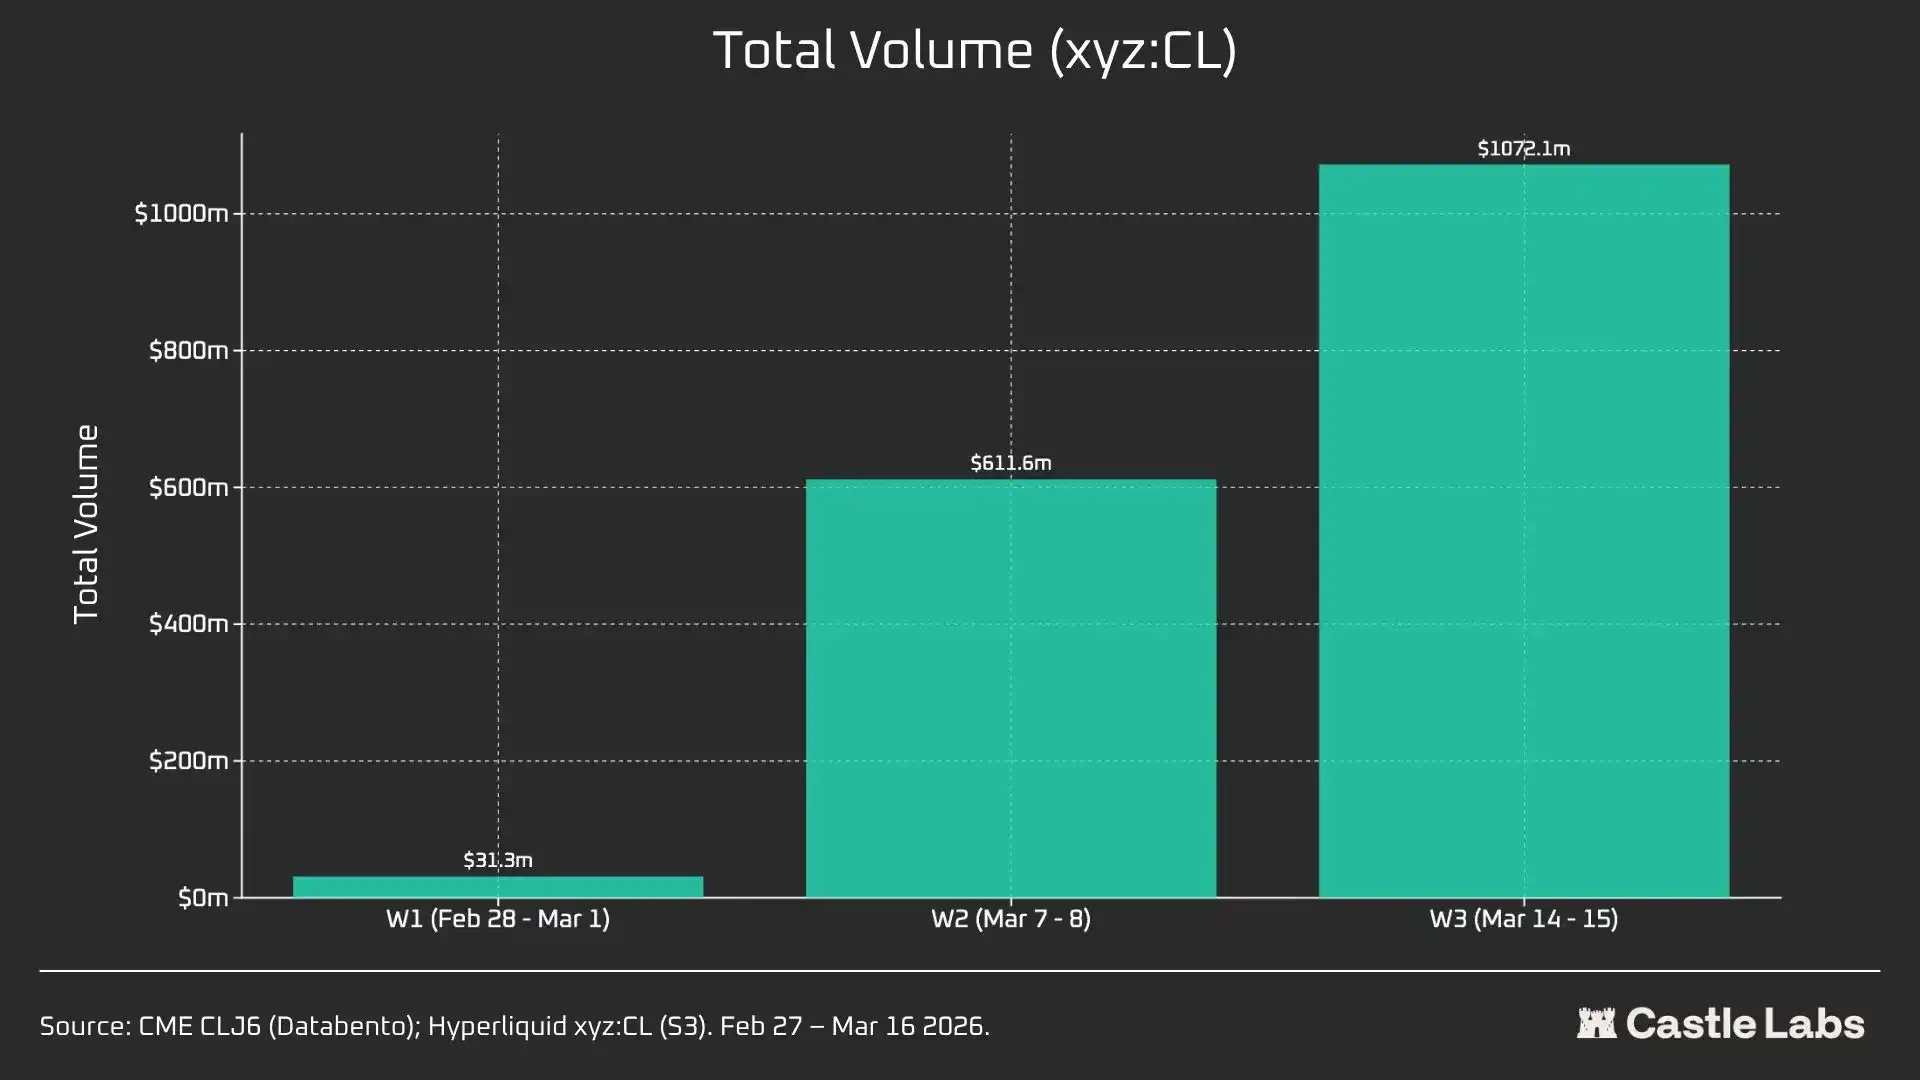
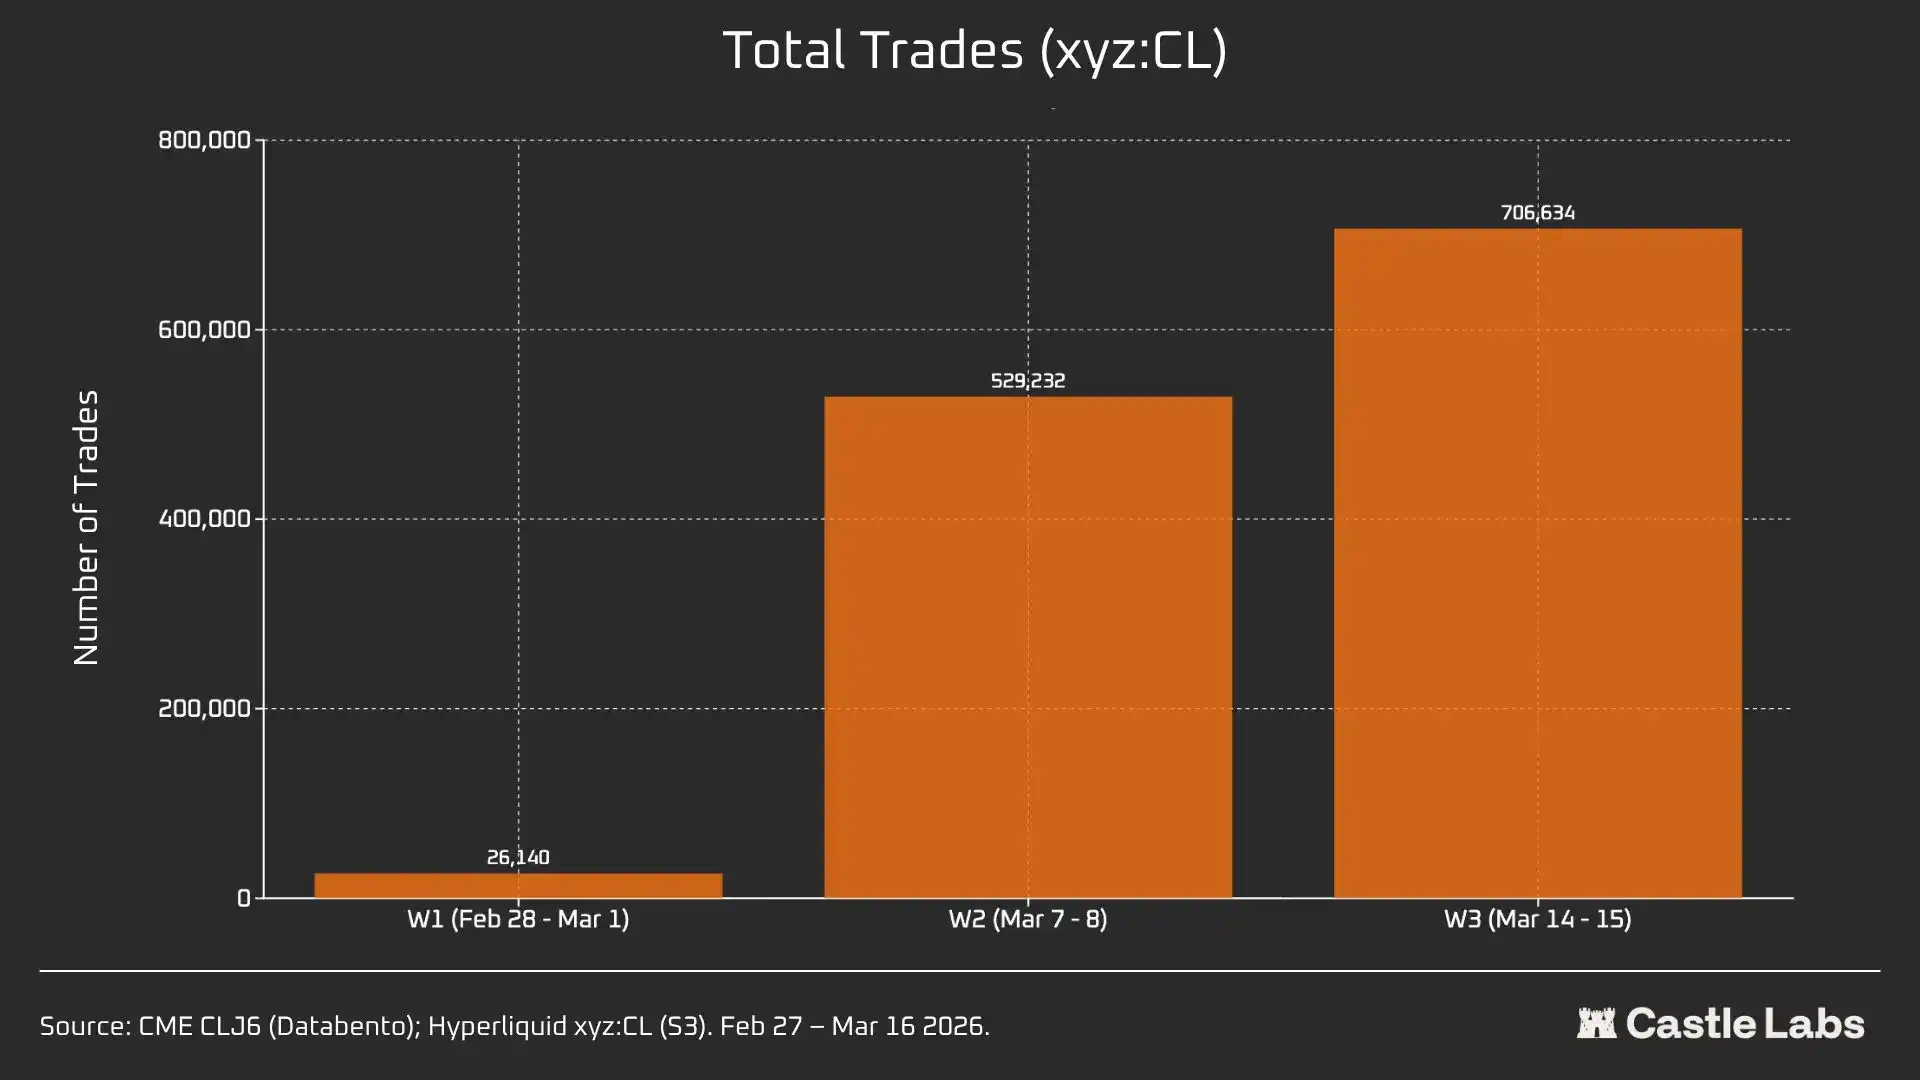
We also provide other metrics for the weekend summary analysis, including trading volume, total number of trades, and average trade size. These metrics varied between weekends and showed continuous growth over consecutive weekends.
The total trading volume of the xyz:CL market grew from $31 million to over $1 billion in three weeks, reflecting user growth and the market's eventual maturation.
Furthermore, the total number of trades increased from 26,000 in the first weekend to over 700,000 in the third weekend.
Notably, the average trade size on weekends actually grew from the median of $534 we mentioned earlier. The same growth trend was observed across all three weekends, potentially indicating more institutional capital flowing into the market.
The average trade size was $1199 in the first weekend, growing to over $1500 by the third weekend.
This might indicate a different user base utilizing the platform on weekends, with fewer retail users and more traders needing crude oil exposure before Monday, so weekend trading is closer to hedging needs than speculation.