Introducing: Market Compass

insights.glassnodePublished on 2026-06-18Last updated on 2026-06-18

Abstract

Glassnode introduces Market Compass, a dashboard providing a unified view of Bitcoin market conditions. It consolidates thousands of on-chain and market metrics into seven "lenses." Four forward-looking lenses (Macro, Capital Flows, Investor Behavior, On-Chain Fundamentals) feed a headline composite score from 0 (Risk-Off) to 100 (Risk-On). Three standalone lenses (Cycle Position, Derivatives, Cross-Asset Rotation) describe the current market structure. In the current reading, the headline score is 14/100 (Risk-Off), indicating a defensive regime. The Macro lens is the weakest at 23, constrained by a strong US Dollar (DXY) trading above its 200-day average. While the other forward-looking lenses show moderate improvement from recent lows, the overall picture suggests bottom-fishing within an unturned market cycle. Key observations include stablecoin supply shrinking (reduced buying power), long-term holders absorbing supply, tepid on-chain demand, and a derivatives market coiled for a potential move. The tool is designed as a contextual map, not a direct trading signal, synthesizing complex data into a single coherent read.

The hardest part of using Glassnode has never been finding the right metric. It is knowing which of the thousands to trust on any given morning, and what they add up to. The Glassnode Market Compass fixes that. It takes the indicators our analysts trust most, reads them together, and puts a single coherent read on your screen.

It does this through seven lenses. Each lens is scored from 0 to 100 and mapped to a named regime, so a glance tells you whether macro is Tightening or Expansionary, whether capital is Drained or Flush, whether holders are Distributing or Accumulating. The dashboard refreshes every day. The written read on top of it refreshes every week.

Seven lenses, two jobs

Four of the lenses are forward-looking. Macro, Capital Flows, Investor Behaviour and On-Chain Fundamentals each carry a historical relationship with where Bitcoin trades next, so the Compass averages them into the headline score that runs from Risk-Off to Risk-On. Read this one first. It is a forward-looking index, not a forecast.

The other three are standalone. Cycle Position, Derivatives and Cross-Asset Rotation describe where the market sits today rather than where it heads, so they are kept out of the headline on purpose. A frothy derivatives book tells you positioning is stretched, not which way price breaks.

Forward-looking (these feed the headline):

  • Macro: Tightening to Expansionary
  • Capital Flows & Liquidity: Drained to Flush
  • Investor Behaviour: Distributing to Accumulating
  • On-Chain Fundamentals: Contracting to Hot

Standalone (these describe the current environment):

  • Cycle Position: Capitulation to Euphoria
  • Derivatives: Deleveraged to Frothy
  • Cross-Asset Rotation: BTC Season to Altseason
The Market Compass at a glance: the headline composite above the four forward-looking lenses, with the three standalone reads below.

What it is, and what it is not

The Compass is a map. It does not tell you to buy or sell, and it is not the Bitcoin Vector, our systematic product, where strategies like the Moderate Strategy actually move allocation in and out of the market. The Vector acts. The Compass tells you where you are standing, so that a signal, or your own judgement, has context to work from.

The consolidation is the whole point. Glassnode's problem has never been too little data; there are thousands of charts to choose from, each of which answers a sliver of the question. The Compass reads them together and takes a position. Some of what it shows, a handful of the lens-level analyses, is built specifically for this product and is not on the API or in Studio. The Compass is currently still in Beta and we will be updating this with our newest experimental metrics regularly.

How to read a lens

Every lens works the same way. A basket of indicators is distilled into one 0 to 100 reading, ranked against its own multi-year history, so the score answers a precise question: how does today compare to everything this lens has done before? Five named bands turn that number into plain language

A lens score draws on an index that is built from more than just the charts on its page. The additional figures often add important context that is difficult to capture in a single score. We also provide the change, showing each lens carry its 7-day and 30-day move next to the score. This helps the reader intuitively understand how fast scores are changing.

Reading the Compass today

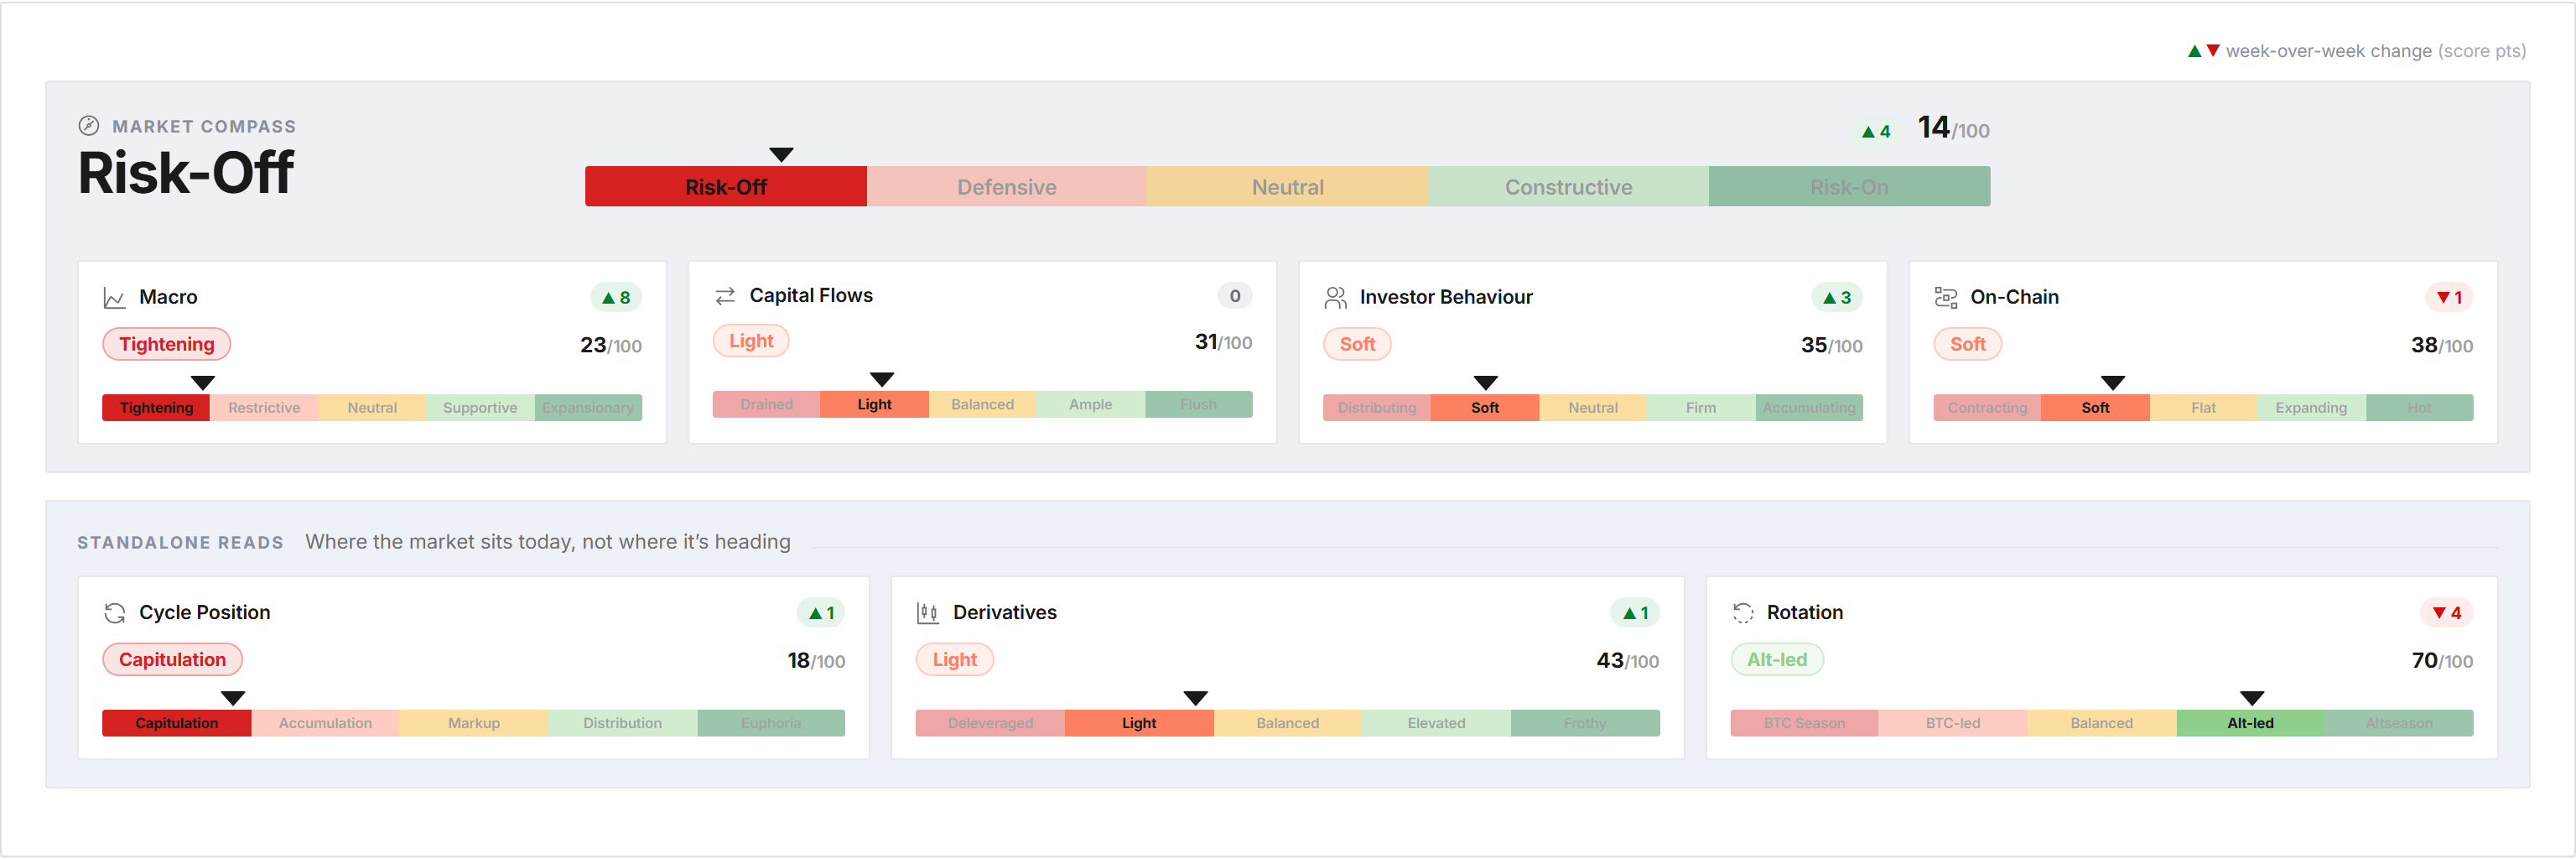
The headline currently reads 14 out of 100, Risk-Off, a level the composite only reaches in genuine bear phases, with Bitcoin near $64,400 and down 16% on the month. Beneath the number, there is additional useful context: four of the forward-looking lenses are climbing off their 30-day lows at once. The regime is defensive but it is quietly repairing from the inside.

Macro

Macro reads the backdrop for risk: the dollar, the yield curve, the front-end policy path. It sits at 23, Tightening, the weakest of the four forward-looking lenses and the binding constraint on the headline. The dollar is the reason for this. DXY is at 100.3, about 1.7% above its 200-day average, the widest premium to trend of the whole downturn. The lens has climbed from 9 a month ago, showing a moderate improvement in macro conditions. It remains to be seen whether that can help BTC heal.

The US Dollar Index against its 200-day average, with BTC overlaid. A dollar bid above trend is a headwind for risk.

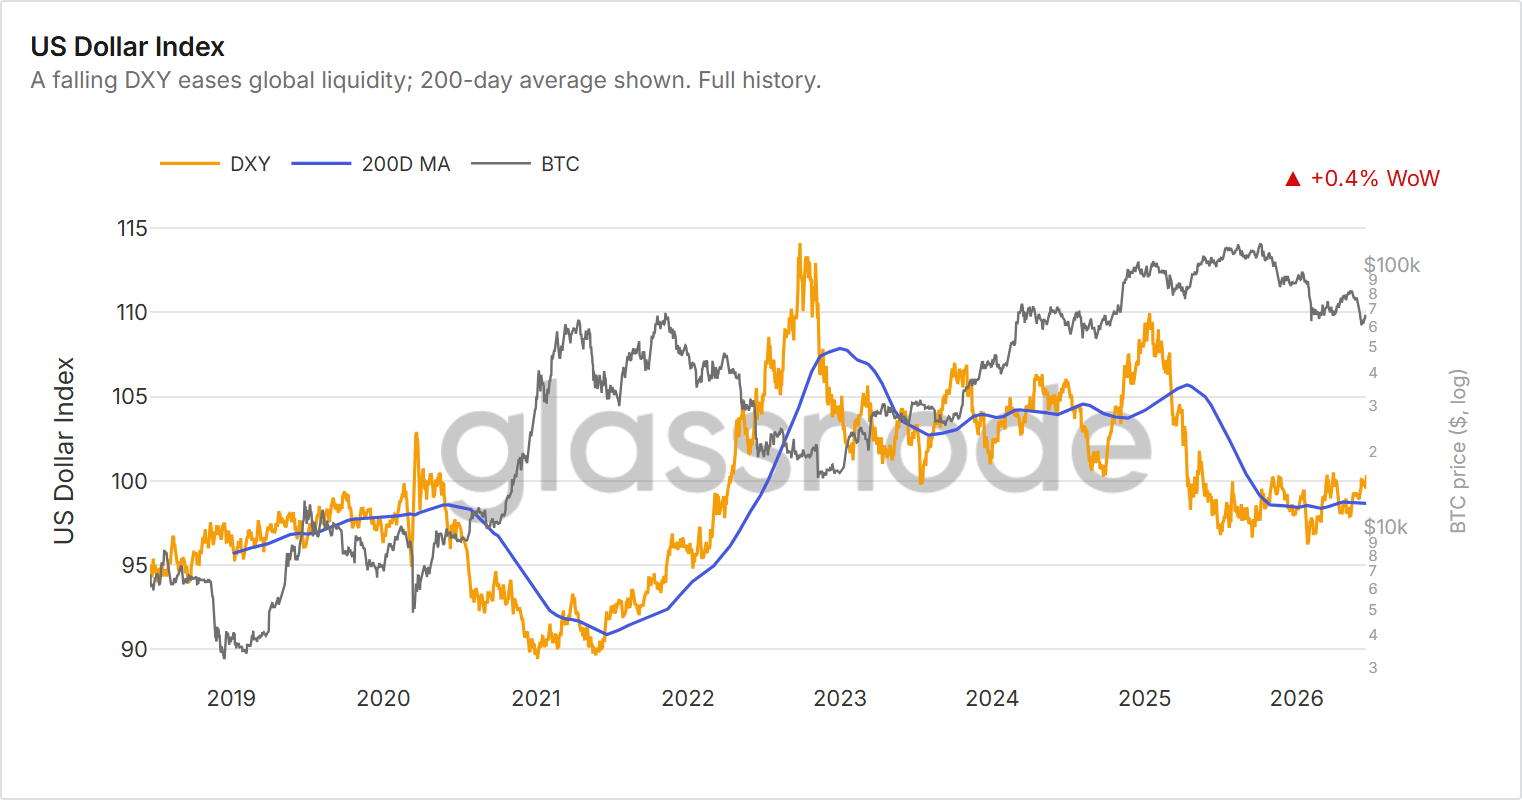
A DXY close back below its 200-day average is the single most important threshold in the framework, and it has not happened.

Capital Flows & Liquidity

Capital Flows tracks the money available to bid: stablecoin firepower, coins moving on and off exchanges, the stock held by patient accumulators. It reads 31, Light, down from 49 a month ago and flat on the week. A strong signal we are seeing here is stablecoin supply, the market's dry powder, whose 30-day rate of change has turned negative near minus 2%.

Stablecoin supply as a 30-day rate of change. Green bars are dry powder being minted; red bars are redemptions.

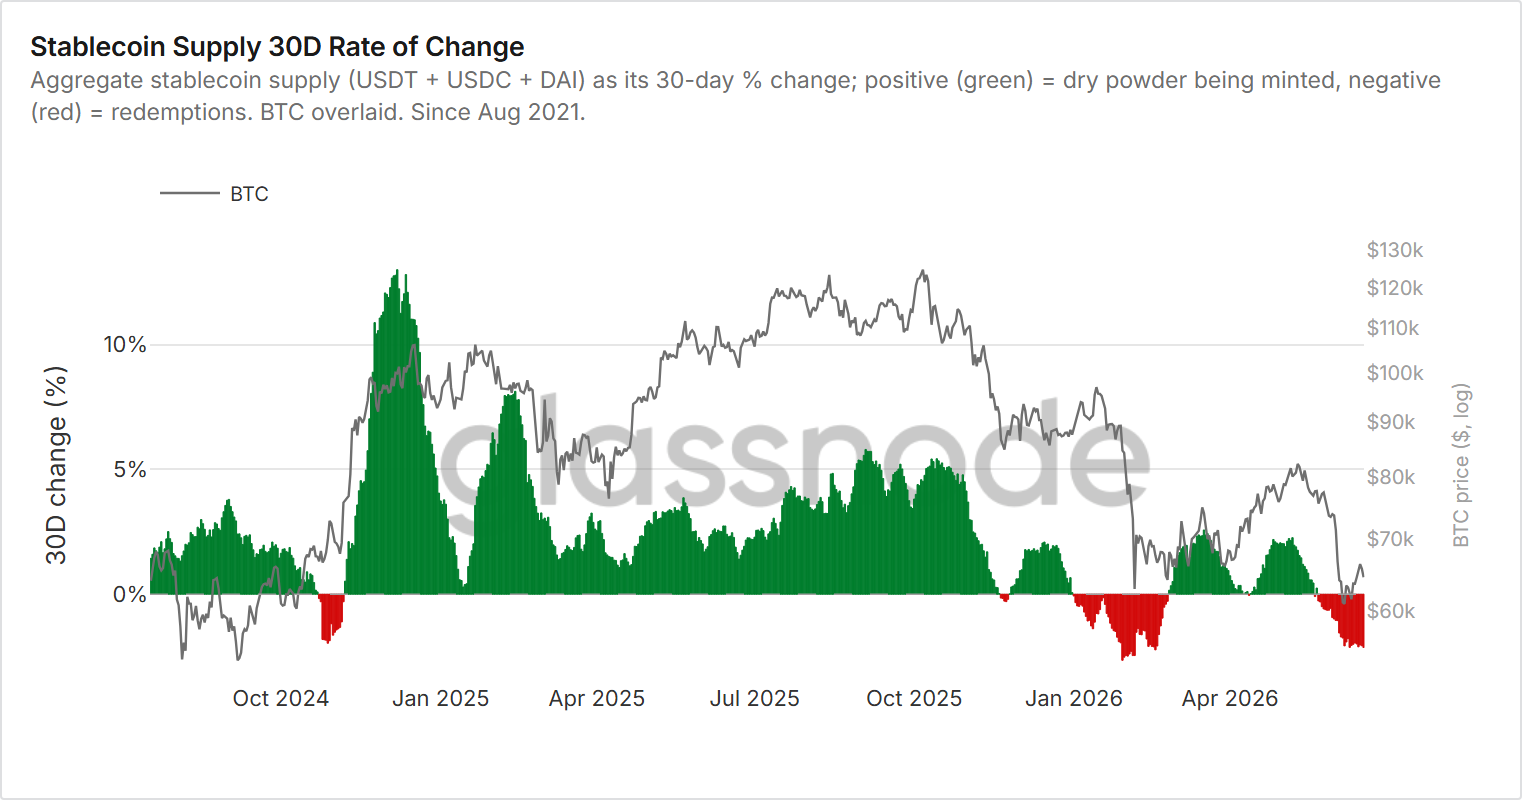
Exchange balances keep draining and spot buying has held net positive for two straight weeks, so the marginal coin is still being absorbed even as firepower leaves. The engine is not leaking hard, but it is not running either, and a minor flip back to positive on US spot ETF flows is the first clean sign it has restarted.

Investor Behaviour

Investor Behaviour reads what holders do with their coins: accumulate or distribute, hold or spend, and at what age. At 35, Soft, it is the most-improved forward-looking lens, up from 15 a month ago, the classic drawdown mechanic of supply migrating into stronger hands. Long-Term Holder supply just set a multi-year high at 88.1% of the float.

The long-term-holder share of supply against BTC. A rising share is accumulation; a falling share is late-cycle distribution.

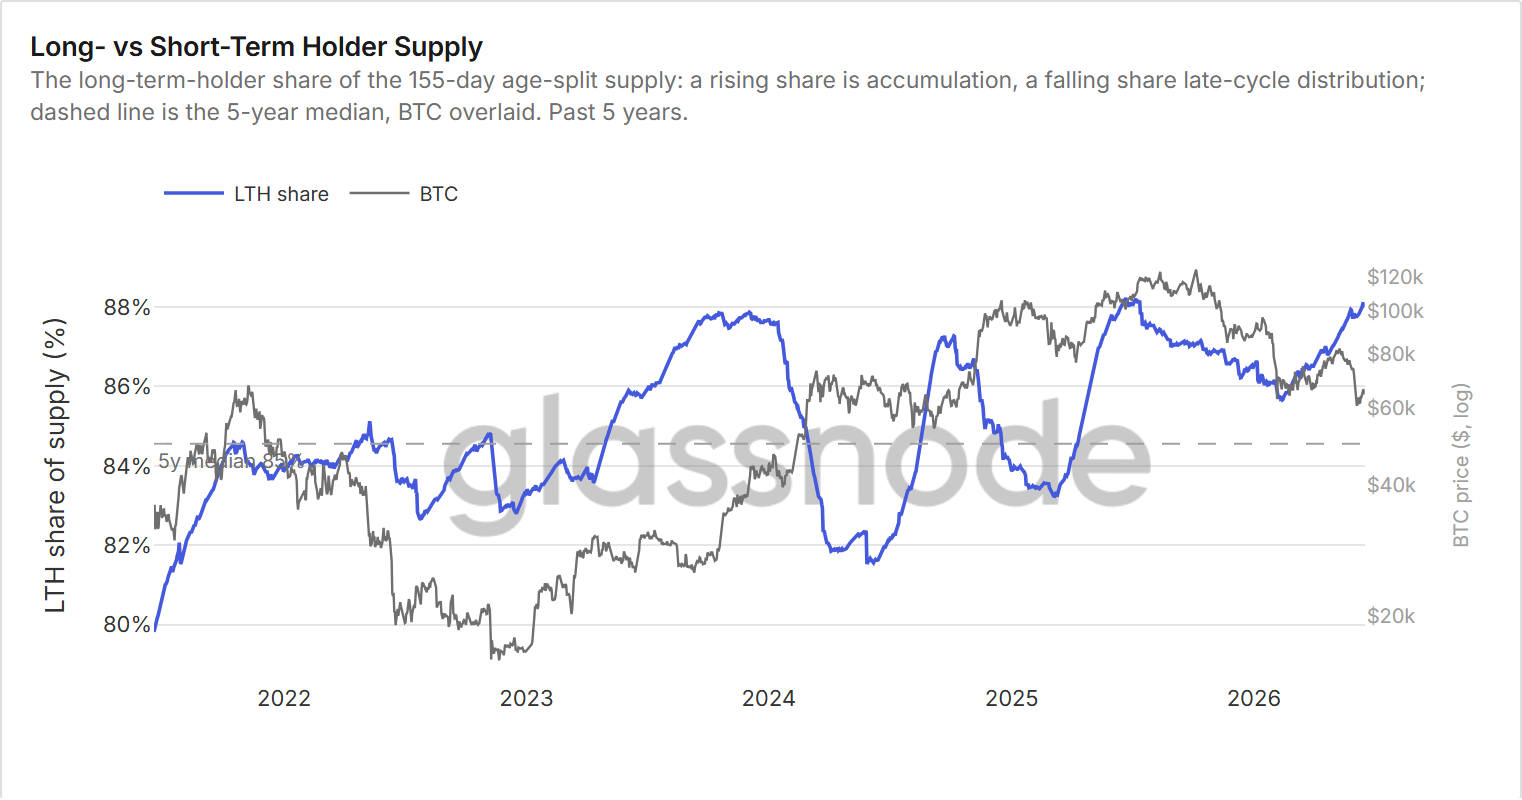
The intensity has halved, though. Hodler Net Position is still positive but down more than 60% on the week, and the Accumulation Trend Score has stalled at 0.44. Holders are soaking up the supply that sellers hand them, and the lens only turns firm once the Accumulation Trend Score crosses 0.5.

On-Chain Fundamentals

On-Chain Fundamentals is the synthesis of our demand picture: new users arriving, the network's valuation against the throughput it settles, and blockspace demand in native Bitcoin rather than dollars, which strips out the price leg. It reads 38, Soft, a network still contracting with one corner firming. Fee momentum has climbed to 0.987, near the 1.0 line that marks demand turning up, and small-entity activity runs well above large-entity activity.

The Demand Recovery Stack: participation, settlement and blockspace momentum. Blue is above the trailing-year baseline, red is below.

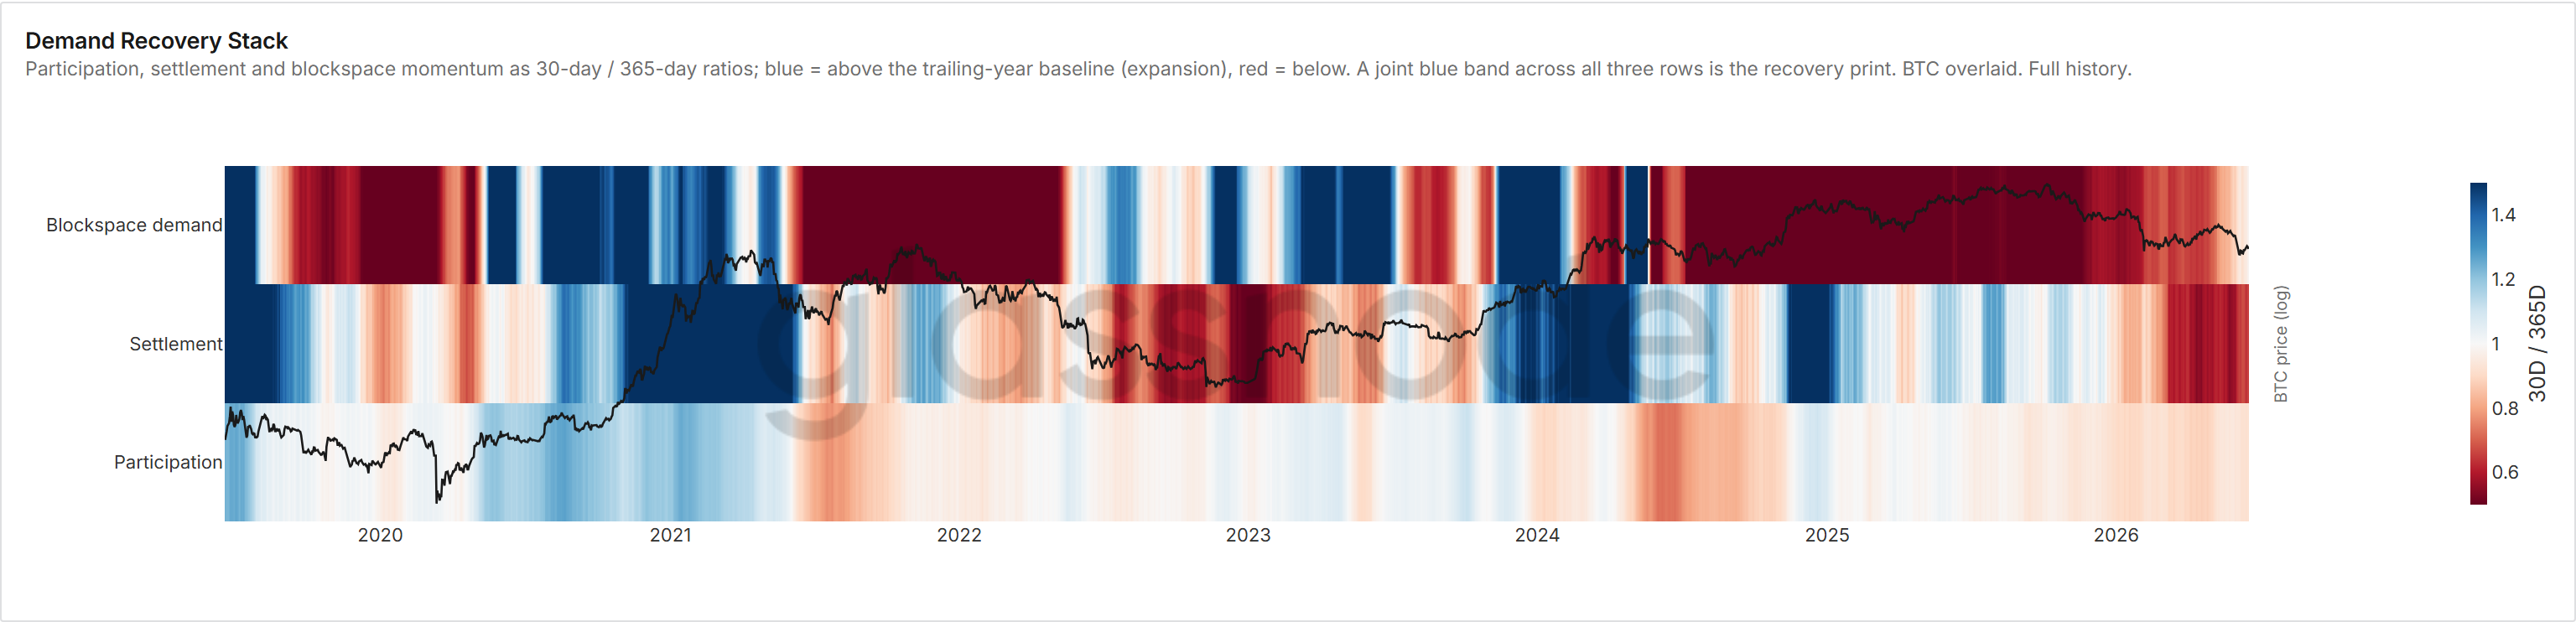
A joint blue band across all three rows of the stack is the recovery print; today blockspace is warm but the trend is cooling while participation and valuation lag. Price is being repriced higher faster than the network is recovering, and fee momentum clearing 1.0 is what would confirm the economy is catching up.

Cycle Position

The standalone lenses describe structure rather than feeding the headline. Cycle Position places the market on its clock, from Capitulation to Euphoria, using profitability and holder conviction rather than price alone. It reads 18, Capitulation, down from 36 a month ago.

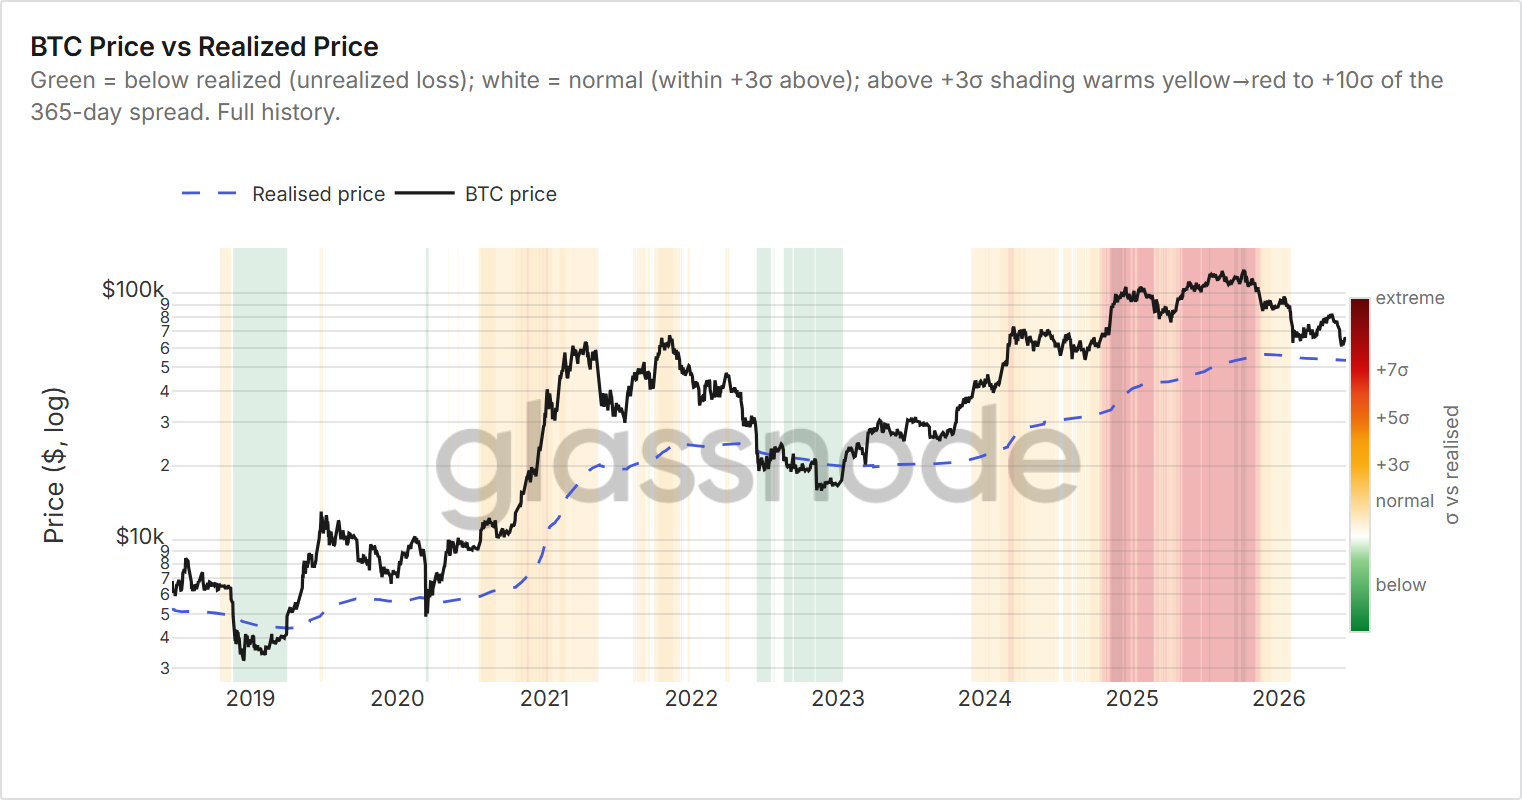
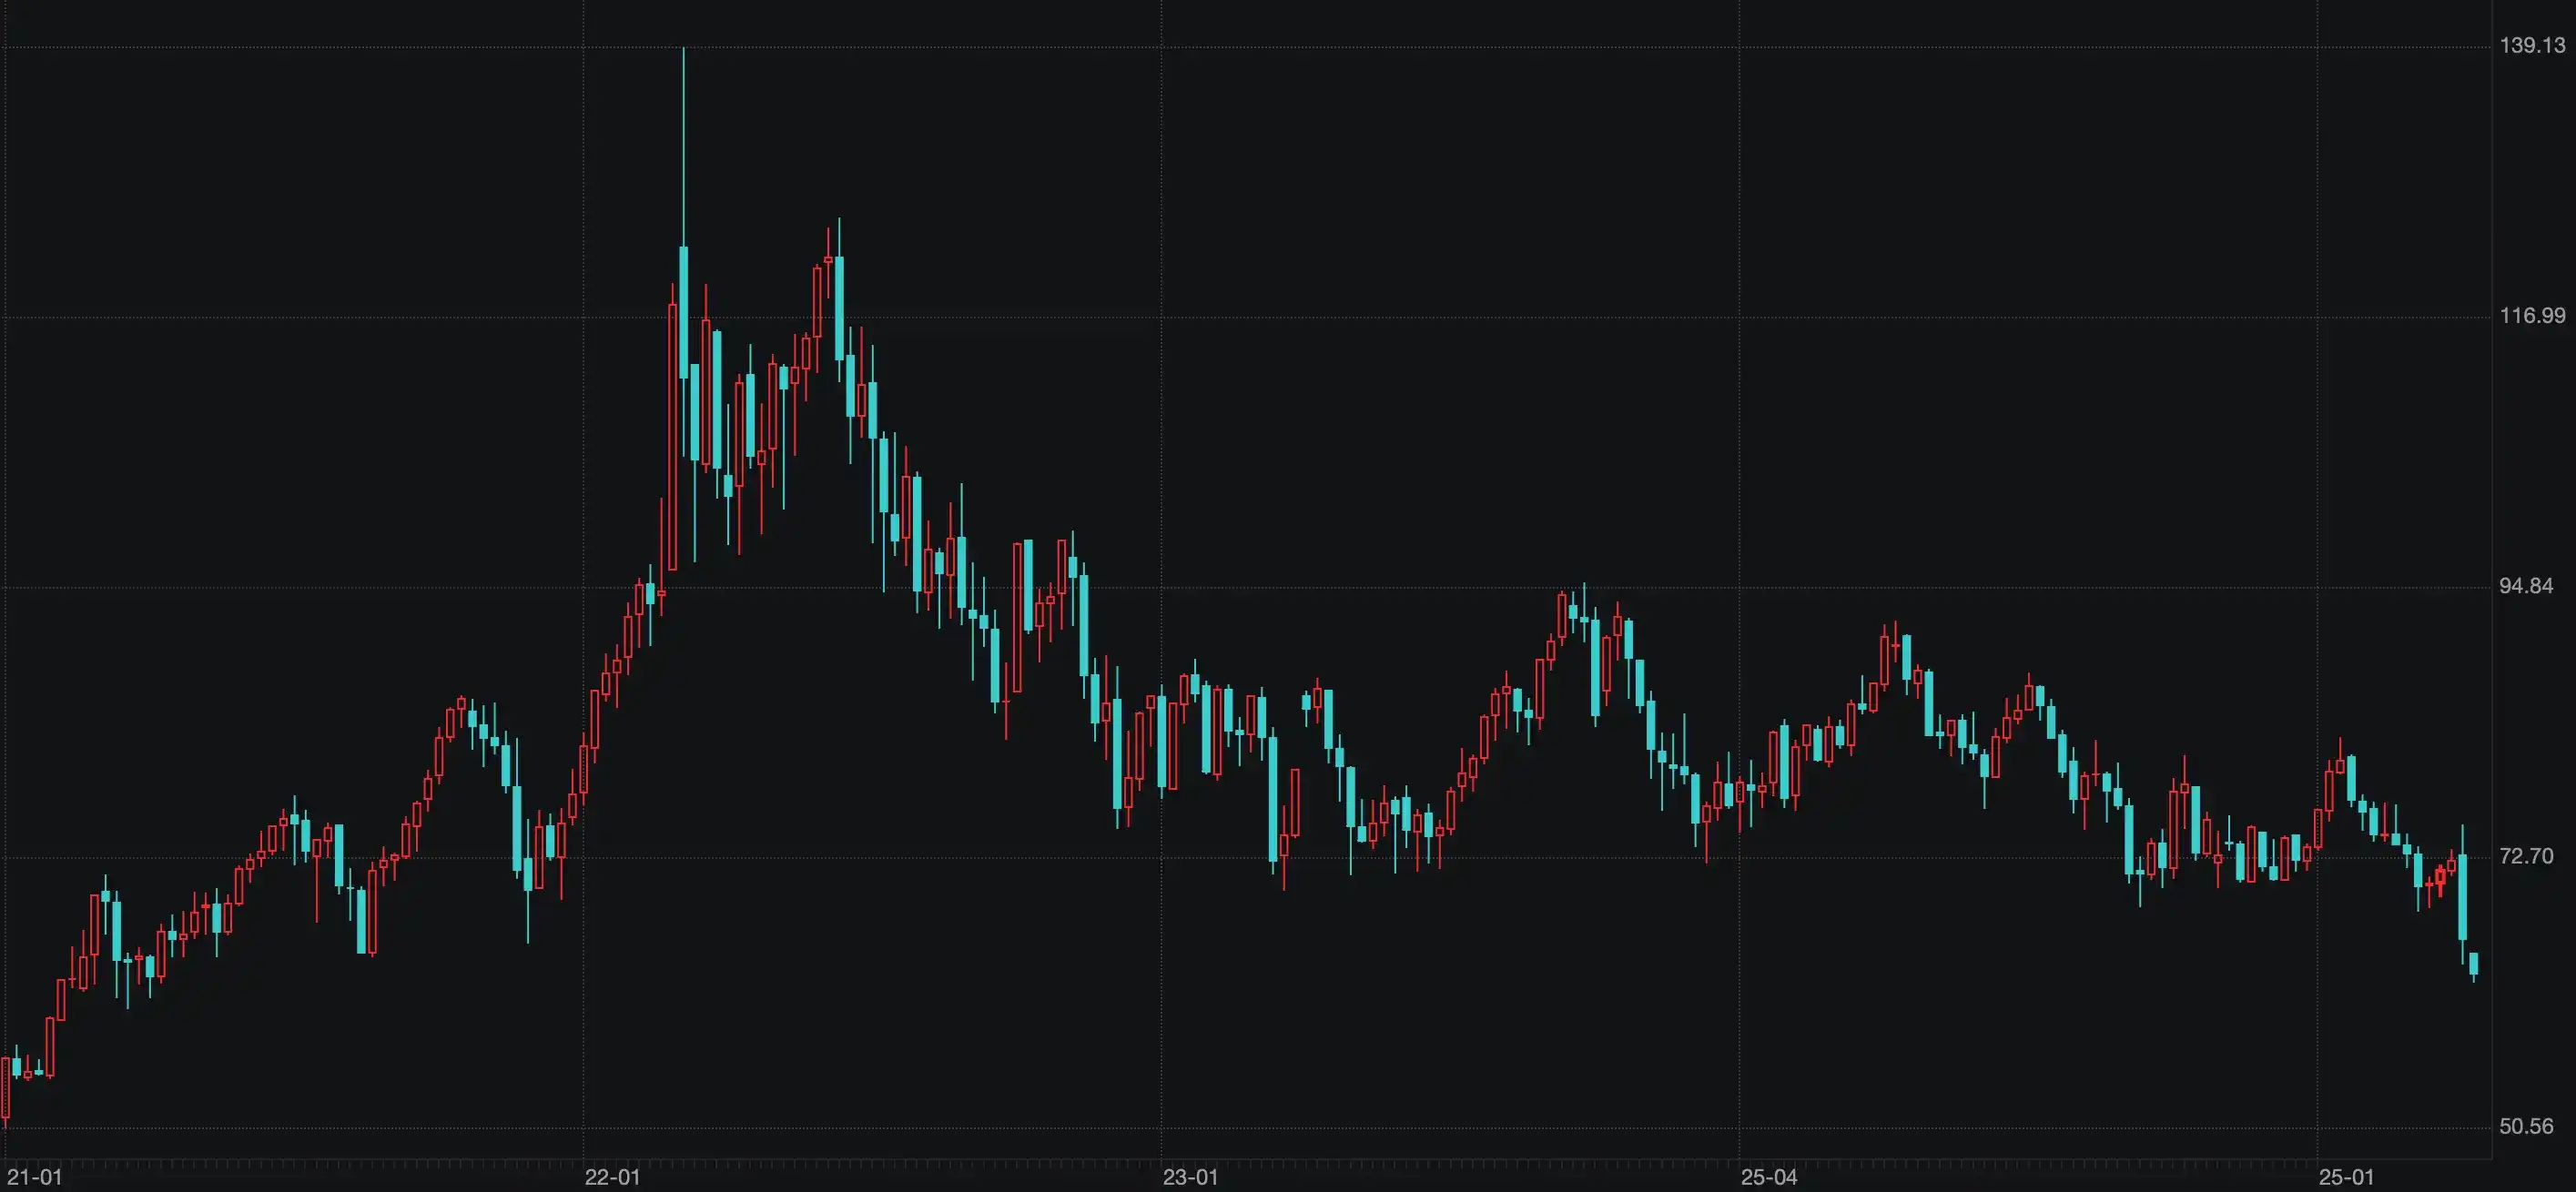
A Realized Profit/Loss Ratio at a fresh cycle low is what dragged the lens into the Capitulation band. Yet spot near $64,400 still trades well above the Realized Price around $53,500, and the chart's shading has cooled from the deep red of late 2025 back toward neutral. The stress shows up in realized-loss flows while spot holds above cost basis, which reads as a liquidity-led bounce rather than a true value bottom.

Derivatives

Derivatives measures leverage and froth: open interest against market size, the cost of carrying a perpetual, and the futures term structure. It reads 43, Light, a coiled and well-hedged book. Funding is negative, so shorts pay to stay short, and BTC implied volatility has compressed below 40, both ingredients of a squeeze.

BTC and ETH option-implied volatility, crypto's VIX. BTC DVOL has compressed below 40.

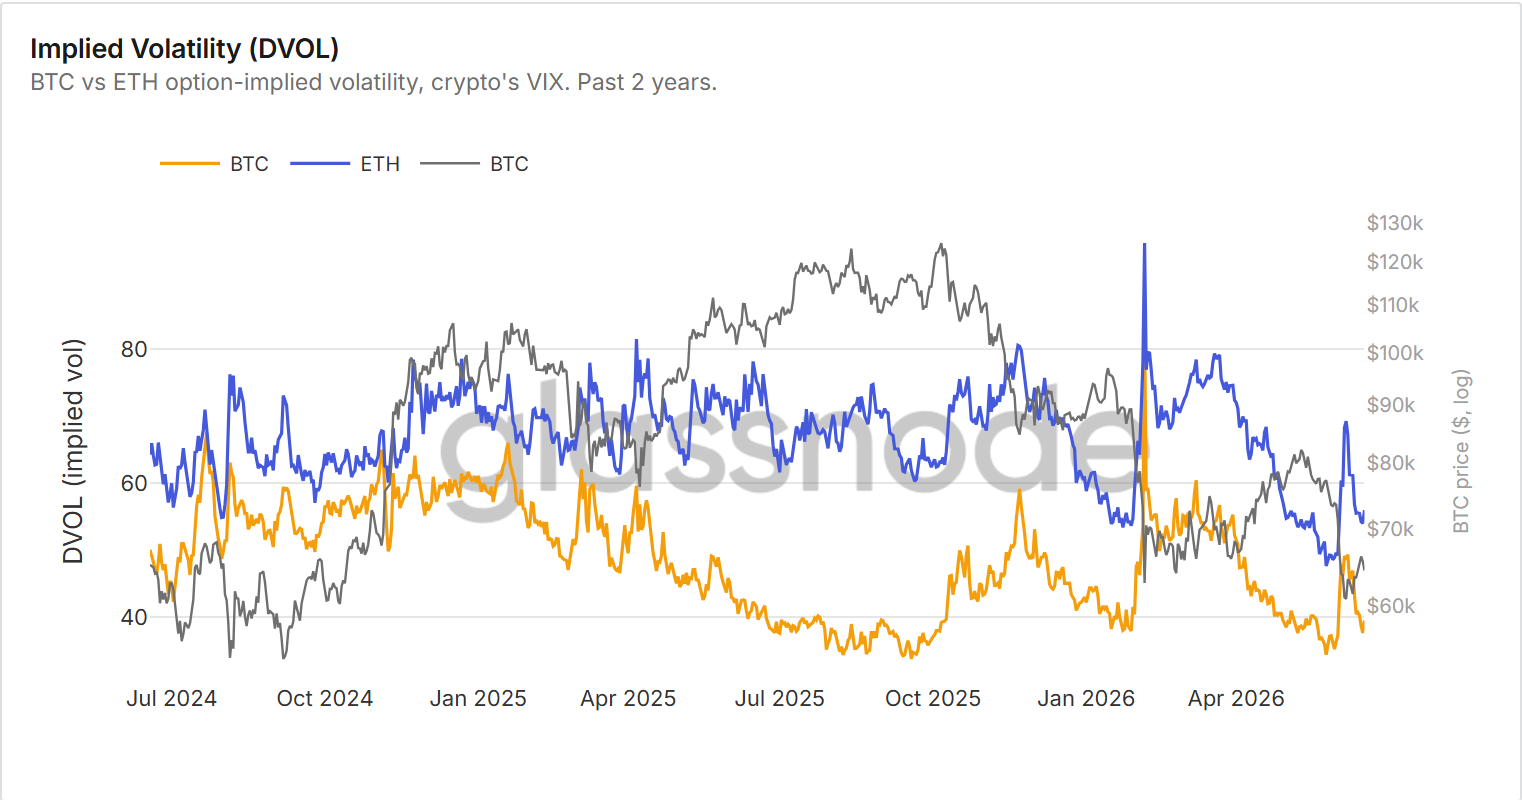
The catch is that 25-delta skew is positive across every tenor, so the same desks are paying for downside protection. Positioning is coiled, not committed, and a DVOL break below 35 or back above 40 will show which way the spring releases.

Cross-Asset Rotation

Rotation reads capital moving between Bitcoin and everything else, from BTC Season to Altseason. It is the loudest reading on the board at 70, Alt-led, with the Altcoin Season Index at 87.5. That sounds like risk appetite.

Median 90-day cumulative return by sector, rebased to zero. Every tracked sector is deeply negative.

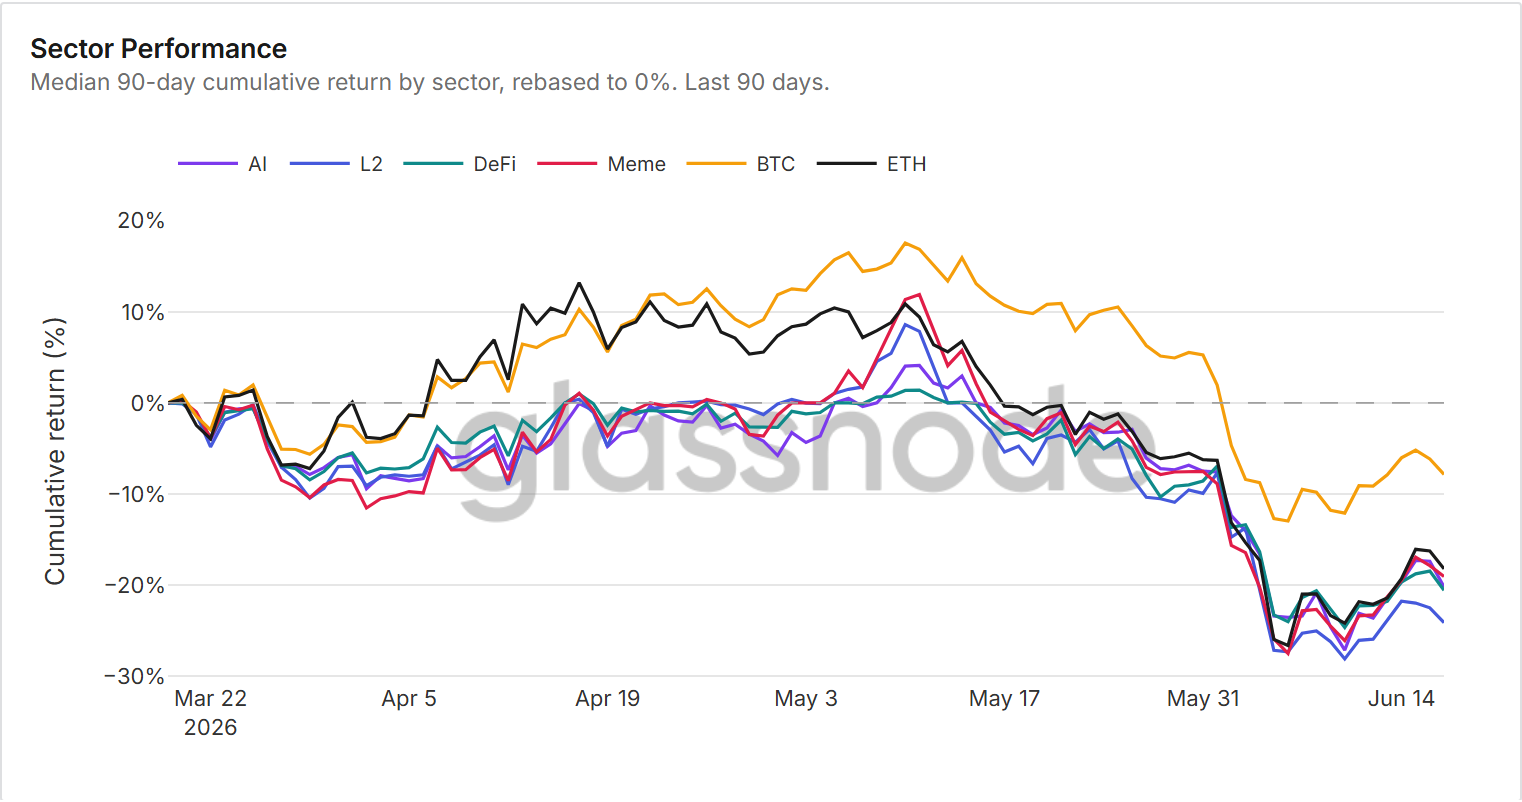
The sector chart says otherwise: every tracked sector is down 19% to 24% over 90 days. What the index captures is outperformance by falling less, with large-cap alts down 14% on the month against Bitcoin's 16%. It marks dispersion and a relative cushion rather than a fresh bid, and because the index measures relative performance on a rolling 90-day window, the spring alt run aging out of the lookback sets up a mechanical fade even if nothing else changes.

Putting it together

Top to bottom, the Compass tells a story no single metric would. The composite at 14 is held down by Macro, and Macro is held down by a dollar trading above trend. Underneath, the forward-looking lenses are repairing as the drawdown pushes coins into stronger hands. The standalone lenses fill in the texture: a cycle washing out in flows but not valuation, a derivatives book coiled and hedged, and a rotation read that looks bullish until you notice everything is down. The honest read is bottom-fishing inside a regime that has not turned, and the one move that would turn it, a dollar back below its 200-day average, has not come.

That is the case for reading the whole board at once instead of one chart at a time.

Now live for Glassnode Advanced and Professional users, with the data refreshed daily and the written summary refreshed by our analyst team each week.

Explore the Market Compass

  • Follow us on X for timely market updates and analysis
  • Join our Telegram channel
  • For on-chain metrics, dashboards, and alerts, visit Glassnode Studio

Related Questions

QWhat is the primary purpose of the Glassnode Market Compass and what problem does it aim to solve?

AThe primary purpose of the Glassnode Market Compass is to provide a consolidated, coherent market read by synthesizing numerous complex on-chain and market indicators. It solves the problem of information overload and analysis paralysis, as Glassnode's difficulty was never finding the right metric but knowing which of the thousands to trust and what they collectively indicate on any given day.

QWhat are the two distinct groups of lenses in the Market Compass, and how are they used differently?

AThe two groups are forward-looking lenses and standalone lenses. The four forward-looking lenses (Macro, Capital Flows & Liquidity, Investor Behaviour, On-Chain Fundamentals) are averaged into the composite headline score (Risk-Off to Risk-On) as they have a historical relationship with future price direction. The three standalone lenses (Cycle Position, Derivatives, Cross-Asset Rotation) describe the current market structure and environment but are purposely kept out of the headline score as they indicate current positioning rather than future direction.

QAccording to the article's current analysis, what is the single most important threshold needed for the market regime to turn, and has it been met?

AThe single most important threshold for the market regime to turn, according to the framework, is a close of the US Dollar Index (DXY) back below its 200-day average. As of the article's analysis, this has not happened, with DXY trading about 1.7% above its 200-day average.

QHow does the 'Cross-Asset Rotation' lens reaching a score of 70 ('Alt-led') align with the actual performance of altcoin sectors described in the article?

AThere is a contradiction. While the 'Cross-Asset Rotation' lens reads a high 70 ('Alt-led'), indicating altcoin season, the underlying sector chart shows every tracked altcoin sector is down 19% to 24% over 90 days. The high index score reflects relative outperformance (e.g., large-cap alts down 14% vs. Bitcoin's 16% in a month), meaning they are falling less, not that there is fresh buying interest. It signals dispersion and a relative cushion, not a bullish altcoin bid.

QWhat is the 'honest read' or overall conclusion the Compass provides about the current Bitcoin market state as of the article's publication?

AThe honest read is that the market is in a phase of 'bottom-fishing inside a regime that has not turned.' The composite score is a deep Risk-Off 14, held down primarily by a strong US Dollar (Macro lens). While the forward-looking lenses show internal repair (e.g., coins moving to stronger hands), the standalone lenses reveal a cycle washing out in flows but not valuation, coiled derivatives positioning, and misleadingly strong rotation metrics. The overall regime remains defensive, awaiting a key catalyst (DXY dropping below its 200-day average) to signal a turn.

Related Reads

The Entire Internet Hails Noam's Joining, But OpenAI's Loss Bill Just Got Thicker

While the AI community celebrates Noam Shazeer, co-author of the "Attention Is All You Need" paper, joining OpenAI as Head of Architectural Research, the company's audited financials reveal a starkly different reality. In 2025, OpenAI reported $13.07 billion in revenue but a massive $20.92 billion operating loss. Even excluding a one-time accounting charge, the cash burn is severe, with $3.7 billion consumed in Q1 2026 alone. This high-profile hiring occurs against a backdrop of significant internal research talent drain, with key founders and researchers departing as the company's focus shifts from exploratory research to product iteration. Meanwhile, OpenAI's fundamental business model faces a deep crisis. It paid Microsoft $10.59 billion for compute in 2025, while its vast user base of 9 billion weekly actives includes only 50 million paying customers, making growth a direct driver of escalating costs. The article argues Shazeer's recruitment is less about technical necessity and more about crafting a compelling narrative for OpenAI's upcoming IPO, aiming to justify a rumored $1 trillion valuation to future public market investors. It contrasts OpenAI's strategy with Anthropic's reported path to profitability, which relies on a strong enterprise customer base and cost control, rather than star-powered narratives. Ultimately, the piece concludes that while Shazeer's architectural work may take 1-2 years to materialize, OpenAI's financial clock is ticking much faster, with its massive losses undercutting the celebratory headlines.

marsbit34m ago

The Entire Internet Hails Noam's Joining, But OpenAI's Loss Bill Just Got Thicker

marsbit34m ago

Market Trend (June 19): US-Iran Deal Drives Out Geopolitical Premium; Chip Stocks Soar to New Highs; Energy Sector Leads Declines

U.S. Market Trends (June 19): U.S.-Iran Deal Eases Tensions, Chip Stocks Soar, Energy Sector Leads Declines. U.S. stocks rallied on Thursday as the signing of a temporary U.S.-Iran deal in Geneva de-escalated Middle East tensions, with Saudi oil tankers transiting the Strait of Hormuz. This geopolitical relief helped markets recover from recent Fed-driven volatility. The S&P 500 rose over 1%, the Nasdaq gained nearly 2%, and the Dow Jones Industrial Average closed at another record high. The Philadelphia Semiconductor Index surged over 6% to a historic peak. Chip stocks were the standout performers. Reports of an Apple-Intel design and foundry deal for certain products, alongside mentions of potential Nvidia and SpaceX collaborations with Intel, propelled the sector. Intel surged ~10.5%, while memory chip makers like Micron also saw significant gains, highlighting sustained confidence in long-term AI capital expenditure. In contrast, the energy sector was the day's sole loser, with the S&P 500 energy sub-index declining as WTI crude fell ~2% to around $74.29/barrel. The reopening of key shipping routes erased prior geopolitical risk premiums. SpaceX extended losses for a second day on news of a potential large bond offering. Market volatility (VIX) dropped sharply, indicating a swift reversal of post-Fed jitters. Treasury yields dipped slightly but remained elevated. The focus now shifts to upcoming economic data, including next week's PCE inflation report and Micron's earnings, which will serve as a key test for the AI trade's durability.

marsbit56m ago

Market Trend (June 19): US-Iran Deal Drives Out Geopolitical Premium; Chip Stocks Soar to New Highs; Energy Sector Leads Declines

marsbit56m ago

Will MicroStrategy Fall Into a Death Spiral? How Will the Macro Outlook Evolve in the Second Half of the Year?

**Summary:** The discussion centers on recent Bitcoin price declines and the evolving financial strategy of MicroStrategy (MSTR). The core argument is that the primary pressure is not from one-off Bitcoin sales by MSTR, but from the market's new expectation that MSTR may need to engage in *sustained, small-scale* Bitcoin sales to cover cash flow obligations for its growing portfolio of preferred shares and debt instruments (like STRC). This shift is driven by its stated goal of maintaining "bitcoins per share neutrality." The market is now testing whether it can absorb this potential ongoing selling pressure without entering a severe "death spiral" with Bitcoin's price. A resolution may involve MSTR softening its approach to avoid damaging both its stock and Bitcoin. The conversation then explores the parallel rise of AI-related stocks. The guest posits that AI is fundamentally restructuring labor, with "tokens" (representing access to AI models/compute) becoming a new form of capital and a substitute for human execution. This drives corporate efficiency and profits, benefiting upstream hardware providers (semiconductors, data centers), which explains the sustained rally. This represents the early stages of a "machine economy." Regarding crypto exchanges offering US stock trading, this is seen as a natural evolution. With few crypto-native assets generating lasting value, exchanges are pivoting to distribute valuable real-world assets (RWAs). This doesn't necessarily harm crypto's long-term prospects, as blockchain infrastructure may become crucial for future machine-to-machine economies. The analysis concludes that the era of rampant altcoin speculation is likely over, heavily damaged by the liquidity shock of the "1011" event (likely referring to a major market crash). Meme-driven capital has largely migrated to US equities. Looking ahead, macroeconomic uncertainty is rising due to potential large IPOs (e.g., SpaceX) and the US elections. While short-term market corrections are possible, the long-term trends of AI-driven productivity gains and the maturation of blockchain towards real-world utility and institutional adoption remain intact.

marsbit1h ago

Will MicroStrategy Fall Into a Death Spiral? How Will the Macro Outlook Evolve in the Second Half of the Year?

marsbit1h ago

Trading

Spot
Futures
活动图片