Source: Wall Street News
The tech momentum trade is experiencing its most severe unwinding in history. In just 17 trading days, the U.S. stock tech momentum factor (TMT MoMo) has plummeted 40% from its peak, setting a record for the fastest and deepest pullback ever, with effects rippling through semiconductors, hedge funds, and credit markets.
Mark Wilson, Goldman Sachs partner and head of EMEA Hedge Fund Business, provided a systematic review of this "brutal rotation" this week, noting that the speed and depth of this sell-off are historically rare. However, its root cause lies more in non-fundamental factors such as crowded positioning and concentrated leverage, rather than a substantial deterioration in the economy or corporate earnings. He stated that the unwinding process for the momentum factor is "nearing its end," but lacks an immediate catalyst for reversal in the short term.
Notably, this momentum collapse occurred against a backdrop of overall solid macro and corporate fundamentals. U.S. banks reported corporate loan growth of 17% year-over-year, TSMC raised its 2026 revenue growth guidance to over 40%, and inflation data also came in moderately below expectations. The divergence between this fundamental strength and market price action is precisely the core contradiction in the current market.
Tech Momentum Factor Hit by Sharpest Ever Sell-Off, Pullback Speed and Depth Exceed Historical Median
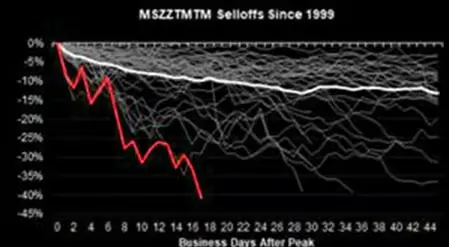
According to Morgan Stanley's Quantitative and Derivatives Strategy (MS QDS) team data, this momentum factor pullback has lasted 17 trading days, with a peak-to-trough decline of 28%. In comparison, the median momentum factor pullback since 1999 has been 22%, lasting an average of 33 trading days.
This means the current decline has exceeded the historical median in both speed and depth, representing the most severe pullback since the 29% decline between December 2022 and February 2023.
The situation in the tech sector is even more extreme. The TMT momentum factor (TMT MoMo) has fallen 40% from its peak. According to MS QDS data, this is the fastest and deepest sell-off ever recorded for the tech momentum factor.
Looking at specific sectors: the Korea Composite Stock Price Index (Kospi) is down 27% from its peak, U.S. AI tech beneficiaries are down 25%, global memory chip stocks are down 36%, and European semiconductors are down 23%. Memory chip stocks account for about two-thirds of the overall decline, while broader AI beneficiary stocks are down about 24% from their highs.
Low Surface Volatility Masks High Internal Intensity, Market Risk Structure Unraveling
Price decline is only the surface manifestation of this turmoil; changes in the market's internal risk structure are equally striking.
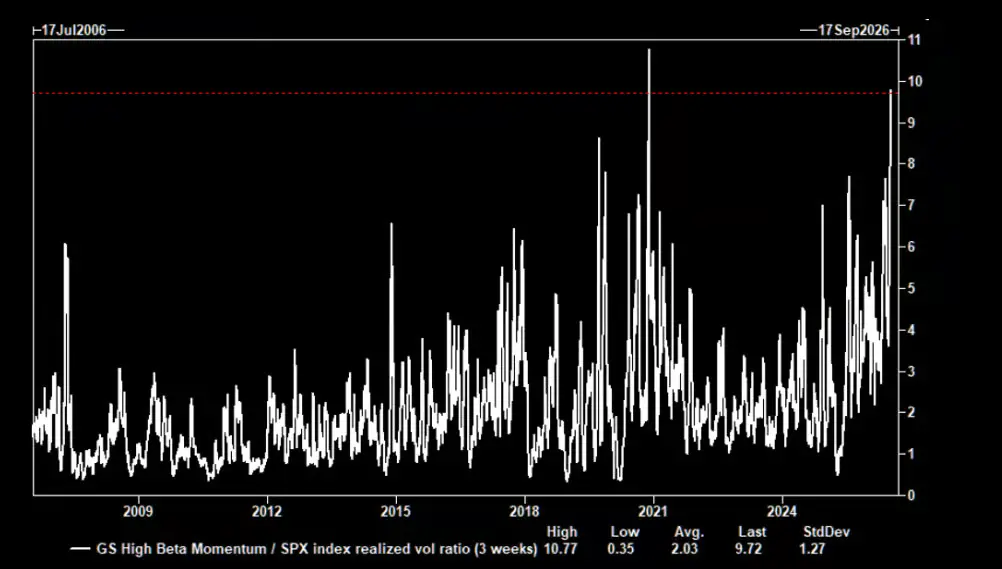
According to Goldman Sachs' Volatility Trading Desk data, the volatility of Goldman Sachs' High Beta Momentum portfolio (GSPRHIMO) is currently about 10 times that of the S&P 500 index. In historical backtests over the past 20 years, such a disparity in volatility ratios has only been comparable to the period of pandemic shock in November 2020.
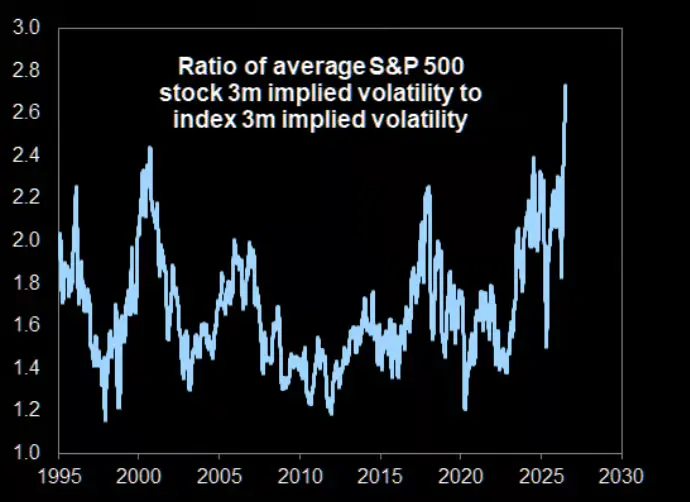
Simultaneously, the gap between single-stock volatility and index volatility has widened to historical extremes. Goldman Sachs data shows that the 3-month implied average correlation among S&P 500 components dropped to a record low of 0.14 this week. This has kept S&P 500 index volatility low, while the average implied volatility for single stocks is as high as 40%, 2.8 times the index's implied volatility, also setting a historical record.
Positioning Remains Crowded, Risk Not Yet Fully Cleared
Despite the recent historic pullback in the momentum factor, hedge funds' net exposure to it remains elevated from a long-term perspective. J.P. Morgan data indicates that the current combination of positioning levels and the magnitude of the pullback continues to position the momentum factor as one of the most concerning core risks in the market.
At the same time, Mark Wilson also noted that Goldman Sachs' High Beta Momentum factor has fallen 33% from its June high, with its year-to-date gain plummeting from 60% to just 12%.
He cited signs of deleveraging in the Korean market as evidence: reports indicated that roughly 1 in 30 Korean adults had their stock margin accounts forcibly liquidated this week, suggesting the deleveraging process is already significantly underway.
Fundamentals Intact, Risk Lies in Positioning and Structure
The unique aspect of this momentum collapse is that it occurred against a backdrop of generally positive corporate fundamentals and macro data.
Mark Wilson pointed out that U.S. bank earnings this week presented an "unmistakably positive read" on economic conditions: corporate loans grew 17% year-over-year, a record high, covering all economic sectors; U.S. consumer spending tracked mid-single-digit growth, with credit card spending up 6%; investment banking-related business lines collectively grew over 40%; and large banks' return on tangible common equity reached 19%, the highest since the financial crisis.
In terms of tech capital expenditure, TSMC raised its 2026 revenue growth guidance to over 40% (based on a revenue base exceeding $150 billion), while ASML's earnings sparked expectations of a 15% to 30% upward revision in its earnings per share over the next one to three years.
However, both companies' stock prices fell following their earnings announcements, displaying a typical "sell the news" pattern. In contrast, IBM's stock price suffered its largest single-day drop in over 20 years due to delays in large contracts and underperformance in its consulting business.
Mark Wilson emphasized that it is "difficult to find a clear fundamental signal" for this sell-off, reflecting more on structural factors such as positioning, leverage, crowding, and concentration.
Rotation Nearing End, But Reversal Catalysts Yet to Emerge
Mark Wilson stated that he leans towards the view that the unwinding process for the momentum factor is nearing its end, but also noted a lack of immediate summer catalysts that could drive a market reversal in the short term.
He also suggested that as efficiency and commercial viability improve, new market leadership will gradually emerge, leading to broader market participation—the Dow Jones Transportation Average breaking to new highs again this week serves as one example.
However, he also warned that the second derivative of earnings growth (i.e., the slowdown in the growth rate) will become increasingly important as the market digests Q2 earnings and moves into summer. Meanwhile, various valuation metrics indicate that tech sector valuations remain elevated.
Furthermore, correlations are breaking down abnormally both between and within traditional asset classes. For instance, the 3-month correlation between gold and crude oil has fallen to extreme inverse levels in its 35-year history, further increasing the difficulty of risk management and portfolio construction.