A Major Bitcoin Pivot? Realized Loss Drops Below The Key Threshold – Here’s What It Means

bitcoinistPublished on 2025-12-12Last updated on 2025-12-12

Abstract

Bitcoin's price nears $90,000 amid renewed volatility, while key on-chain metrics suggest a potential shift in market sentiment. According to analyst Ali Martinez, the realized loss metric for BTC traders has dropped below the critical -37% threshold to -18%, indicating that panic selling may be subsiding. Historically, such declines have signaled buy-the-dip opportunities and a transition from capitulation to accumulation. However, recovery remains constrained by a lack of incoming liquidity. Stablecoin inflows into exchanges have fallen 50% since August, reflecting weakened demand. For a sustained bullish trend, new liquidity is essential—current minor rebounds are due to reduced selling pressure rather than increased buying interest.

As the market volatility heats up again, the price of Bitcoin witnessed a pullback, bringing it closer to the $90,000 threshold. While BTC’s price faces a pullback, key on-chain metrics are beginning to follow suit, reaching levels that could shape or determine the next trajectory of the market.

A Crucial Breakdown In Bitcoin Realized Loss

Given the bearish state of the market, on-chain indicators for Bitcoin are flashing a slight but crucial signal in its dynamics. BTC On-Chain Trader Realized Price and Profit/Loss Margin, one of the most important metrics, has now dropped below a crucial level as the market and BTC’s price fluctuate.

According to Ali Martinez, a seasoned crypto analyst and trader, this drop in the metric is offering a clue to the next potential path for the BTC market. Following weeks of increased capitulation-driven losses, the drop in realized losses indicates that market players are no longer selling coins at sharp discounts.

While the wave of panic selling that clouded recent market turbulence may finally be dissipating, this crucial indicator is providing traders with new grounds to reevaluate the short-term course of Bitcoin. This implies that sentiment is gradually stabilizing, pointing to an early shift from capitulation to accumulation.

Source: Chart from Ali Martinez on X

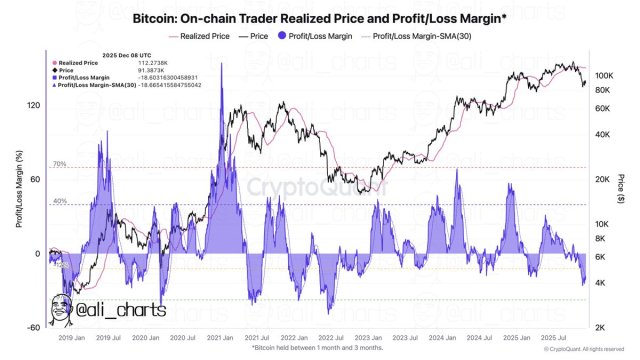
In the post, Ali Martinez highlighted that the metric has fallen below the critical -37%, now located at -18%. The drop may appear increasingly negative, but it is hinting at a pivotal junction for the broader Bitcoin market.

Historically, this drop in the metric below this level has led to a rebound in investors’ confidence in the market. Martinez claims that some of the best buy-the-dip opportunities have emerged when Bitcoin on-chain traders’ realized loss falls below -37%.

BTC’s Rebound Requires Fresh Liquidity

Since the sharp pullback from its all-time high, Bitcoin has failed to bounce back strongly. Darkfost, a market and author at CryptoQuant, claims that one of the major reasons why BTC is currently struggling to recover is the absence of incoming liquidity. This is the biggest issue in the market now.

Liquidity here refers solely to stablecoins. According to Darkfost, monitoring these flows makes it easier to assess if new liquidity is poised to enter the market or if it is still lacking. Data shows that since August, stablecoin inflows into exchanges have steadily declined from 158 billion to around $76 billion.

This sharp drop represents a 50% decrease in incoming liquidity. Additionally, the 90-day average has dropped, from $130 billion in stablecoin inflows to $118 billion. A drop in liquidity suggests that Bitcoin is battling with a decline in demand, which has not been strong enough to absorb the selling pressure impacting the market.

Presently, the trend is still negative, and the minor rebounds observed are primarily a consequence of reduced selling pressure rather than more purchasing demand. For BTC to regain a genuine bullish trend, Darkfost stated that the key rests on new liquidity entering the market.

BTC trading at $92,397 on the 1D chart | Source: BTCUSDT on Tradingview.com

Related Reads

The Silver Crisis: When the Paper System Begins to Fail

Silver Crisis: When the Paper System Begins to Fail In December, silver became the standout performer in the precious metals market, surging from $40 to over $60 per ounce, hitting a historic high of $64.28 on December 12 before experiencing sharp declines. Year-to-date, silver rose nearly 110%, far outpacing gold’s 60% gain. The rally appears justified by fundamental factors: expectations of Fed rate cuts, strong industrial demand from solar, EV, and AI sectors, and declining global inventories. However, the surge lacks stability. Unlike gold, which is backed by central bank purchases, silver has almost no official reserves, making it an isolated asset with low market depth and high volatility. The real driver behind the price spike is a futures squeeze. The market structure shifted into prolonged futures premium (contango), indicating either extreme bullish sentiment or deliberate market manipulation. Physical delivery demands surged on exchanges like COMEX and LBMA, exposing the fragility of the paper silver system—where paper claims vastly exceed actual physical silver. JPMorgan, a key player historically accused of silver market manipulation, now controls nearly 43% of COMEX silver inventories and acts as the custodian for major silver ETFs. Its influence over physical supply and delivery eligibility adds to market instability. The situation reflects a broader loss of confidence in financialized assets. Investors and central banks are increasingly shifting toward physical holdings, moving away from paper claims. This trend, coupled with declining Western gold and silver inventories and rising Asian demand, signals a structural shift in monetary and commodity markets. In essence, the rules of the game are changing. When the music stops, those holding physical metal will have a chair—everyone else may be left standing.

marsbit1h ago

The Silver Crisis: When the Paper System Begins to Fail

marsbit1h ago

Trading

Spot
Futures
活动图片