Bitcoin Approaches Its 4-Year SMA On This Key Market Metric – Here’s What To Know

bitcoinistPublished on 2026-02-17Last updated on 2026-02-17

Abstract

Bitcoin's price remains below $70,000, with analysts warning of a potential bear market as key metrics signal a continued correction. A critical indicator, the Bitcoin Daily Price Analysis with SMA Multiplier, shows BTC approaching its 4-year Simple Moving Average (SMA) near $57,500. Historically, this level has marked the final stage of bear markets, where Bitcoin becomes undervalued. Analysts note that the closer the price gets to this SMA, the more likely a structural bottom may form. However, current market behavior shows persistent selling pressure, keeping the cryptocurrency at a decisive point between long-term support and further downside.

With the price of Bitcoin stuck below the $70,000 mark, analysts are beginning to flag this current performance as an indication of a bear market. After several weeks of downward pressure, many key metrics are beginning to flash signs of a continued correction phase, reinforcing the idea of a bear market scenario.

Key Bitcoin Metric Drifts Toward Its 4-Year SMA

Given the recent signals from multiple Bitcoin key market metrics, the ongoing BTC downward action does not seem to have come to an end yet. Currently, a particular metric indicates that the flagship asset is nearing a historically significant threshold, akin to a bear market phase.

This signal is emerging from the Bitcoin Daily Price Analysis with SMA Multiplier, built around moving averages and multiples, as reported by Darkfost, a data analyst and author at CryptoQuant. Recent data shows that Bitcoin has shifted back into the green zone on the chart and is approaching its 4-year SMA, which is currently positioned around the $57,500 price level.

The higher the standard deviation, and, consequently, the multiple of the SMA, the more overbought Bitcoin seems. However, the expert highlighted that the closer the price gets to the 4-year SMA, the more undervalued the price of BTC becomes. To make these stages easier to comprehend, a color scale is used to illustrate all of this.

BTC nearly historic key zone | Source: Chart from Darkfost on X

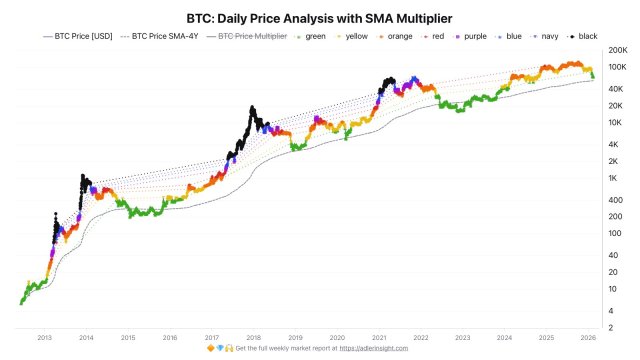
In the past, this level has typically served as a reliable signal for the final stage of each bear market, with the flagship asset trading around these levels for several months. According to data on the chart, the market is nearing a bear market level, and Darkfost finds this current trend an interesting one that demands the market’s attention.

With Bitcoin edging closer to this level, focus is shifting to whether history will repeat itself or if a new cycle dynamic will kick in. For now, the cryptocurrency remains at a decision point that illustrates the mounting tension between persistent weakness and long-term valuation support.

Has BTC’s Price Reached A Bottom Yet?

As discussions about Bitcoin’s price bottom mount, Joao Wedson has provided insights into the situation using the BTC Long-Term Holder Realized Price Bands. Historically, the major bottoms have occurred when the price hits the -0.2 standard deviation levels of this key metric.

Wedson noted that this point is marked by classic capitulation phases and the final opportunity to buy the crypto king before a new bull market takes off. However, during the weekend, the behavior was different. A view into the chart shows that the price is unable to maintain moves above the +1 standard deviation, which suggests continued and aggressive sell activity from bears in these regions.

Currently, these bands are acting as natural support and resistance zones throughout market cycles. The likelihood of a structural bottom emerging rises sharply when the price gets closer to extremely negative values. Meanwhile, data is revealing the areas with the highest risk and the emergence of asymmetry.

BTC trading at $68,639 on the 1D chart | Source: BTCUSDT on Tradingview.com

Related Questions

QWhat key Bitcoin metric is approaching its 4-year Simple Moving Average (SMA) according to the article?

AThe Bitcoin Daily Price Analysis with SMA Multiplier metric is approaching its 4-year SMA, which is currently around the $57,500 price level.

QAccording to analyst Darkfost, what does it signify when Bitcoin's price gets closer to its 4-year SMA?

ADarkfost highlighted that the closer Bitcoin's price gets to the 4-year SMA, the more undervalued the asset becomes. Historically, this level has served as a reliable signal for the final stage of a bear market.

QWhat is the significance of the -0.2 standard deviation level on the BTC Long-Term Holder Realized Price Bands, as mentioned by Joao Wedson?

AAccording to Joao Wedson, major price bottoms have historically occurred when Bitcoin's price hits the -0.2 standard deviation levels of the Long-Term Holder Realized Price Bands, which is marked by capitulation phases and is considered the final opportunity to buy before a new bull market.

QWhat does the article suggest about the current market's ability to sustain price moves above the +1 standard deviation level?

AThe article states that the price has been unable to maintain moves above the +1 standard deviation level, which suggests continued and aggressive sell activity from bears in these regions.

QWhat are the two potential outcomes the article mentions as Bitcoin edges closer to its 4-year SMA?

AThe article states that focus is shifting to whether history will repeat itself (indicating a bear market bottom) or if a new cycle dynamic will kick in, leaving the cryptocurrency at a decision point between persistent weakness and long-term valuation support.

Related Reads

Assembling the Most Accurate Gold Forecasters in History, Can We Crack the Future Price of Gold?

The article investigates whether compiling the most accurate historical predictions from top analysts, institutions, and influencers can unlock a reliable method for forecasting future gold prices. Using gold as a case study, it examines predictions from sources like the LBMA, Goldman Sachs, JPMorgan, prominent figures like Peter Schiff and Jim Rickards, and celebrated forecasters such as Nouriel Roubini and Ben McMillan. The findings reveal significant inconsistencies. Major institutions often exhibit "lagging predictions," adjusting forecasts too slowly to match rapid market moves—for instance, LBMA’s 2025 consensus underestimated the actual average price by 20%. Influencers like Schiff and Rickards persistently advocate for higher long-term targets (e.g., $5,000 to $35,000) but their predictions lack precise timing, often requiring investors to endure prolonged periods of underperformance. Even "accurate" forecasters like Roubini and McMillan have mixed records, with notable misses alongside their successes, while Ray Dalio’s broad allocation advice (5-15% gold) proves more practical than specific price targets. The analysis notes eerie similarities between the 2011 gold peak—where extreme predictions clustered near the market top—and the 2026 crash, where many experts maintained bullish outlooks despite a 25% plunge. Current predictions for future prices vary wildly, from $5,400 to $35,000, highlighting a lack of consensus. The conclusion is that no consistently accurate predictor exists. The author argues that gold forecasting is inherently uncertain, dominated by occasional lucky calls rather than reliable expertise, and advocates for a diversified, long-term investment approach over chasing speculative forecasts.

marsbit26m ago

Assembling the Most Accurate Gold Forecasters in History, Can We Crack the Future Price of Gold?

marsbit26m ago

175-Year-Old Western Union: Not Just Playing with Stablecoins, but Also Acquired a Digital Wallet

At 175 years old, Western Union, the global money transfer giant, is undergoing a significant digital shift. After a failed 2018 experiment with Ripple's XRP due to high costs, the company is now aggressively embracing blockchain and digital assets. In April 2026, Western Union acquired Singapore-based digital wallet Dash from Singtel, marking its first digital wallet asset in the Asia-Pacific region. Dash, with 1.4 million users, offers a full suite of services including payments, remittances, savings, insurance, and investments, deeply integrated into Singapore's local life. This move is part of a broader strategy to modernize its legacy business. While Western Union's vast network of over 500,000 physical agent locations remains its backbone, it is also its biggest cost burden. The company faces intense competition from digital-native rivals like Wise and Remitly, which offer significantly lower fees. To compete, Western Union is building a "Digital Asset Network." A key component is its own USD-pegged stablecoin, USDPT, issued on the Solana blockchain in partnership with Anchorage Digital. It is also piloting a stablecoin-linked Visa card with Rain for users in high-inflation countries like Argentina, allowing them to spend or cash out dollars at its agent locations. The acquisition of Dash represents a fundamental change: moving from being a transient "pipe" for money transfers to building a destination where users stay. Dash provides a trusted, established platform to test and deploy these new digital products, serving as a launchpad for Western Union's expansion across the Asia-Pacific region.

marsbit55m ago

175-Year-Old Western Union: Not Just Playing with Stablecoins, but Also Acquired a Digital Wallet

marsbit55m ago

Trading

Spot
Futures

Hot Articles

How to Buy 4

Welcome to HTX.com! We've made purchasing 4 (4) simple and convenient. Follow our step-by-step guide to embark on your crypto journey.Step 1: Create Your HTX AccountUse your email or phone number to sign up for a free account on HTX. Experience a hassle-free registration journey and unlock all features.Get My AccountStep 2: Go to Buy Crypto and Choose Your Payment MethodCredit/Debit Card: Use your Visa or Mastercard to buy 4 (4) instantly.Balance: Use funds from your HTX account balance to trade seamlessly.Third Parties: We've added popular payment methods such as Google Pay and Apple Pay to enhance convenience.P2P: Trade directly with other users on HTX.Over-the-Counter (OTC): We offer tailor-made services and competitive exchange rates for traders.Step 3: Store Your 4 (4)After purchasing your 4 (4), store it in your HTX account. Alternatively, you can send it elsewhere via blockchain transfer or use it to trade other cryptocurrencies.Step 4: Trade 4 (4)Easily trade 4 (4) on HTX's spot market. Simply access your account, select your trading pair, execute your trades, and monitor in real-time. We offer a user-friendly experience for both beginners and seasoned traders.

3.3k Total ViewsPublished 2025.10.20Updated 2025.10.29

How to Buy 4

Discussions

Welcome to the HTX Community. Here, you can stay informed about the latest platform developments and gain access to professional market insights. Users' opinions on the price of 4 (4) are presented below.

活动图片