Willy Woo's indicator signals Bitcoin activity may not support $17,000 price

CointelegraphPublished on 2022-12-23Last updated on 2022-12-23

Abstract

Data from on-chain analytics firm Glassnode confirms that on Dec. 21, Bitcoin’s network value to transaction (NVT) signal reached levels not seen since April.

Data from on-chain analytics firm Glassnode confirms that on Dec. 21, Bitcoin’s network value to transaction (NVT) signal reached levels not seen since April.

Bitcoin activity may not support $17,000 BTC price

Created by statistician Willy Woo, NVT essentially measures the ratio between on-chain activity and the price of Bitcoin.

NVT signal modifies its readings by using a 90-day moving average of daily transaction volume instead of raw data, something Glassnode says “improves” NVT and allows it “to better function as a leading indicator.”

On Dec. 21, the NVT signal hit 18.58, a level that last appeared as Bitcoin declined in the final days of April. At the time, BTC/USD traded at just over $40,000.

Fast forward to year-end, and NVT is flashing a warning. Despite Bitcoin being worth less than 50% of its April levels, network volume has declined to such an extent that even the current $16,800 valuation might not last.

As Woo explained in a description of NVT ratio on his analytics site:

“When Bitcoin’s NVT is high, it indicates that its network valuation is outstripping the value being transmitted on its payment network, this can happen when the network is in high growth and investors are valuing it as a high return investment, or alternatively when the price is in an unsustainable bubble.”

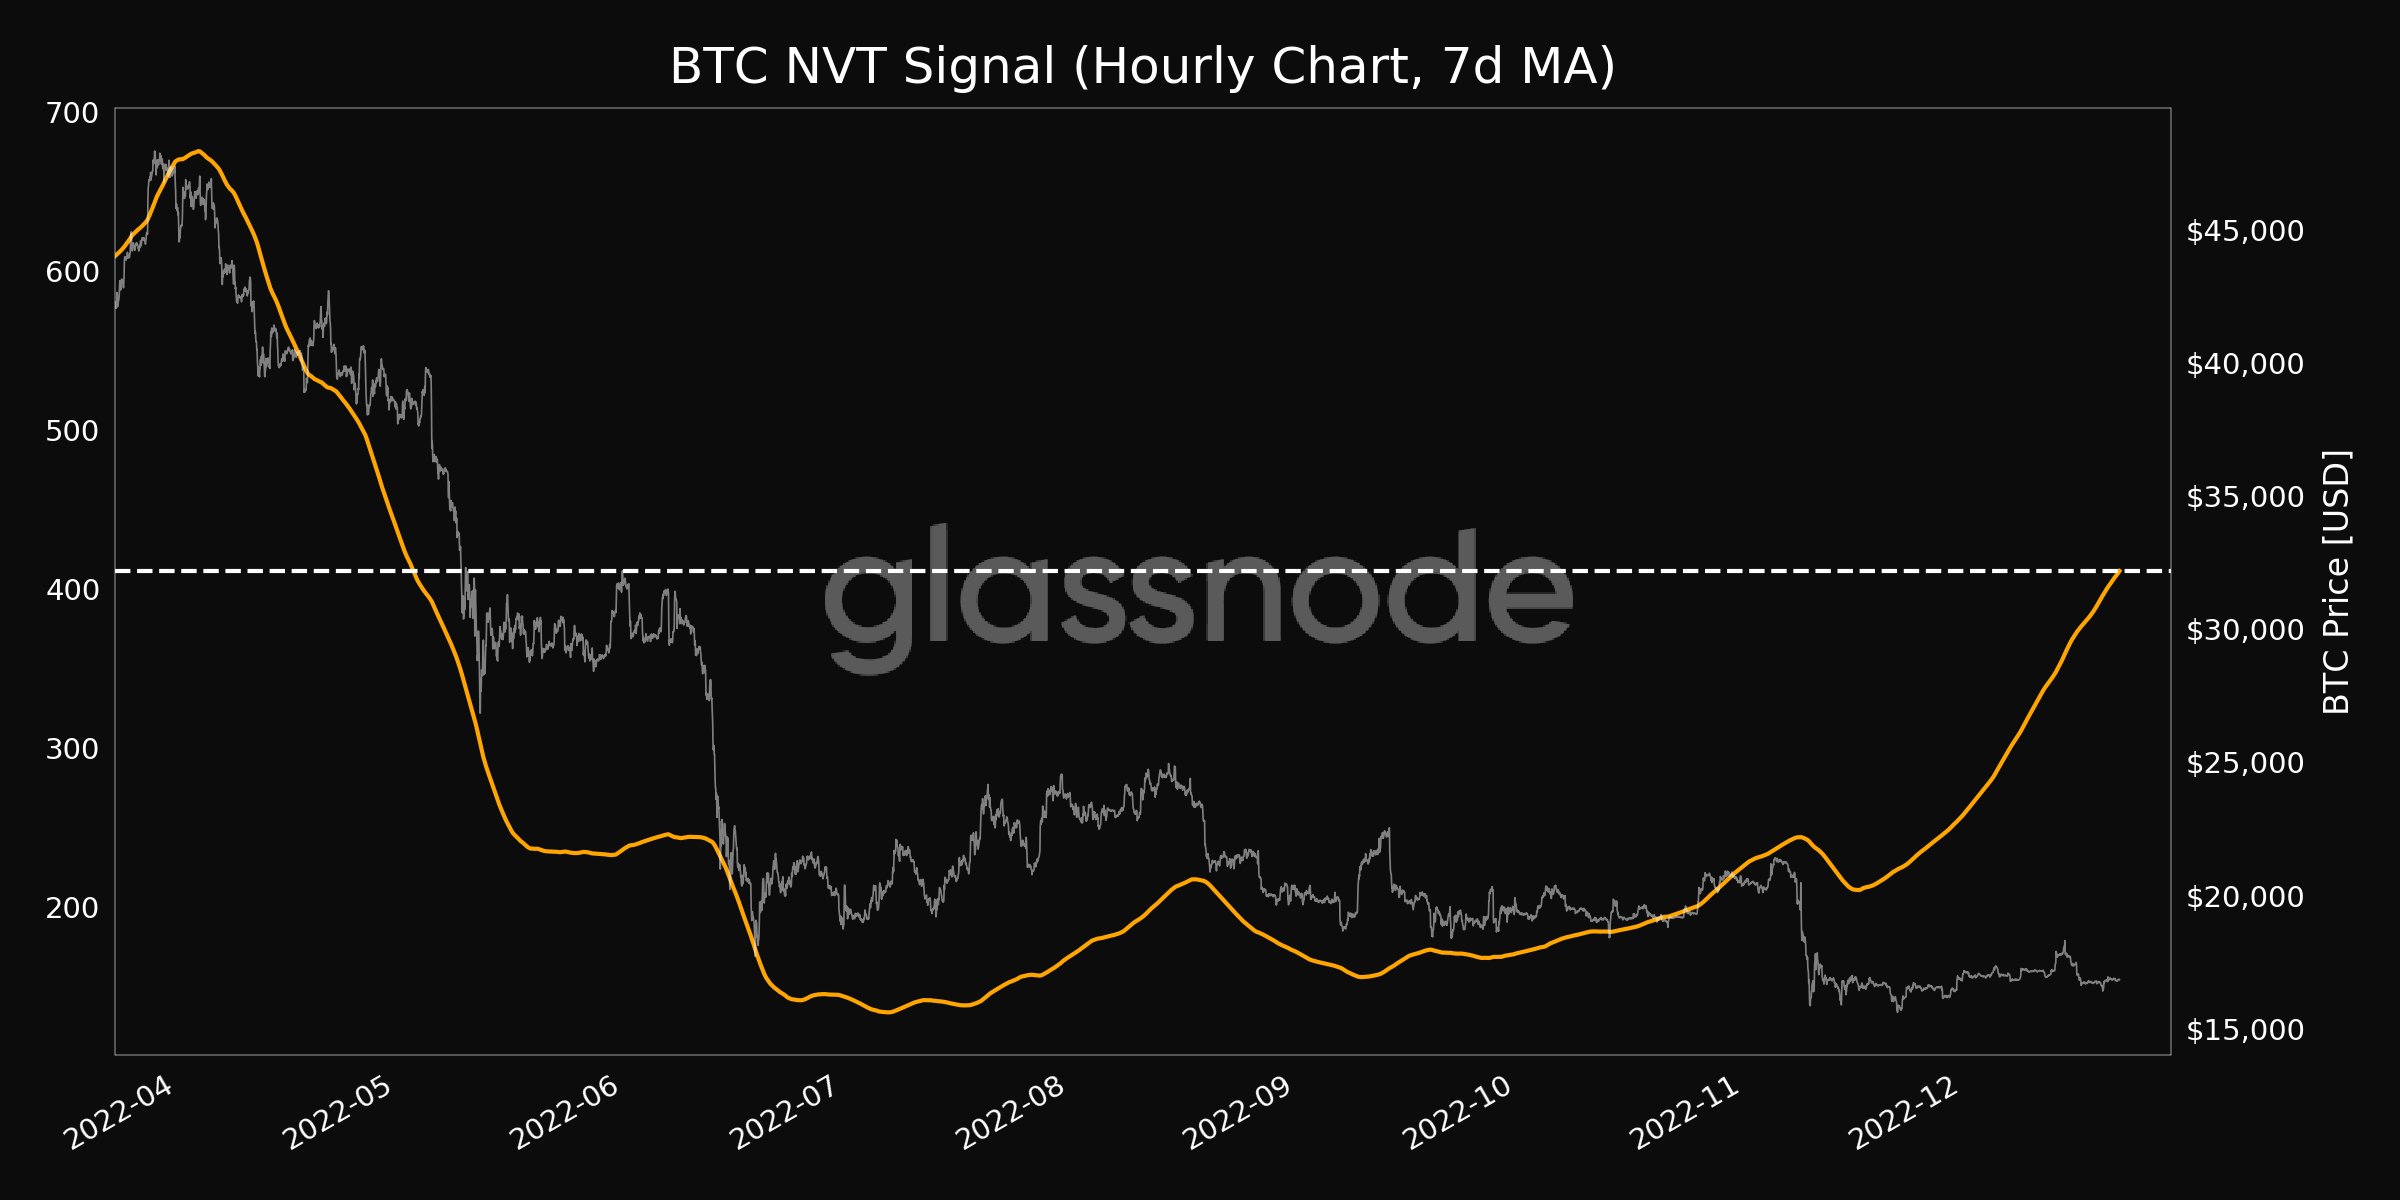
Bitcoin NVT signal annotated chart. Source: Glassnode/Twitter

A tale of two NVT signals

There is a catch to NVT, however. As noted by various analysts, including Woo, the constantly changing nature of the Bitcoin network means that transactions are increasingly moving off-chain.

Together with other phenomena, this impacts on-chain transaction data to the extent that NVT may produce an overly bearish picture of value-to-transactions.

This is addressed with an addition to the indicator called dynamic range NVT (DRNVT). Created by Charles Edwards, CEO of asset manager Capriole, DRNVT uses standard deviations to measure NVT divergence from the mean. It also supplies value zones for easier determination of entry points based on its readings.

Currently, DRNVT is in that value zone, data from TradingView shows — a key contrast to the standard model.

“The NVT Signal with a dynamic fair value range must be used with care,” Edwards nonetheless cautioned in an introduction to the indicator in 2019:

“As with all markets, an asset can remain ‘expensive’ or ‘cheap’ for extended periods or time and continue to get even more expensive or cheaper.”

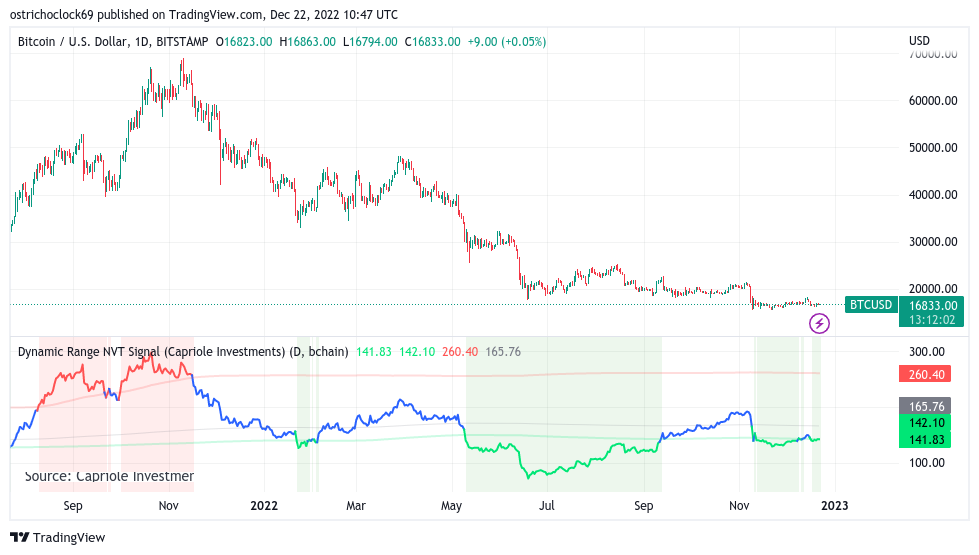
BTC/USD 1-day candle chart (Bitstamp) with dynamic range NVT signal. Source: TradingView

Related Reads

Bitcoin Trading Strategy Breakdown: Celebrity Predictions and Classic Models All Fail, Only These Four Indicators Remain

Analysis of Bitcoin Trading Strategies: Why Celebrity Forecasts and Classic Models Fail, Leaving Only These Four Reliable Indicators This analysis examines the failure of common Bitcoin prediction methods and identifies four reliable indicators for constructing a trading strategy. The author reviewed all major BTC prediction approaches from 2017-2025, categorizing them into three groups: celebrity price targets (consistently over-optimistic), analytical models like Stock-to-Flow (broken post-2022), and on-chain signals. The key finding is that more data often creates confusion, not clarity. The strategy discards unreliable elements: celebrity predictions (incentivized to be extreme), pure models (invalidated by post-ETF market changes), and the Fear & Greed Index used alone (too many false signals). Four reliable indicators were selected: 1. **MVRV Z-Score:** Accurately identifies cycle bottoms when entering its green zone (e.g., 2018, 2020, 2022). Note: Its ability to call tops is now ineffective post-2024. 2. **SOPR (28-day MA):** Consistently signals bottoms when below 1.0, indicating holders are selling at a loss. 3. **ETF Net Flow:** A crucial post-2024 metric showing institutional momentum (e.g., sustained inflows = buying). 4. **Macro Liquidity (Fed policy & M2):** Sets the overall directional bias (e.g., bullish during easing cycles). The core strategy involves waiting for a multi-signal共振 (resonance). For example, a bottom signal requires MVRV in the green zone + SOPR < 1.0. A top signal requires overheated on-chain data + sustained ETF outflows. Macro policy sets the overall direction. The Fear & Greed Index is only used as a weighted confirmatory signal, never alone. Action is only taken when three or more indicators align. The author automated this into a monitoring system that sends Telegram alerts only when signals trigger. As of the article's date (April 15, 2026), the system showed a strong bottom signal: extreme fear (F&G=12), MVRV in the buy zone, and SOPR < 1.0. The only contrary signal was weak ETF flows. Historically, such triple on-chain共振 has preceded 100%+ returns. The conclusion emphasizes building a personal framework over relying on external predictions, allowing for iterative improvement and customization based on individual risk tolerance.

marsbit34m ago

Bitcoin Trading Strategy Breakdown: Celebrity Predictions and Classic Models All Fail, Only These Four Indicators Remain

marsbit34m ago

Trading

Spot
Futures
活动图片