【重磅解读】LTC空头爆仓翻倍,BTC换手率飙升

jinjin说币Published on 2022-11-23Last updated on 2022-11-24

Abstract

BTC价格迎来反弹,筑底中。

1、BTC轻松反弹

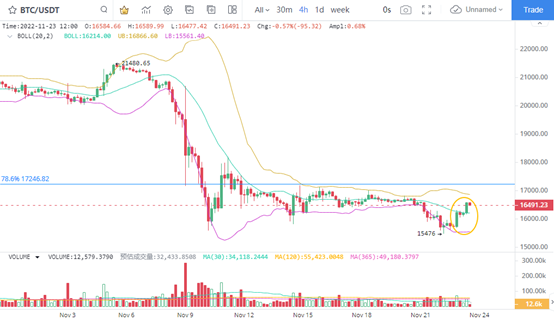
BTC短线反弹的效率很高,4小时K线图小时,明确的两根拉升的K线完成以后,BTC从短线地为你15476美元反弹至1.64万美元附近。涨幅上,BTC区间反弹达到了7%。从价格表现看,BTC在前期11月10日破位下跌以后,调整期间并未再次大幅度破位下跌。因此,支撑暂时有效,同时可接下来关注斐波那契78.6%对应的17246美元的压力位表现。

2、BTC平均转移数量高位运行

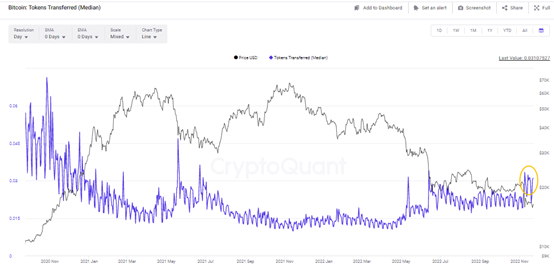
目前来看,BTC的平均单笔转移数量处在高位运行。换句话说,BTC的真实换手率仍然回升,并且为1年来的峰值附近,数量达到了0.031枚BTC。对比2021年峰值以及2020年11月前的表现,BTC平均转移数量分别可达0.046枚BTC和0.05枚BTC。目前BTC在下跌期间的换手率显著回升,这有助于价格确认真实的底部。

3、ETH短线回撤到支撑位

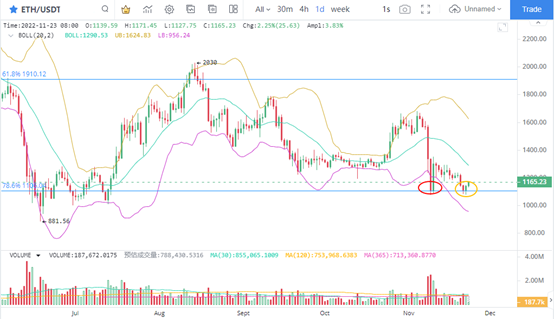
ETH价格回撤到支撑斐波那契78.6%对应的1106美元以后,技术性反弹走势以及第二次出现。首次反弹出现在11月10日,本次二次反弹以后,ETH正在确认典型支撑线斐波那契78.6%的多头实力。目前来看,ETH先后在6月和7月以及本次的11月份检验底部多头护盘实力。在价格并未创新低前,反弹仍然可能延续。
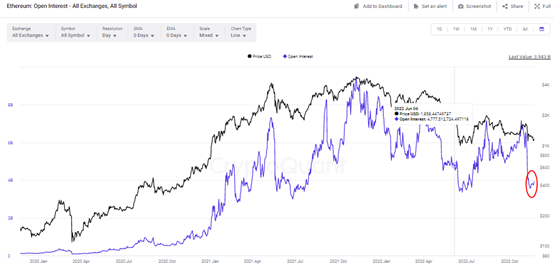
4、ETH合约仓位短线止跌

ETH的合约持仓数量目前已经在低位运行,11月23日合约数量达到了39.3亿美元,低位出现在11月14日为35.6亿美元。本次合约数量底部高于6月22日的33.6亿美元,同时也高于2021年6月26日对应的30.2亿美元。据此判断,ETH合约仓位已经出现了底部迹象。虽然并不清楚接下来ETH合约仓位会不会继续下降。仅从ETH价格表现以及合约仓位对应来看,已经验证了较强的支撑效果。
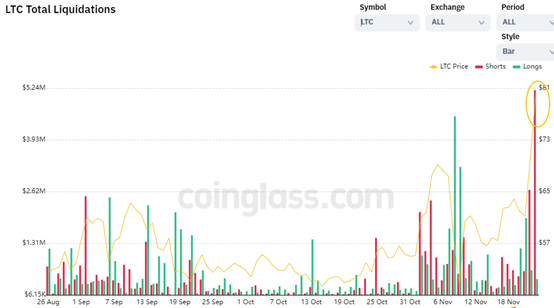
5、 LTC空头大量爆仓

由于融资利率表现较好,使得LTC多头的实力被确认有效,并且在价格上已经得到体现。11月23日LTC的24小时涨幅达到了28%以上。在此期间,空头短线爆仓显著飙升,数量为518万美元,高于11月22日的爆仓266万美元。LTC多头爆仓已经在10月25日、11月2日、11月4日、11月22日和11月23日连续多次出现新高。从市场表现看,空头大量爆仓期间,LTC已经持续了继续走强的迹象。

Related Reads

Bitcoin Trading Strategy Breakdown: Celebrity Predictions and Classic Models All Fail, Only These Four Indicators Remain

Analysis of Bitcoin Trading Strategies: Why Celebrity Forecasts and Classic Models Fail, Leaving Only These Four Reliable Indicators This analysis examines the failure of common Bitcoin prediction methods and identifies four reliable indicators for constructing a trading strategy. The author reviewed all major BTC prediction approaches from 2017-2025, categorizing them into three groups: celebrity price targets (consistently over-optimistic), analytical models like Stock-to-Flow (broken post-2022), and on-chain signals. The key finding is that more data often creates confusion, not clarity. The strategy discards unreliable elements: celebrity predictions (incentivized to be extreme), pure models (invalidated by post-ETF market changes), and the Fear & Greed Index used alone (too many false signals). Four reliable indicators were selected: 1. **MVRV Z-Score:** Accurately identifies cycle bottoms when entering its green zone (e.g., 2018, 2020, 2022). Note: Its ability to call tops is now ineffective post-2024. 2. **SOPR (28-day MA):** Consistently signals bottoms when below 1.0, indicating holders are selling at a loss. 3. **ETF Net Flow:** A crucial post-2024 metric showing institutional momentum (e.g., sustained inflows = buying). 4. **Macro Liquidity (Fed policy & M2):** Sets the overall directional bias (e.g., bullish during easing cycles). The core strategy involves waiting for a multi-signal共振 (resonance). For example, a bottom signal requires MVRV in the green zone + SOPR < 1.0. A top signal requires overheated on-chain data + sustained ETF outflows. Macro policy sets the overall direction. The Fear & Greed Index is only used as a weighted confirmatory signal, never alone. Action is only taken when three or more indicators align. The author automated this into a monitoring system that sends Telegram alerts only when signals trigger. As of the article's date (April 15, 2026), the system showed a strong bottom signal: extreme fear (F&G=12), MVRV in the buy zone, and SOPR < 1.0. The only contrary signal was weak ETF flows. Historically, such triple on-chain共振 has preceded 100%+ returns. The conclusion emphasizes building a personal framework over relying on external predictions, allowing for iterative improvement and customization based on individual risk tolerance.

marsbit30m ago

Bitcoin Trading Strategy Breakdown: Celebrity Predictions and Classic Models All Fail, Only These Four Indicators Remain

marsbit30m ago

Trading

Spot
Futures
活动图片