Research: In spite of FTX catastrophe, Bitcoin whales lead aggressive accumulation phase

cryptoslatePublished on 2022-11-12Last updated on 2022-11-12

Abstract

All Bitcoin cohorts have flipped into buying mode, but whales are accumulating at the most aggressive rate.

The events of the past week have led to significant sell pressure across the crypto market. Since FTX insolvency rumors broke on Nov. 6, peak outflows saw $270 billion leave the market.

”“

Despite the bearish market conditions, on-chain data analyzed by CryptoSlate showed all Bitcoin cohorts have flipped into accumulation mode, with whales buying most aggressively.

”“

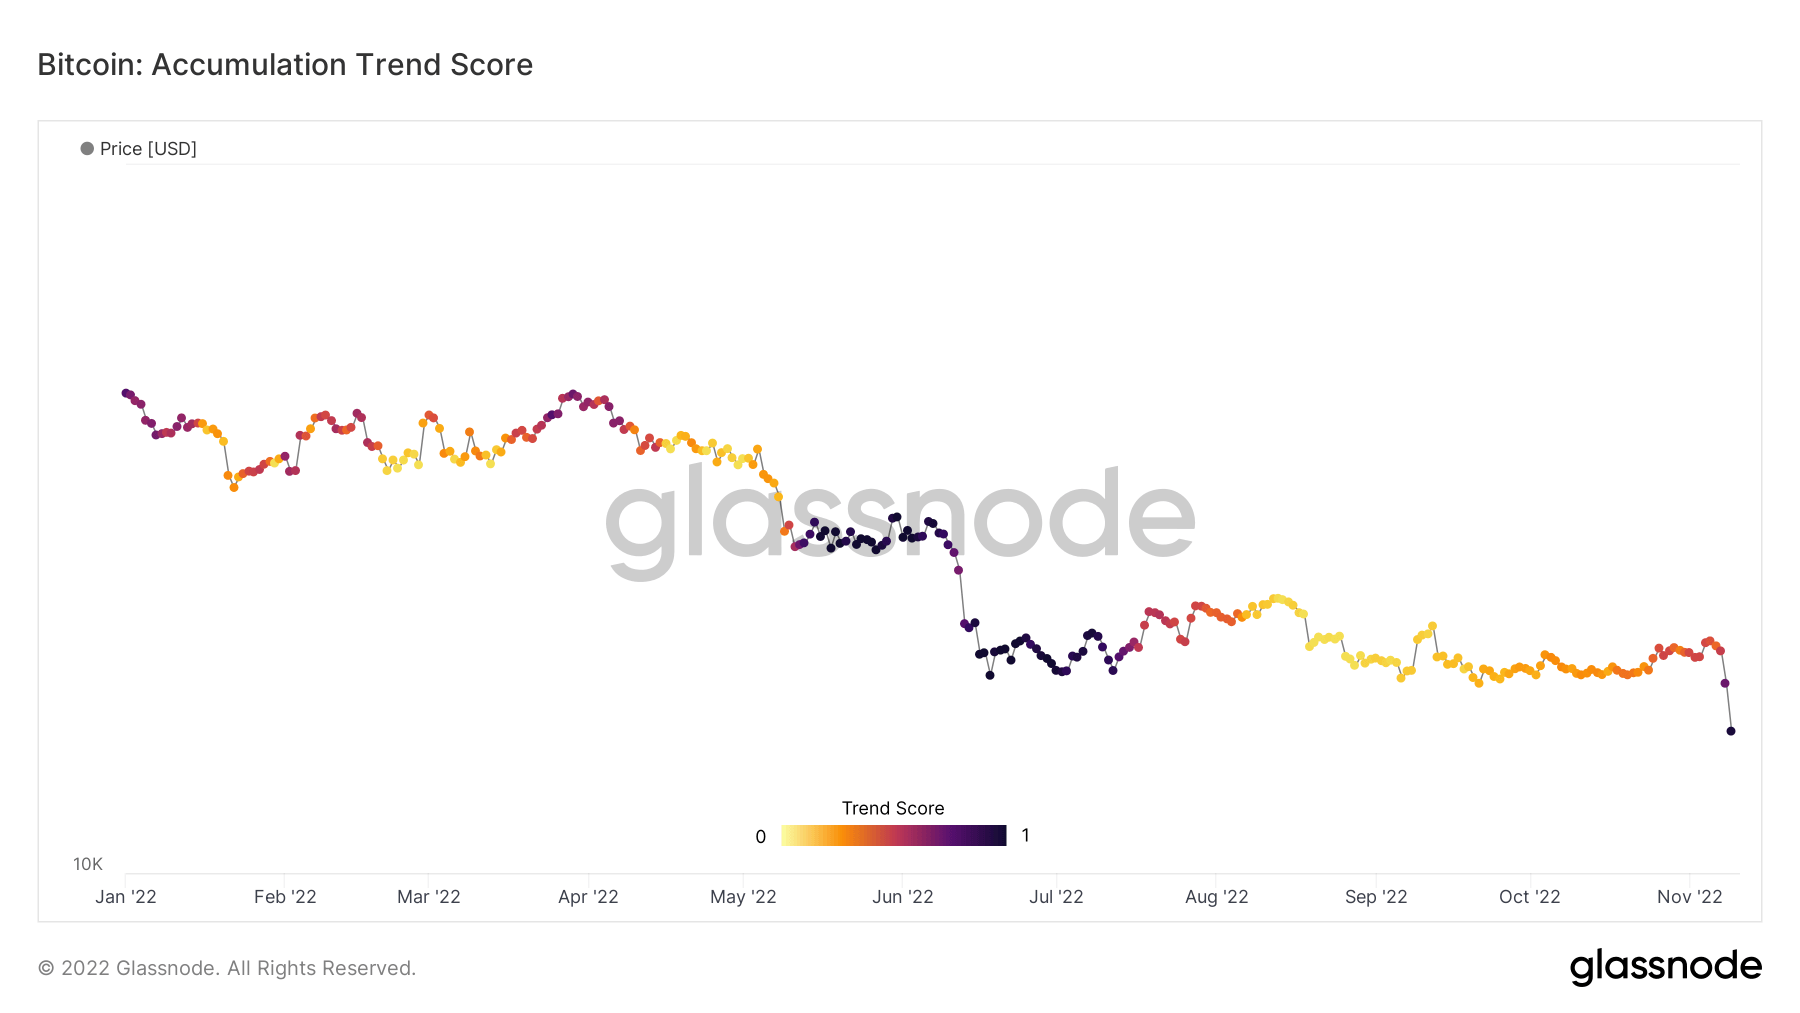
Bitcoin Accumulation Trend Score

”“

The Accumulation Trend Score (ATS) looks at the relative size of entities that are actively accumulating, or distributing, in relation to their Bitcoin holdings.

”“

The ATS operates on a scale of 0 to 1. A reading close to 0 indicates distribution or selling. Whereas a reading close to 1 indicates accumulation or buying.

”“

The chart below shows whales accumulated for the first time since August. The current reading comes in at 0.97, indicating an aggressive rate of accumulation and the highest since 2019. For comparison, the previous day’s ATS reading flashed 0.74.

”“

Despite jitters resulting from the collapse of FTX, the market sees value in Bitcoin priced in the teens.
Bitcoin Accumulation Trend Score

Source: Glassnode.com

”“

Cohort analysis

”“

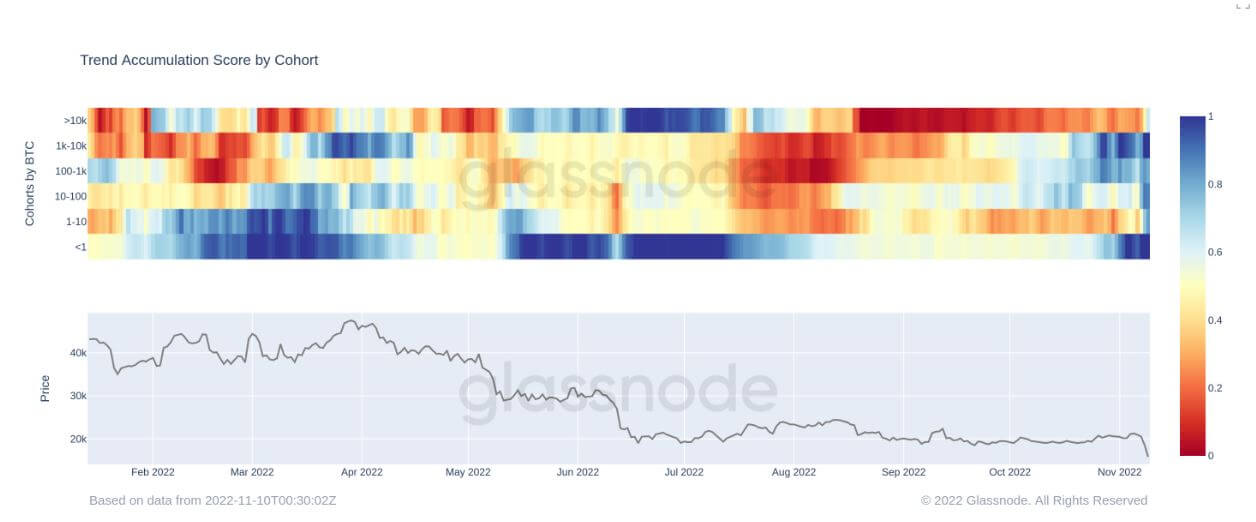
Entities holding between 1,000 and 9,999 Bitcoin are categorized as whales. While 10,000+ BTC holdings refer to super whale status.

”“

In recent days, all cohorts have flashed light blue or darker blue, indicating all cohorts are accumulating in unison — an unprecedented pattern in 2022.

”“

Whales and minnows — entities holding less than 1 BTC — in particular are the cohorts accumulating most aggressively.
Accumulation Trend Score by cohort

Source: Glassnode.com

”“

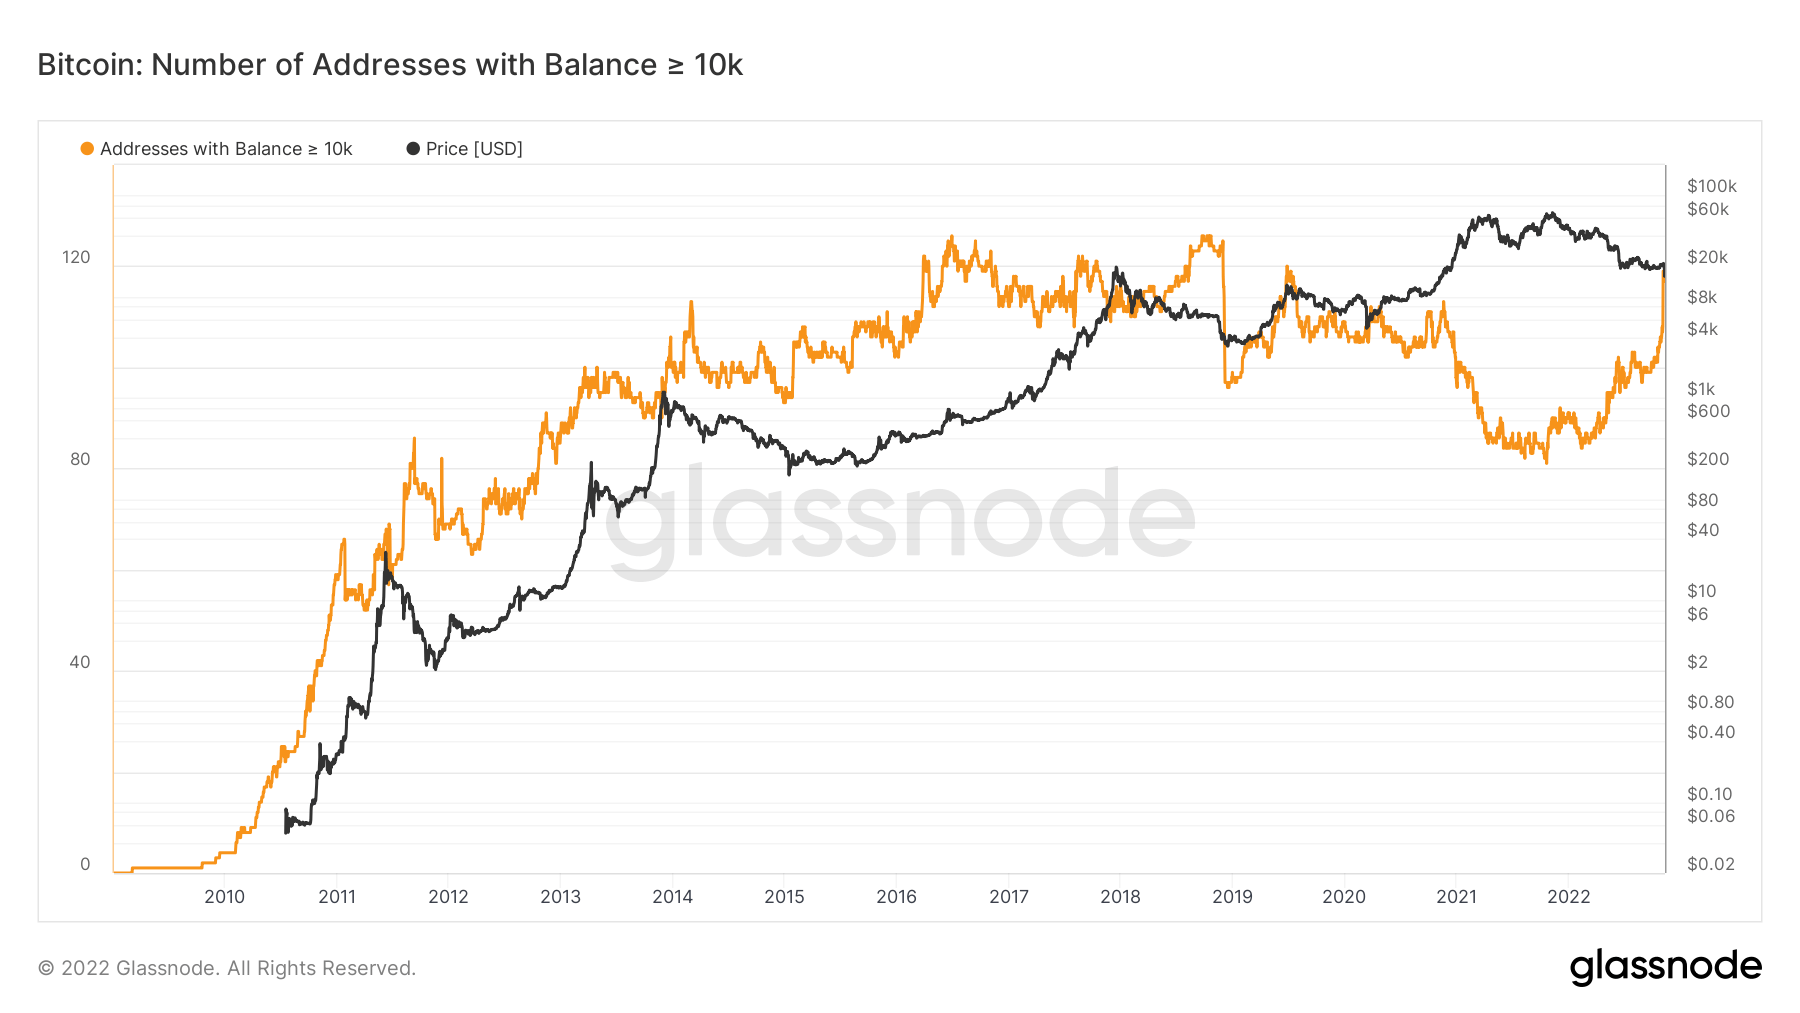
On-chain data shows the number of addresses (up to whale status,) bottomed at approximately the time of the $69,000 market top. Since then, an uptrend over 2022 has culminated in a sharp uptick in recent days.
Addresses holding up to 10,000 BTC

Source: Glassnode.com

”“

Whale Exchange Net Position Change

”“

Exchange Net Position Change shows the 30-day change in the Bitcoin supply from exchange wallets. Readings above 0 indicate inflows into exchange wallets, while below 0 show BTC leaving exchange wallets.

”“

The chart below shows this data for whales and super whales. Recent days show exchange whale and super whale holdings have spiked higher. The last time this happened, to a comparable degree of significance, was during August.

”“

Although the primary reason entities send tokens to exchanges is to cash out. The Cumulative Net Whale Exchange Volume shows a macro increase over time, indicating this is not the case for whale holders.
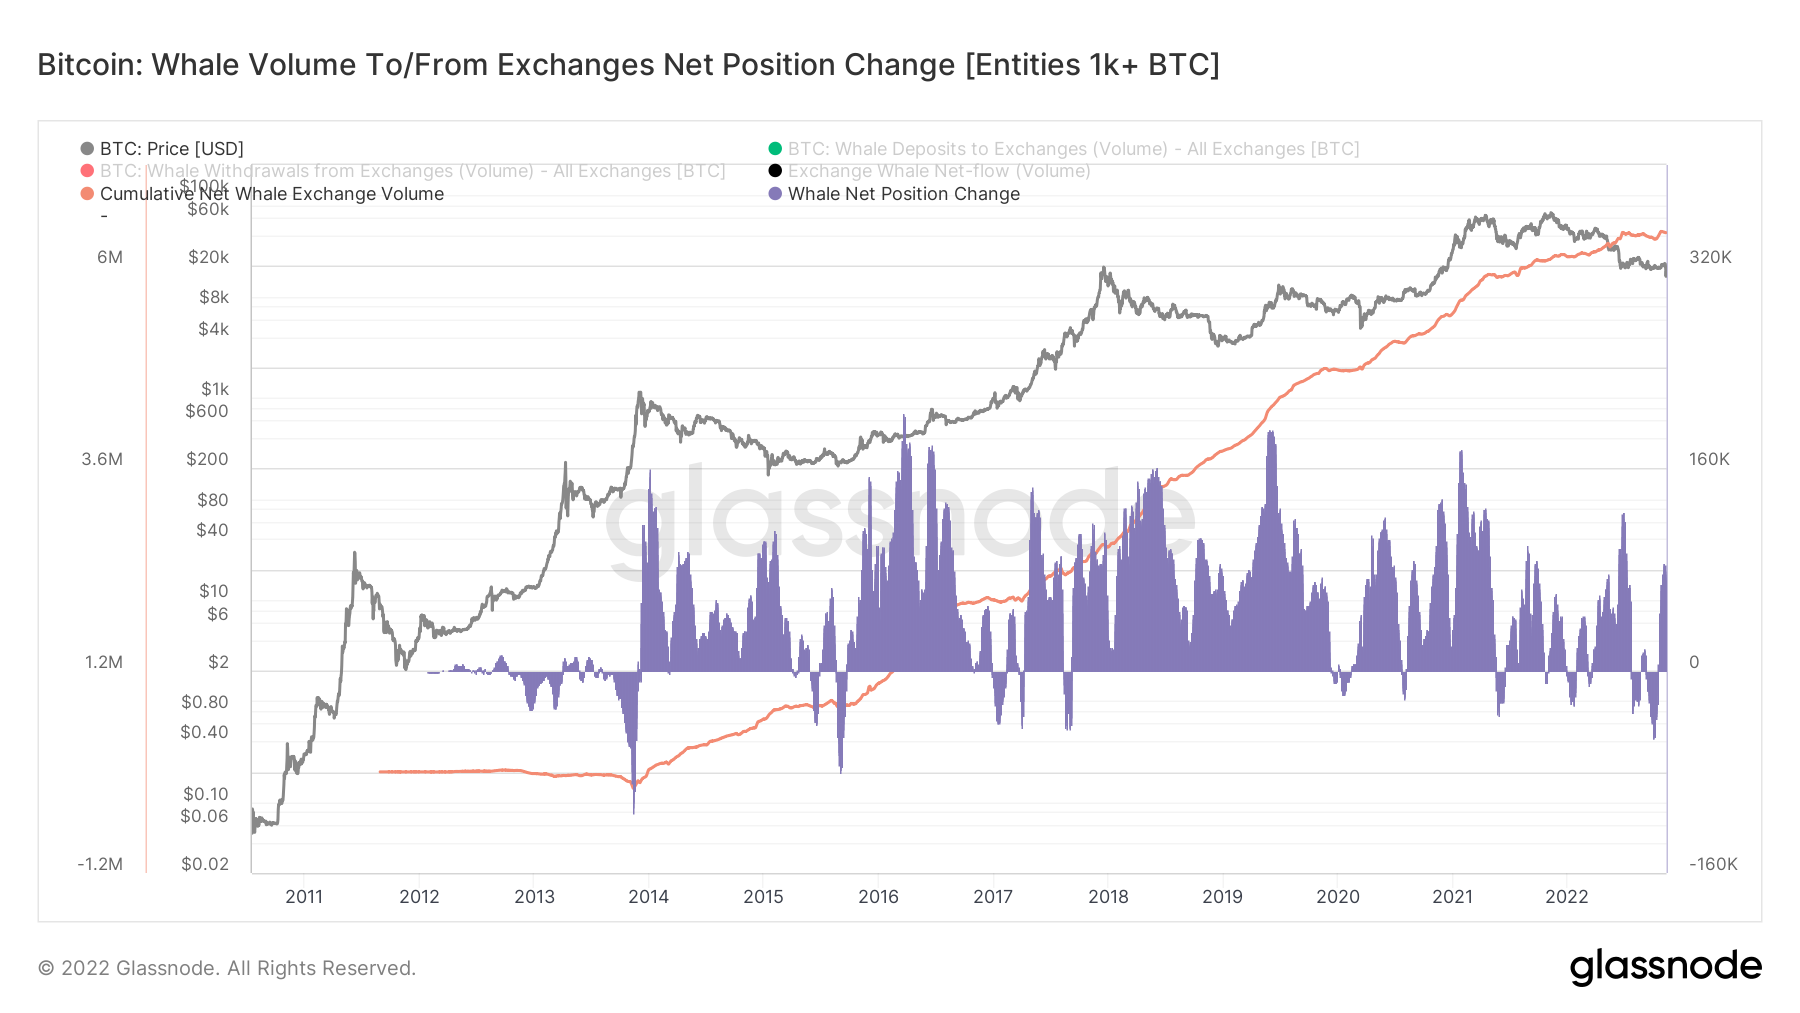
Whale Exchange Net Position Change

Source: Glassnode.com

Related Reads

After R&D Investment Catches Up with the U.S., Is the Sino-U.S. Chip Competition Still Just About Money?

The article examines the significance of recent data showing China's total R&D expenditure, measured by purchasing power parity (PPP), catching up to or slightly surpassing that of the United States in 2024. It argues that while this milestone reflects China's immense capacity to mobilize research resources, the competition in semiconductors now extends far beyond sheer financial input. The analysis highlights key differences: China's R&D is heavily skewed towards experimental development (over 80%), focusing on product engineering and industrialization, whereas the U.S. allocates a proportionally larger share (about 15%) to basic research. Furthermore, leading U.S. semiconductor firms reinvest a significant portion of their substantial global sales revenue into R&D, creating a sustainable commercial innovation cycle that is difficult to replicate. The article emphasizes that semiconductor progress depends on converting R&D into commercially viable products that pass rigorous customer validation and achieve repeat orders, not just on spending levels. It concludes that as China enters the top tier of R&D spenders, the critical challenges shift to improving resource allocation efficiency, fostering long-term basic research, and building effective mechanisms to bridge the gap between laboratory discoveries and reliable, market-ready industrial capabilities.

marsbit47m ago

After R&D Investment Catches Up with the U.S., Is the Sino-U.S. Chip Competition Still Just About Money?

marsbit47m ago

Top 10% of American Households Capture 88% of Wealth, How Is the AI Era Cake Divided?

AI Worsens Wealth Inequality as Top 10% of US Families Garner 88% of Stock Gains (2019-2026) A report from the China Finance 40 Forum highlights that the AI boom is significantly widening wealth inequality in the United States. From 2019 to Q1 2026, wealth from directly held stocks by US households nearly doubled from $29 trillion to approximately $55 trillion, with rapid growth concentrated post-2023, coinciding with the AI-driven stock market surge. The distribution of these gains has been starkly uneven. Between 2022 and Q1 2026, the wealth increase of about $21 trillion was captured almost entirely by the wealthiest families: the top 10% secured roughly 88% ($18.5 trillion), while the bottom 50% received only about 1% ($0.2 trillion). This has contributed to a growing disparity in disposable income shares. The report, referencing economic historian Robert Allen, draws parallels to historical technological shifts like the "Engels' Pause" during the First Industrial Revolution, where worker wages stagnated despite productivity gains. It suggests AI could induce a similar period where capital收益 outpace labor income, exacerbating inequality. Huang Yiping of Peking University identifies four mechanisms through which AI impacts income distribution: capital-bias (reducing labor's income share), task polarization (hollowing out middle-skill jobs), skill-based digital divides, and wealth amplification through assets. He warns that if this trend continues, strong supply growth driven by AI could be undermined by persistently weak consumer demand, threatening sustainable economic growth. To address these challenges, the report proposes a three-pronged strategy: 1) Defensive measures like strengthening social safety nets and antitrust enforcement; 2) Empowering workers through education reform and lifelong learning to collaborate with AI; and 3) Rebalancing via policies such as potential taxes on AI超额收益 and mechanisms for broader sharing of technology's benefits, ensuring AI's红利 are more equitably distributed.

marsbit52m ago

Top 10% of American Households Capture 88% of Wealth, How Is the AI Era Cake Divided?

marsbit52m ago

Trading

Spot
活动图片