Bitcoin Open Interest Climbs Up, Price To Break Sideways Trend Soon?

newsbtcPublished on 2022-09-05Last updated on 2022-09-05

Abstract

On-chain data shows the Bitcoin open interest has been slowly growing recently, something that could lead to more volatility in the price of the crypto. Bitcoin Open Interest Goes Up...

On-chain data shows the Bitcoin open interest has been slowly growing recently, something that could lead to more volatility in the price of the crypto.
Bitcoin Open Interest Goes Up While Funding Rates Approach A Neutral Value
As pointed out by an analyst in a CryptoQuant post, the BTC open interest has gained around $500 million over the last few days.
The “open interest” is an indicator that measures the total amount of BTCUSD positions currently open on all derivatives exchanges. The metric takes into account for both short and long positions.
When the value of this indicator goes up, it means investors are opening up more positions on exchanges right now. Since this usually leads to a higher amount of leverage in the market, this kind of trend can make the price of Bitcoin more volatile.
On the other hand, the decline in the metric implies positions are closing up or liquidating on exchanges at the moment. Lower leverage usually leads to a more stable value of the crypto, and so such a trend can result in lesser volatility for BTC.
Now, here is a chart that shows the trend in the Bitcoin open interest over the last few days:

Bitcoin Open Interest


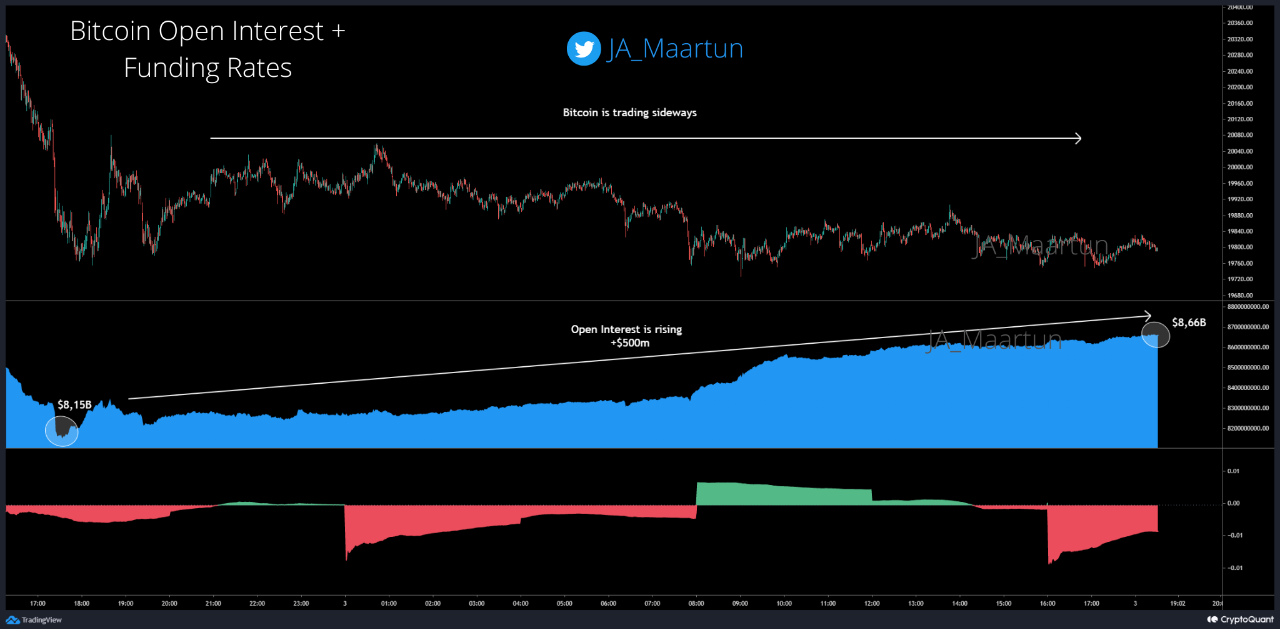
The value of the metric seems to have climbed up in recent days | Source: CryptoQuant
As you can see in the above graph, the Bitcoin open interest has observed an uplift during the past couple of days.
This increase amounted to around $500 million and took the indicator’s value from $8.15 billion to $8.66 billion.
The chart also includes data for the “funding rates,” a metric that tells us about the distribution of BTC positions between longs and shorts.
This indicator has most recently had a slightly negative value, which means the market is slightly leaning towards a short-dominant environment right now.
In times of high open interest (and hence high leverage), the market becomes more prone to seeing largescale liquidation events. Such liquidations are the reason behind the increased volatility of the market during such periods.
BTC has been mostly moving sideways during the last few days, but since the open interest has jumped up now, it’s possible the crypto could see fresh movement soon.
The funding rates can hint at which direction this new price volatility may favor, but since the metric’s value is almost neutral currently, it’s hard to say anything.
At the time of writing, Bitcoin’s price floats around $19.7k, down 1% in the past week.

Bitcoin Price Chart


BTC has continued to consolidate sideways during the past week or so | Source: BTCUSD on TradingView
Featured image from Kanchanara on Unsplash.com, charts from TradingView.com, CryptoQuant.com

Related Reads

Bitcoin Trading Strategy Breakdown: Celebrity Predictions and Classic Models All Fail, Only These Four Indicators Remain

Analysis of Bitcoin Trading Strategies: Why Celebrity Forecasts and Classic Models Fail, Leaving Only These Four Reliable Indicators This analysis examines the failure of common Bitcoin prediction methods and identifies four reliable indicators for constructing a trading strategy. The author reviewed all major BTC prediction approaches from 2017-2025, categorizing them into three groups: celebrity price targets (consistently over-optimistic), analytical models like Stock-to-Flow (broken post-2022), and on-chain signals. The key finding is that more data often creates confusion, not clarity. The strategy discards unreliable elements: celebrity predictions (incentivized to be extreme), pure models (invalidated by post-ETF market changes), and the Fear & Greed Index used alone (too many false signals). Four reliable indicators were selected: 1. **MVRV Z-Score:** Accurately identifies cycle bottoms when entering its green zone (e.g., 2018, 2020, 2022). Note: Its ability to call tops is now ineffective post-2024. 2. **SOPR (28-day MA):** Consistently signals bottoms when below 1.0, indicating holders are selling at a loss. 3. **ETF Net Flow:** A crucial post-2024 metric showing institutional momentum (e.g., sustained inflows = buying). 4. **Macro Liquidity (Fed policy & M2):** Sets the overall directional bias (e.g., bullish during easing cycles). The core strategy involves waiting for a multi-signal共振 (resonance). For example, a bottom signal requires MVRV in the green zone + SOPR < 1.0. A top signal requires overheated on-chain data + sustained ETF outflows. Macro policy sets the overall direction. The Fear & Greed Index is only used as a weighted confirmatory signal, never alone. Action is only taken when three or more indicators align. The author automated this into a monitoring system that sends Telegram alerts only when signals trigger. As of the article's date (April 15, 2026), the system showed a strong bottom signal: extreme fear (F&G=12), MVRV in the buy zone, and SOPR < 1.0. The only contrary signal was weak ETF flows. Historically, such triple on-chain共振 has preceded 100%+ returns. The conclusion emphasizes building a personal framework over relying on external predictions, allowing for iterative improvement and customization based on individual risk tolerance.

marsbit2h ago

Bitcoin Trading Strategy Breakdown: Celebrity Predictions and Classic Models All Fail, Only These Four Indicators Remain

marsbit2h ago

Trading

Spot
Futures
活动图片