$414mln exits crypto funds – Why sentiment is suddenly shifting

ambcryptoPublished on 2026-03-31Last updated on 2026-03-31

Abstract

In the last week of March, cryptocurrency investment products experienced significant outflows totaling $414 million, marking the first net withdrawals in five weeks. This shift was driven by escalating global tensions, high inflation, and anticipation around Federal Reserve meetings, reducing total assets under management to $129 billion. Ethereum was hit hardest with $222 million in outflows, while Bitcoin saw $194 million withdrawn despite strong year-to-date inflows. Solana also recorded outflows, whereas XRP was the sole asset with inflows of $15.8 million. On-chain metrics showed reduced network engagement for major cryptocurrencies. The U.S. led outflows with $454 million, while Canada and Germany saw modest inflows. Despite a recent market cap rebound to $2.34 trillion, short-term volatility remains high due to macroeconomic uncertainty, cautioning investors against relying on temporary rallies for long-term predictions.

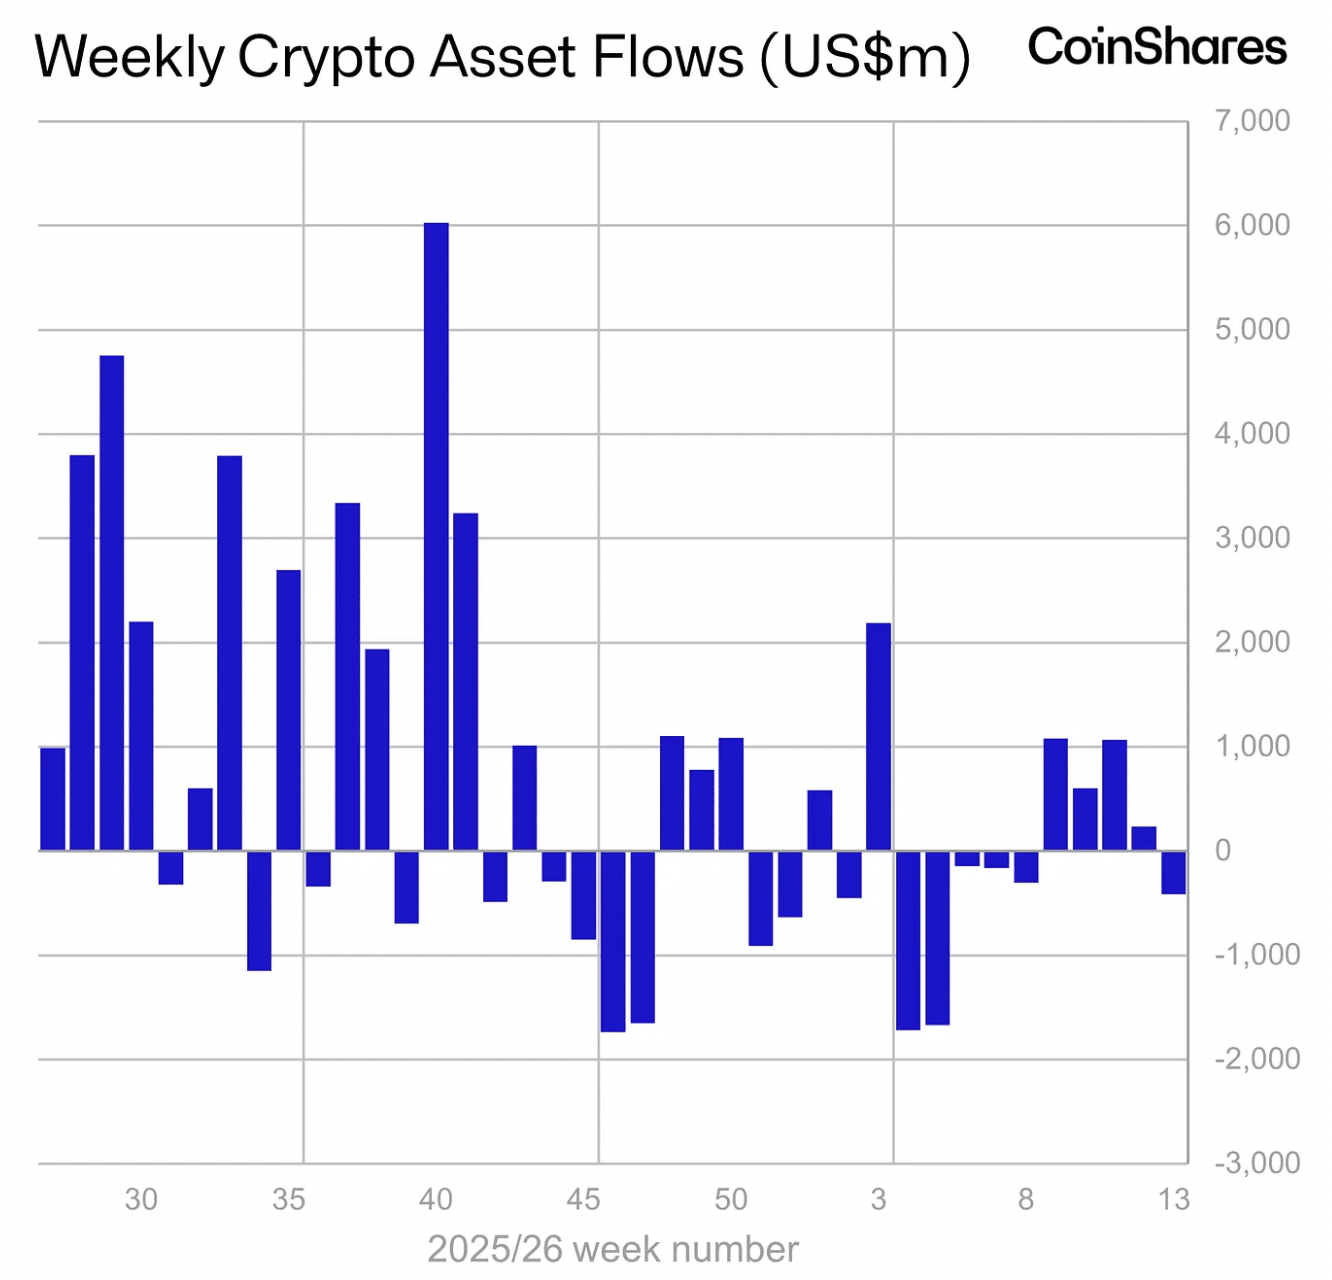
The last week of March (from the 23rd to the 24th) was not good for the cryptocurrency investment product. As per a weekly report from CoinShares, digital assets funds recorded their first outflows in five weeks, worth $414 million.

This has more to do with just investors’ sentiments and price actions.

Escalating global tensions involving the U.S and Iran, accompanied by high inflation and the growing expectations around the upcoming Federal Reserve meetings, are the major reasons behind this shift.

Because of these developments from politics to economics, the total Assets under Management (AuM) have declined to $129 billion. If looked carefully, such levels have already been hit during early February and back in April 2025, when volatility was high due to changing tariff policies.

Source: CoinShares

Winners and losers of the last week

That said, in this outflow, Ethereum [ETH] was hit the hardest, recording $222 million worth of outflows. This further caused its year-to-date outflow to fall to $273 million.

Well, this drop might be due to the ongoing uncertainty around the CLARITY Act. Meanwhile, ETH’s price was also choppy as it faced a downturn of 2.48% in the past week.

Interestingly, Bitcoin [BTC] was standing strong, but the room for caution still remained. The leading cryptocurrency recorded outflows worth $194 million in the last week.

However, if you looked at its year-to-date data, its net inflow stood strong at $964 million. This came as Bitcoin’s price witnessed a weekly drop of 3.48%.

Source: CoinShares

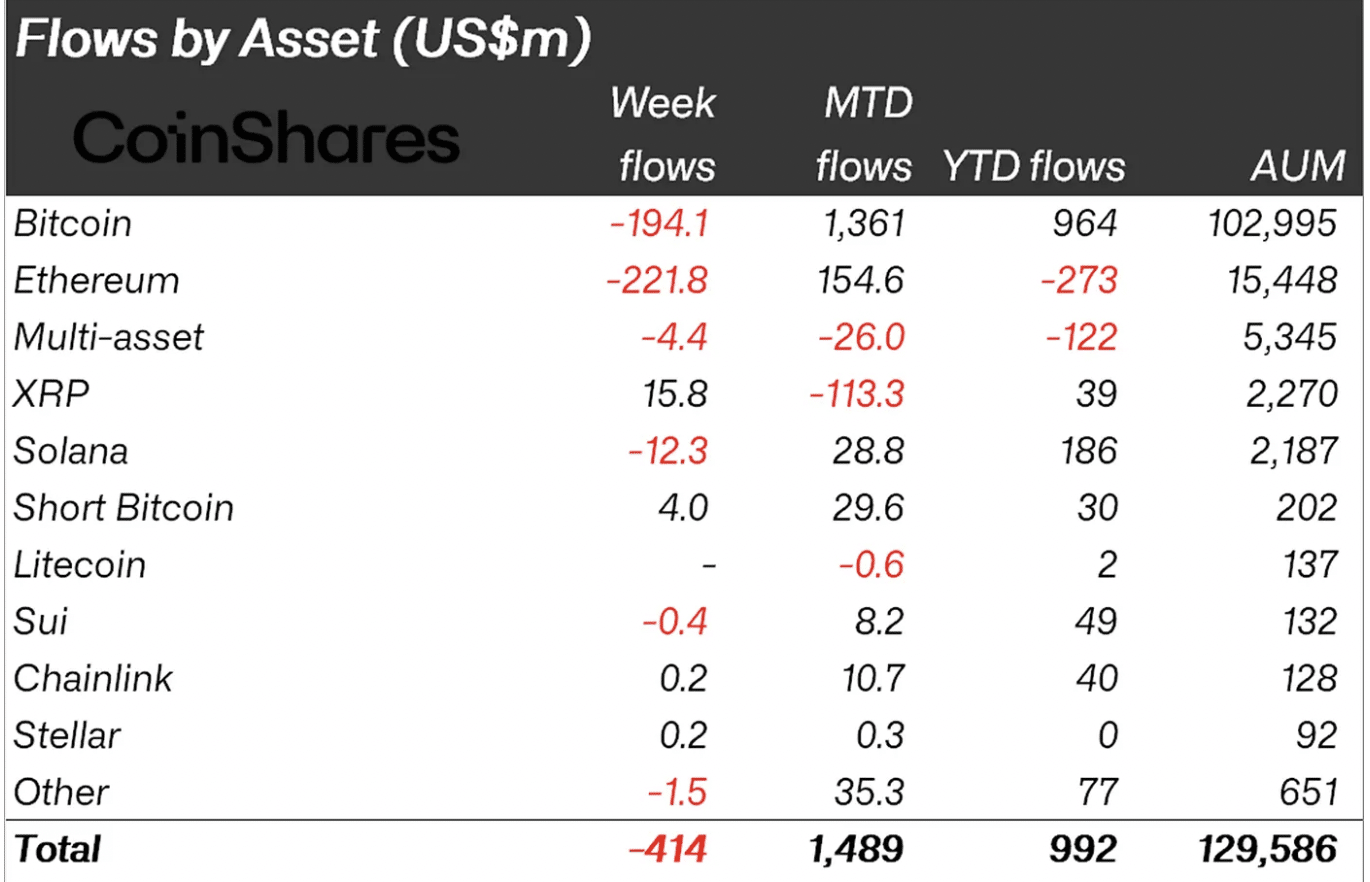
Needless to say, Solana [SOL] was no exception as it too recorded $12.3 million in outflows as its price swung down by 5.97% in the past week.

Interestingly, Ripple’s XRP was the only one to record inflows worth $15.8 million. However, its price mirrored the broader market downturn, dropping by 4.68% in the past week.

Thus, XRP was the winner of the digital asset funds in the past week, whereas ETH was the loser.

Are on-chain metrics in favour?

This sentiment was further confirmed by the active address metric by Santiment, wherein Bitcoin and Ethereum had both seen a drop in the aforementioned metric by the end of March.

Source: Santiment

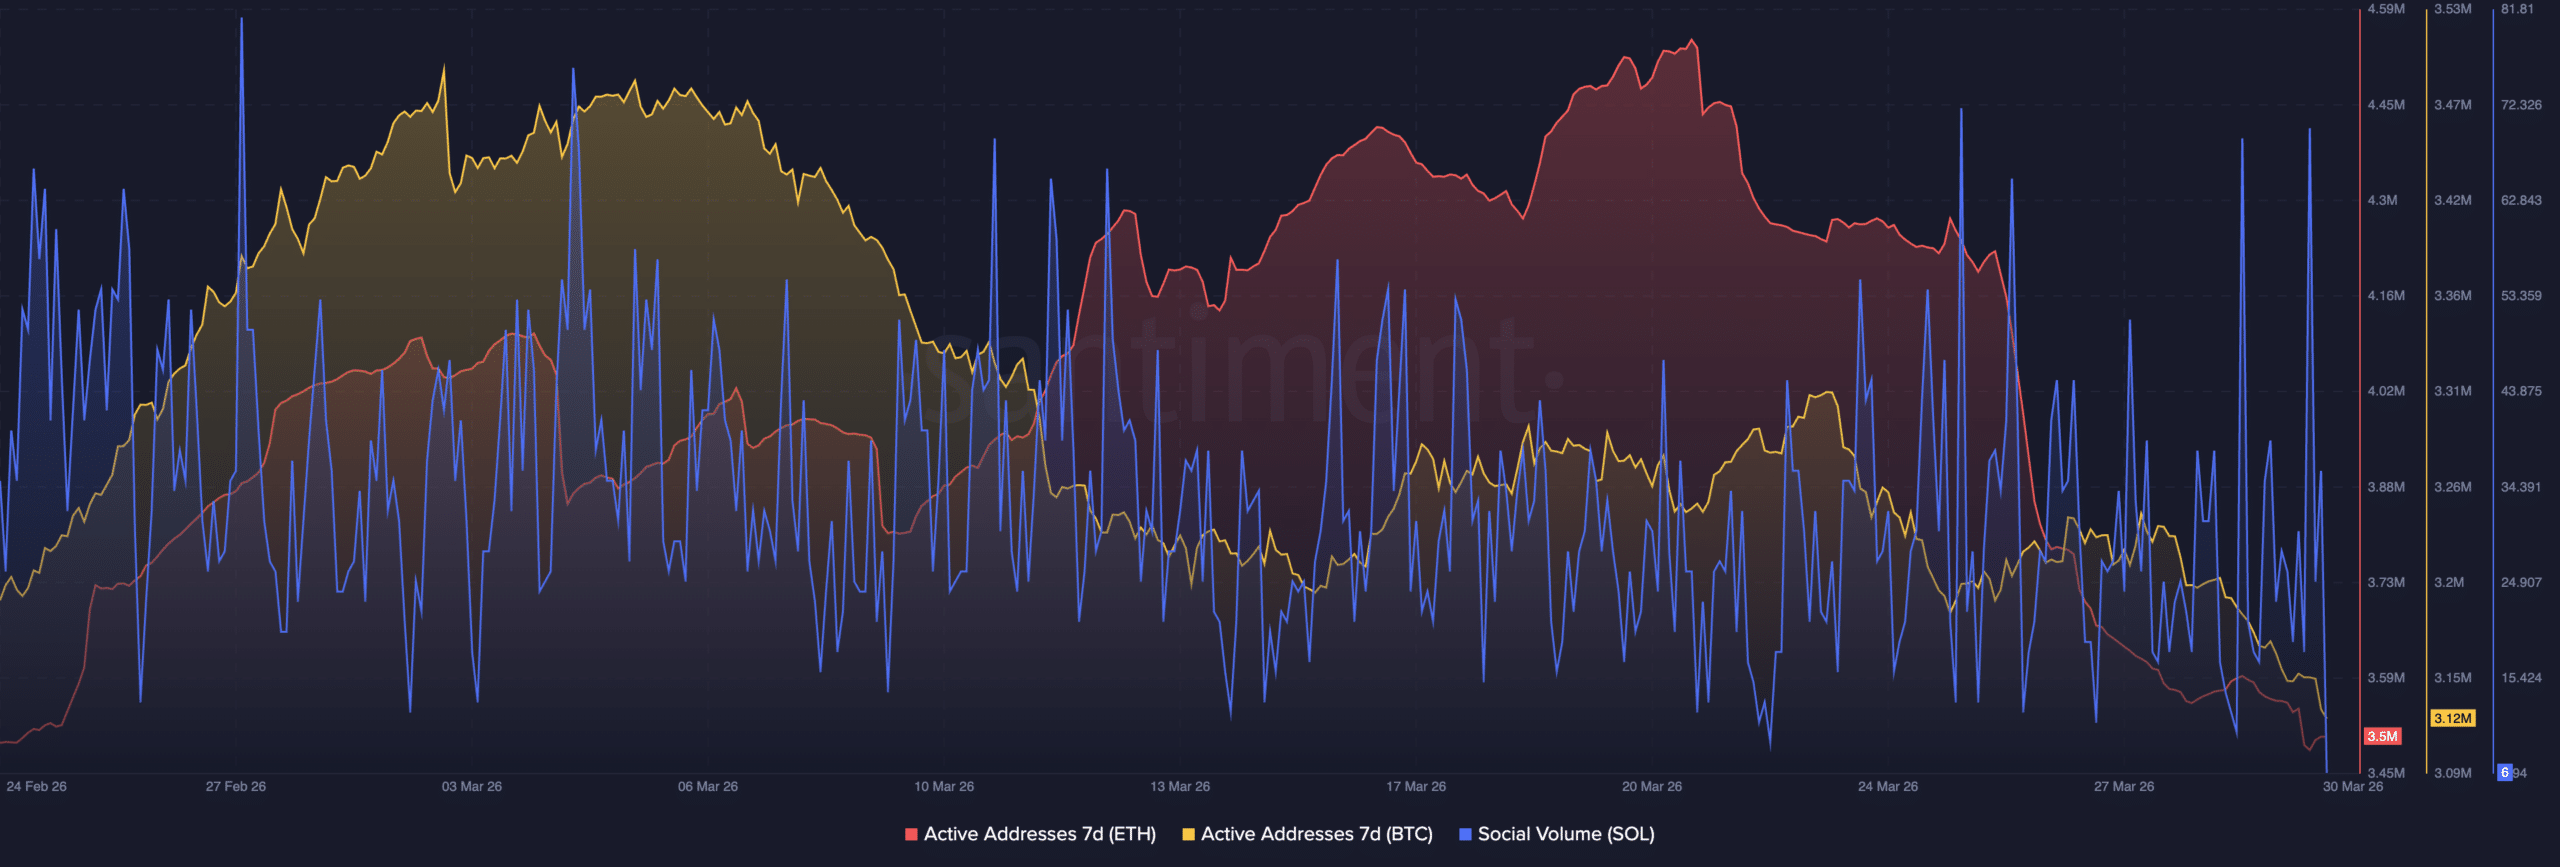
This suggests that only a few people were invested in the network as compared to the high activity seen in early March.

Meanwhile, Solana’s Social Volume has also dropped, meaning fewer people are talking about the altcoin.

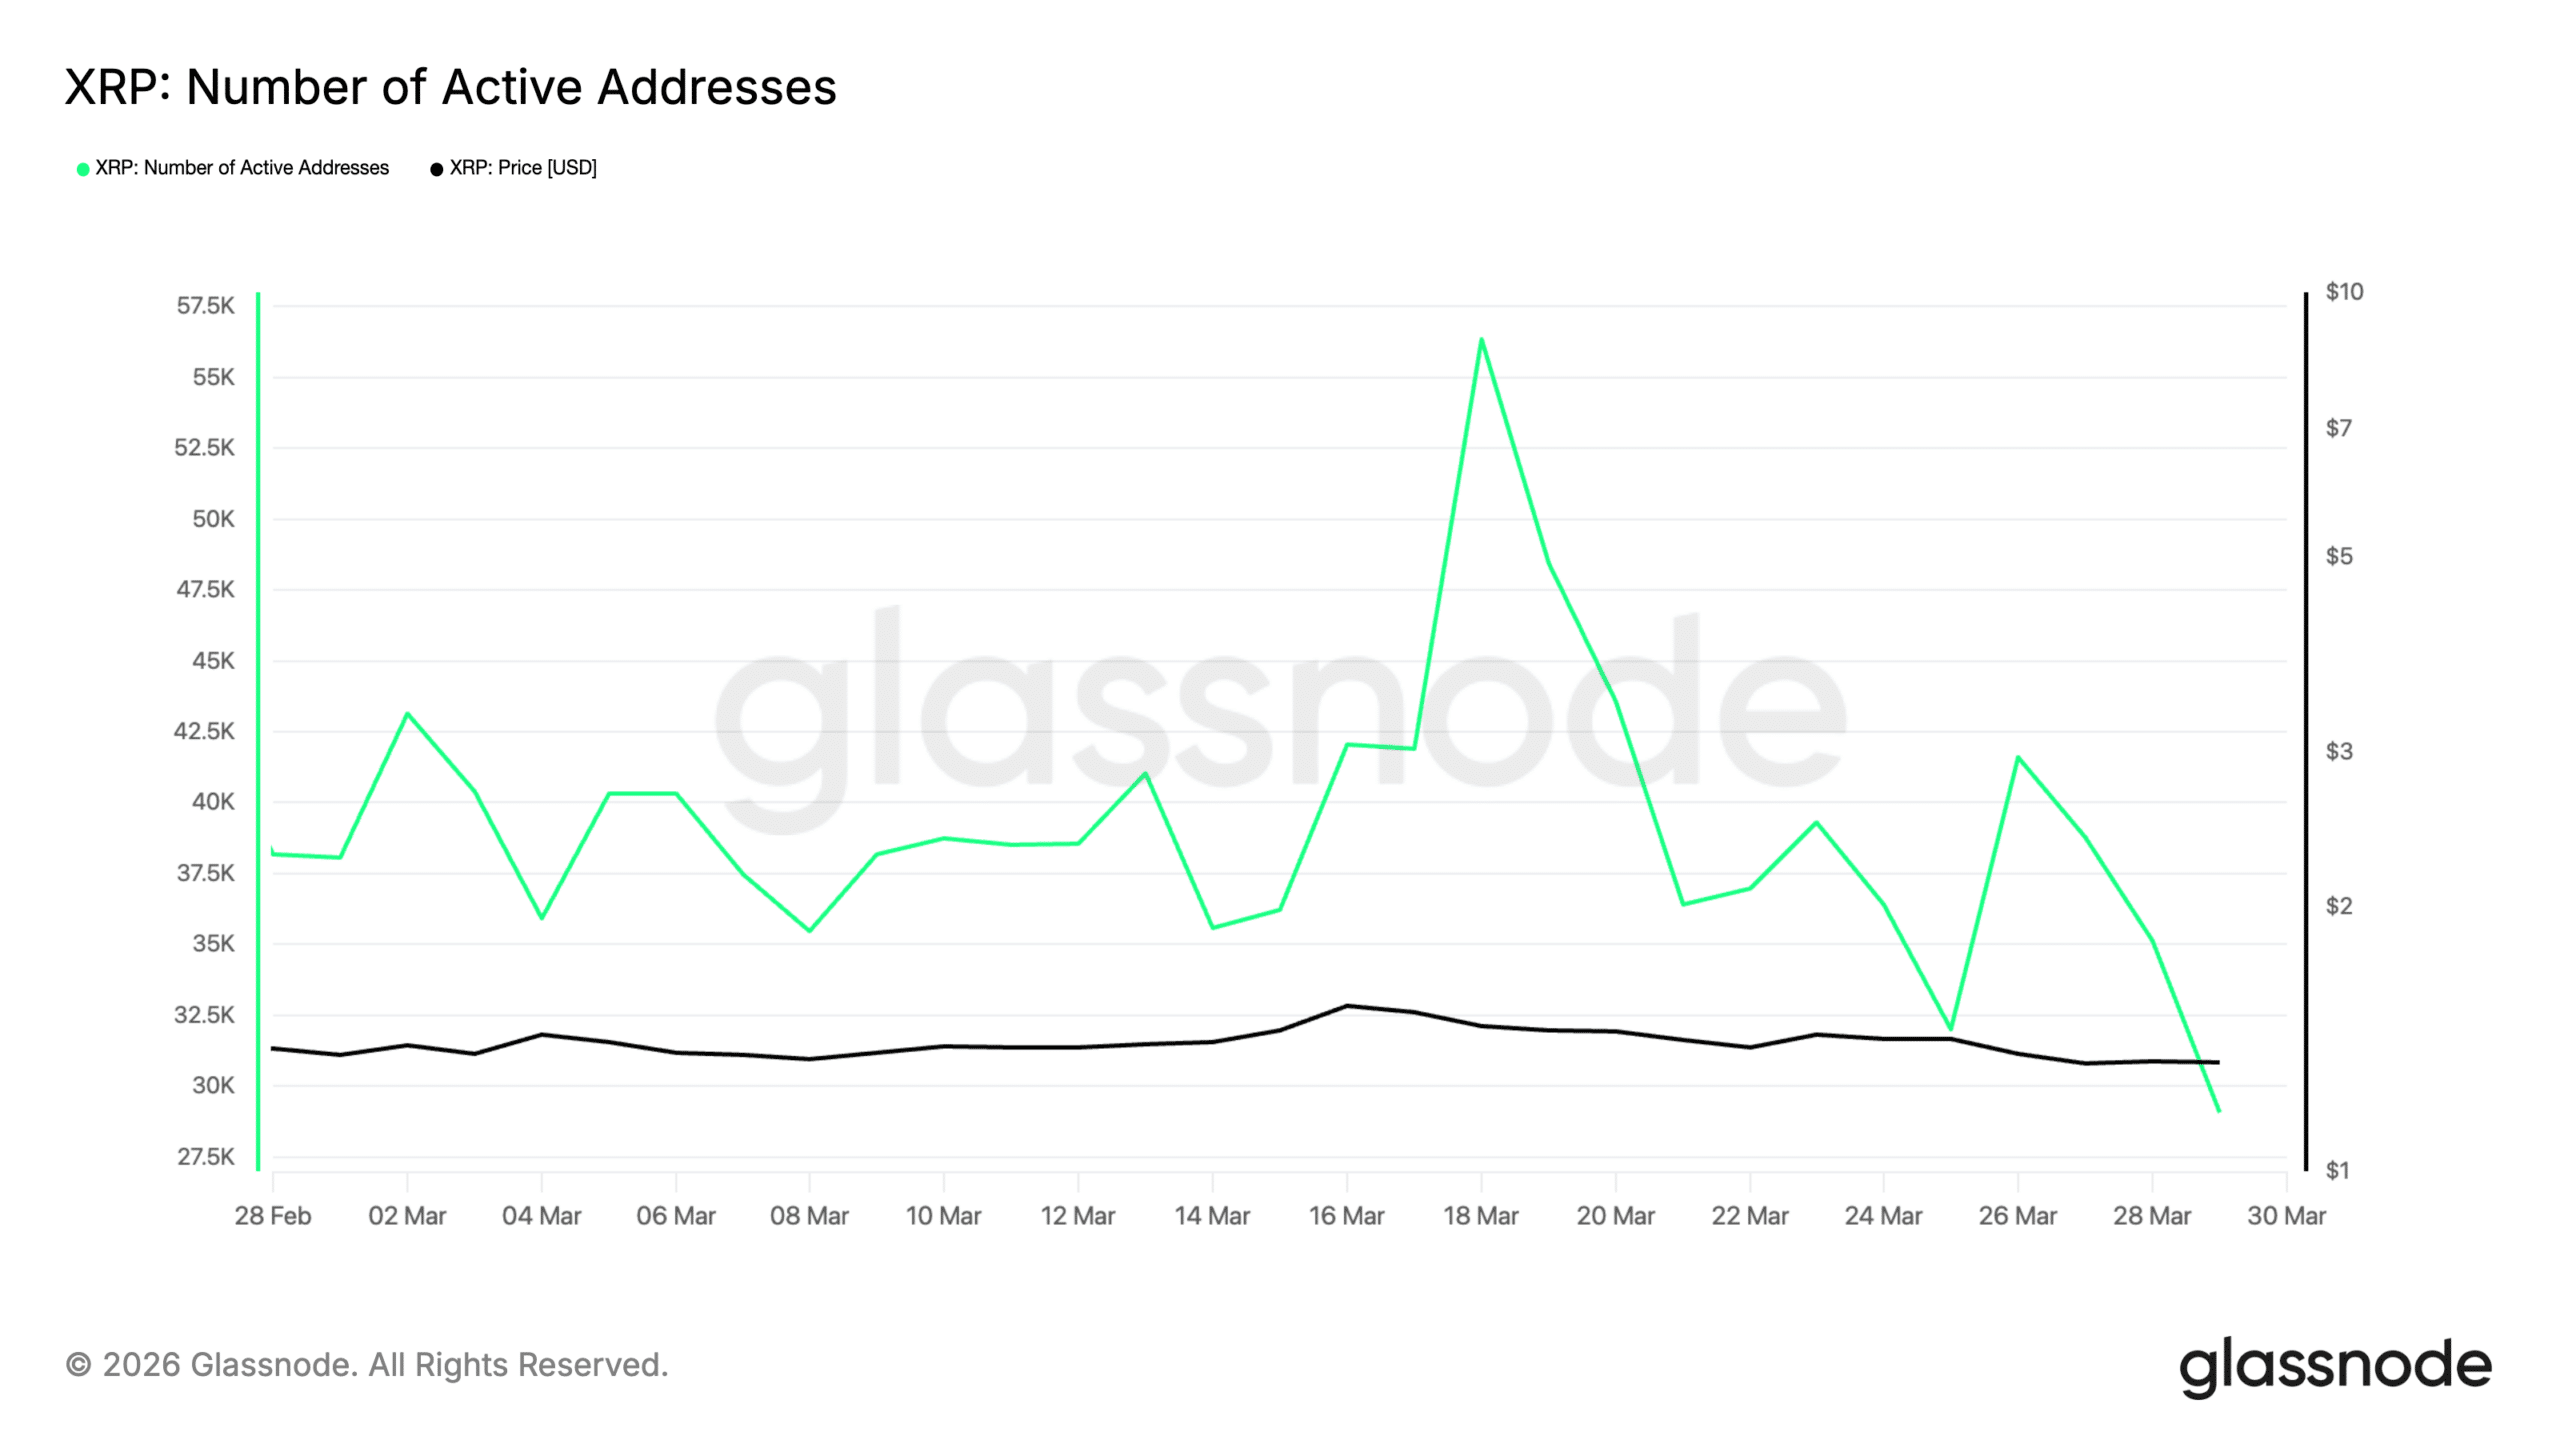
Lastly, though XRP was the winner, its network activity suggests that caution remains due to a sharp drop in active addresses in late March.

Source: Glassnode

The U.S faces the most choppy week

Now, while the U.S saw maximum outflows worth $454 million, Switzerland saw $4 million in outflows. Whereas Canada and Germany saw inflows worth $15.9 million and $21.2 million, respectively

However, as we move towards the end of March and with the 30th of March being the first day of a fresh week, the market is picking up again. The total crypto market cap is back in bullish hands, trading at $2.34 trillion at press time.

Yet despite this surge, investors should not be fooled by short-term booms, as even last week $635 millon had flowed in just before the Fed meeting and created optimism in the market.

However, as soon as the meeting drew to a conclusion, $405 million flowed out of the market, leaving investors in shock. Therefore, until situations calm down globally, short-term prices are not a clear sign for long-term market predictions.


Final Summary

  • The shift from inflows to outflows suggests that there is a lot of FUD in the market, and investors are positioning their bets cautiously.
  • Bitcoin is holding strong, but XRP stealing the spotlight highlights that investors are no longer just betting on Bitcoin.

Related Questions

QWhat was the total value of outflows from cryptocurrency investment funds in the last week of March, and what was the primary reason for this shift?

AThe total value of outflows was $414 million. The primary reasons were escalating global tensions involving the U.S. and Iran, high inflation, and growing expectations around the upcoming Federal Reserve meetings.

QWhich cryptocurrency was hit the hardest with outflows, and what was the specific amount?

AEthereum (ETH) was hit the hardest, recording $222 million worth of outflows.

QDespite the overall outflows, which digital asset was the only one to record inflows, and how much was it?

ARipple's XRP was the only digital asset to record inflows, worth $15.8 million.

QAccording to on-chain metrics from Santiment, what trend was observed for Bitcoin and Ethereum by the end of March?

ABoth Bitcoin and Ethereum saw a drop in their active address metrics by the end of March, suggesting reduced network activity.

QWhich country faced the maximum outflows, and what was the amount? Which countries saw inflows?

AThe U.S. faced the maximum outflows, worth $454 million. Canada and Germany saw inflows of $15.9 million and $21.2 million, respectively.

Related Reads

STRC Hits Historic Low, Saylor's Perpetual Motion Machine Grinds to a Halt

STRC, the perpetual preferred stock issued by MicroStrategy to fund its Bitcoin purchases, hit a historic low of $85.32, a 17% discount to its $100 par value. Designed as a "digital credit engine" to trade stably near par and enable continuous share issuance for buying Bitcoin, its plunge signals a breakdown in this model. Three key factors drove the decline: 1. Bitcoin's price fell over 50% from its peak, trading around $63,000 amid hawkish Fed signals. 2. MicroStrategy's cash reserves were depleted after a $1.5 billion convertible note repayment, slashing the dividend coverage for STRC's 11.5% yield to ~7 months. The company then sold 32 BTC to cover dividends—Michael Saylor's first Bitcoin sale since 2022—damaging the "never sell" narrative. 3. A competing Bitcoin-backed preferred stock, Strive's SATA, offers a higher yield (~13%) and daily dividends, drawing investors away from STRC. The drop triggers a negative cycle: STRC below par halts ATM share issuances, cutting off a key funding source for Bitcoin buys and potentially forcing more BTC sales for dividends, further eroding confidence. While Saylor argues the model is mathematically sound—needing only 2.3% annual Bitcoin growth to sustain itself—the market is testing the resilience of the leveraged Bitcoin treasury strategy in a bear market. The STRC price now reflects rising skepticism about this financial machinery's durability during downturns.

marsbit11m ago

STRC Hits Historic Low, Saylor's Perpetual Motion Machine Grinds to a Halt

marsbit11m ago

A Guide to Grayscale’s ‘Bottom Fishing’: Using Cash Flow to Assess Cryptocurrency Value

**Title:** Grayscale's Guide to Bottom-Fishing: Valuing Cryptoassets Using Cash Flows **Summary:** This report by Grayscale Research presents a fundamental valuation framework for cryptocurrency assets, moving beyond pure speculation to analyze those with underlying cash flows. It distinguishes between "commodity-like" assets (e.g., Bitcoin) and "cash-flow" assets, primarily within DeFi. Using the leading decentralized lending protocol Aave as a case study, the analysis applies traditional financial methodologies like Discounted Cash Flow (DCF) and Price-to-Earnings (P/E) multiples. Key findings indicate that AAVE tokens are currently undervalued. Despite recent challenges, the protocol's strong revenue growth, ~50% net profit margin, and diversified treasury support a fundamental valuation range of $80-$100 per token (compared to a ~$75 market price at the time of writing). In a base-case scenario driven by stablecoin adoption and regulatory clarity, the fair value could rise to around $175 within a year. The report emphasizes that protocol success does not automatically translate to token value. It critically examines the "value capture" mechanisms—such as buybacks, burns, and staking rewards—that channel protocol profits to token holders. Furthermore, it addresses the legal and governance complexities of Decentralized Autonomous Organizations (DAOs), noting their difference from traditional corporate equity but highlighting how robust, transparent governance can align protocol economics with holder interests. The conclusion is that the crypto market is maturing, with capital increasingly flowing towards projects with demonstrable fundamentals, real adoption, and disciplined capital allocation, creating opportunities for value-based investors.

marsbit1h ago

A Guide to Grayscale’s ‘Bottom Fishing’: Using Cash Flow to Assess Cryptocurrency Value

marsbit1h ago

After semiconductors lead the gains, are funds buying into AI orders or a macroeconomic rebound?

After US-Iran talks led to a temporary ceasefire and framework for reopening the strategic Strait of Hormuz, U.S. stocks rose on June 18, with the Nasdaq gaining 1.9%. The semiconductor and AI hardware sectors outperformed. This rally stemmed primarily from reduced geopolitical risk, which lowered oil prices and inflation expectations, easing discount rate pressure on high-valuation growth stocks like tech. The key question is not whether tech rebounded, but the nature of the rebound. The market appears to be selectively repricing AI infrastructure plays rather than broadly chasing AI narratives. Gains were concentrated in chips, optical interconnects, memory, and domestic manufacturing—segments tied to tangible data center build-outs and capital expenditure. Intel's ~10% surge, fueled by a Trump statement about potential Apple collaboration, exemplifies this mixed dynamic. It reflects policy catalysts and domestic manufacturing sentiment more than confirmed fundamentals. Meanwhile, strong earnings from companies like Astera Labs (revenue up 93% YoY) provided concrete evidence of AI-driven demand in hardware. In essence, the rally represents a risk-premium recalibration. Lower Middle East tensions opened a valuation repair window, and capital flowed first into AI infrastructure segments with visible near-term revenue streams. The sustainability of this move hinges on upcoming Q2 earnings, specifically continued strength in cloud provider capex, AI server orders, and hardware company guidance. Policy hopes alone are insufficient; the cycle needs validation from orders and financials.

marsbit1h ago

After semiconductors lead the gains, are funds buying into AI orders or a macroeconomic rebound?

marsbit1h ago

Trading

Spot
Futures
活动图片