Ethena rallies 14.5% in a day, but THIS will limit further gains

ambcryptoPublished on 2026-04-09Last updated on 2026-04-09

Abstract

Ethena (ENA) rallied 14.6% in 24 hours, extending gains from earlier in the week, partly driven by a broader crypto market boost following former President Trump's ceasefire announcement. The project's plan to diversify its USDe stablecoin reserves into non-crypto assets has also contributed to positive momentum, aiming to address declining yields and supply since the October 2025 market downturn. Despite the recent surge, ENA's overall trend remains bearish. Technical analysis on the 1-day chart shows lower highs, with the RSI below 50 and declining OBV, indicating sustained selling pressure. The price has struggled to break the key $0.095-$0.10 resistance zone, where a cluster of short liquidations is located. The 4-hour chart structure is also bearish, and a break above $0.095 is needed to shift momentum bullishly. Traders are advised to consider taking profits near current levels, as the relief rally may be over, and a downward move could follow. The resistance band remains a significant barrier to further gains.

Ethena [ENA] has rallied 14.6% over the past 24 hours, extending the gains it made on Monday, the 6th of April. The crypto market saw a bullish boost from the short liquidations that followed President Trump’s ceasefire announcement.

Ethena plans to diversify its USDe reserve assets into non-crypto assets, which is why ENA has been rallying even before the announcement. The crypto rout since October 2025 saw declining USDe supply and yield.

The protocol’s founder, Gary Young, had said that Ethena was poorly positioned since that crash. Including non-crypto reserve assets will boost its falling yield and aid market performance.

ENA’s trend remains bearishly poised
Source: ENA/USDT on TradingView

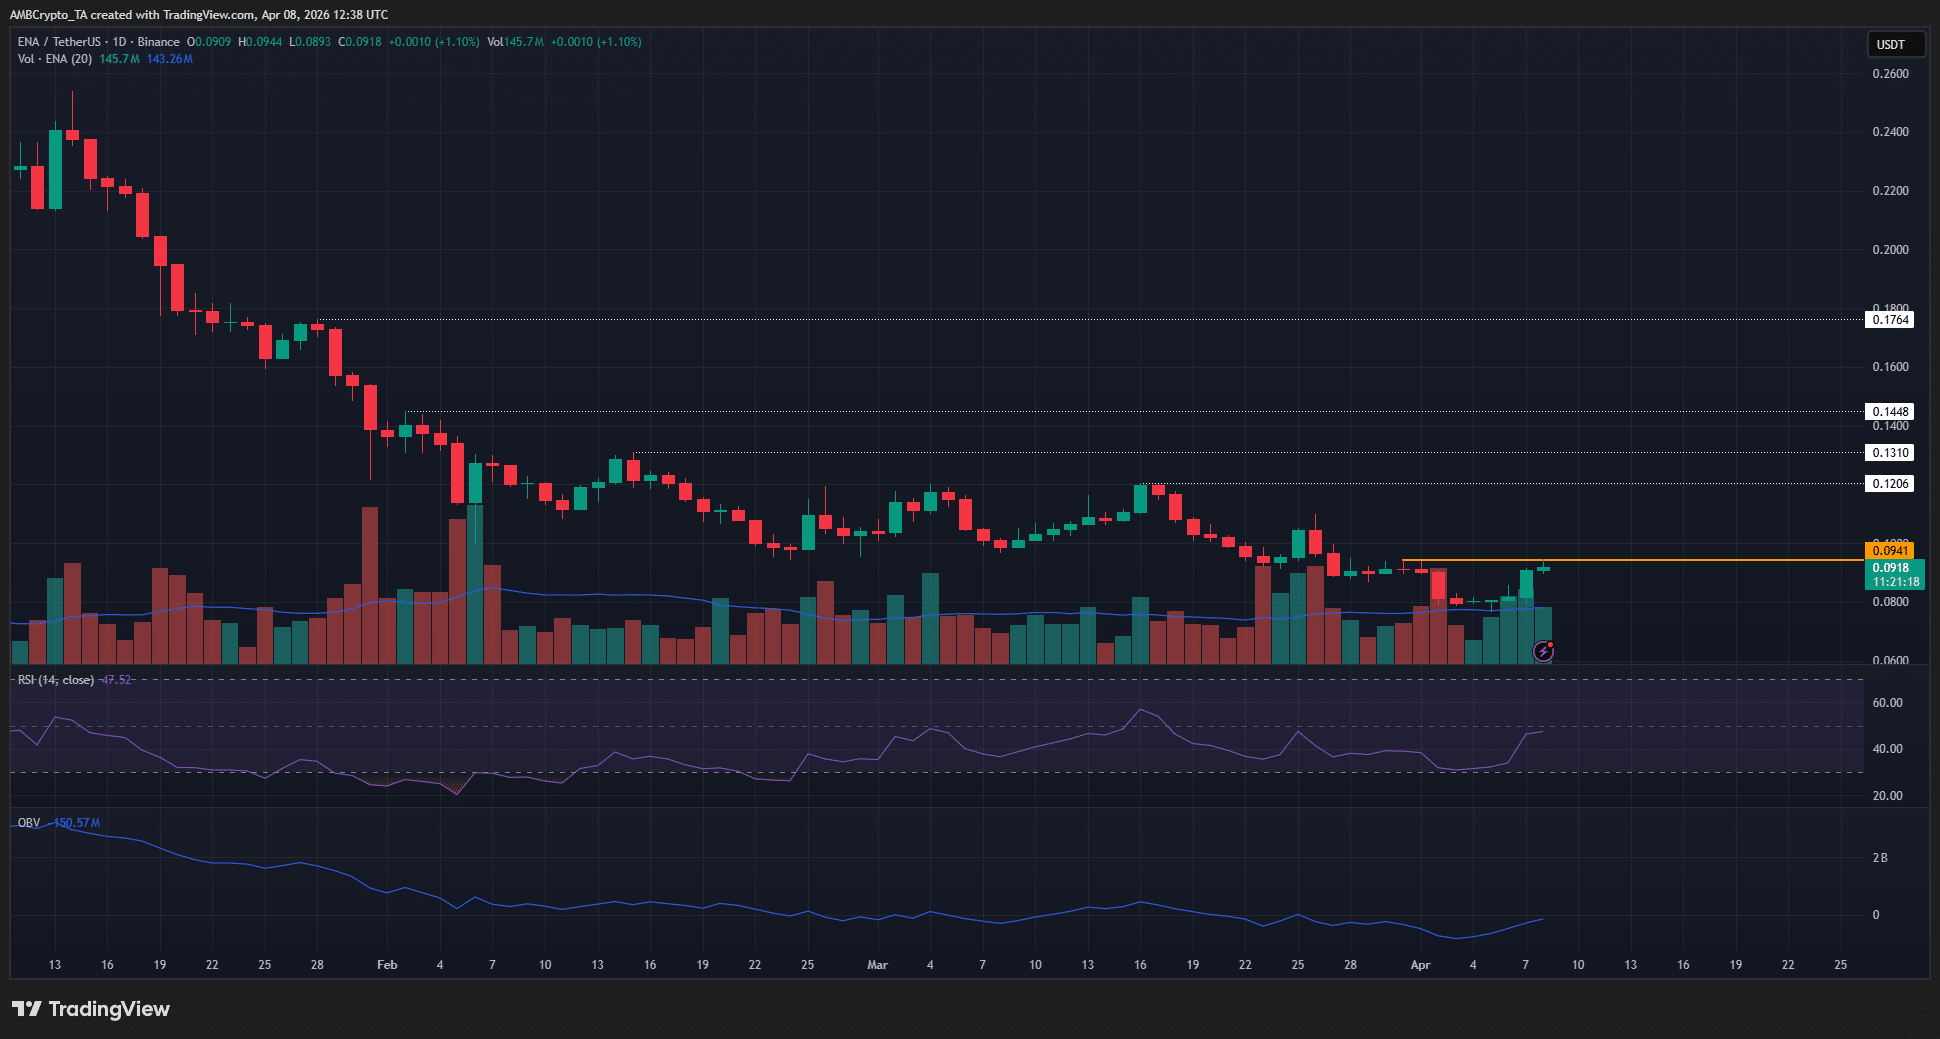
The lower highs on the 1-day timeframe, highlighted in white, showed that Ethena continued to labor under a bearish trend. The RSI was below neutral 50, and the OBV was in a slump, too.

This showed that the trend, selling pressure, and market structure were all in favor of the sellers. Even the rally in recent days, though it was high-volume, was unable to convincingly smash past the $0.094 local highs.

This was a complication for ENA bulls. Or, in a way, some pessimistic participants would say it makes the picture clearer. The sweep of the $0.095-$0.10 local highs means that the Ethena relief rally is over.

A new leg downward can commence from these liquidity pockets.

Traders’ call to action – Sell
Source: CoinGlass

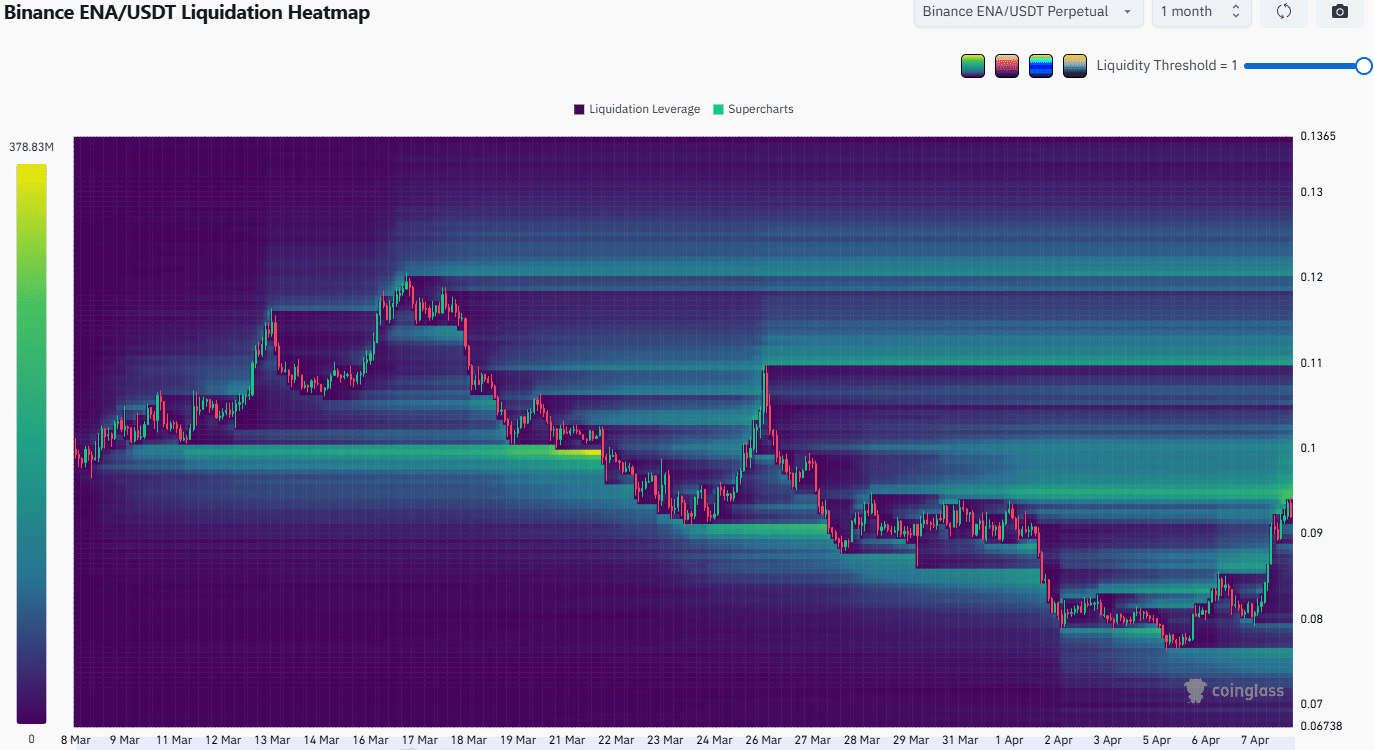
The past month’s liquidation heatmap showed a cluster of short liquidations from $0.094 to $0.10. This was the same band of resistance that the price has struggled to clear in the past 12 hours of trading.
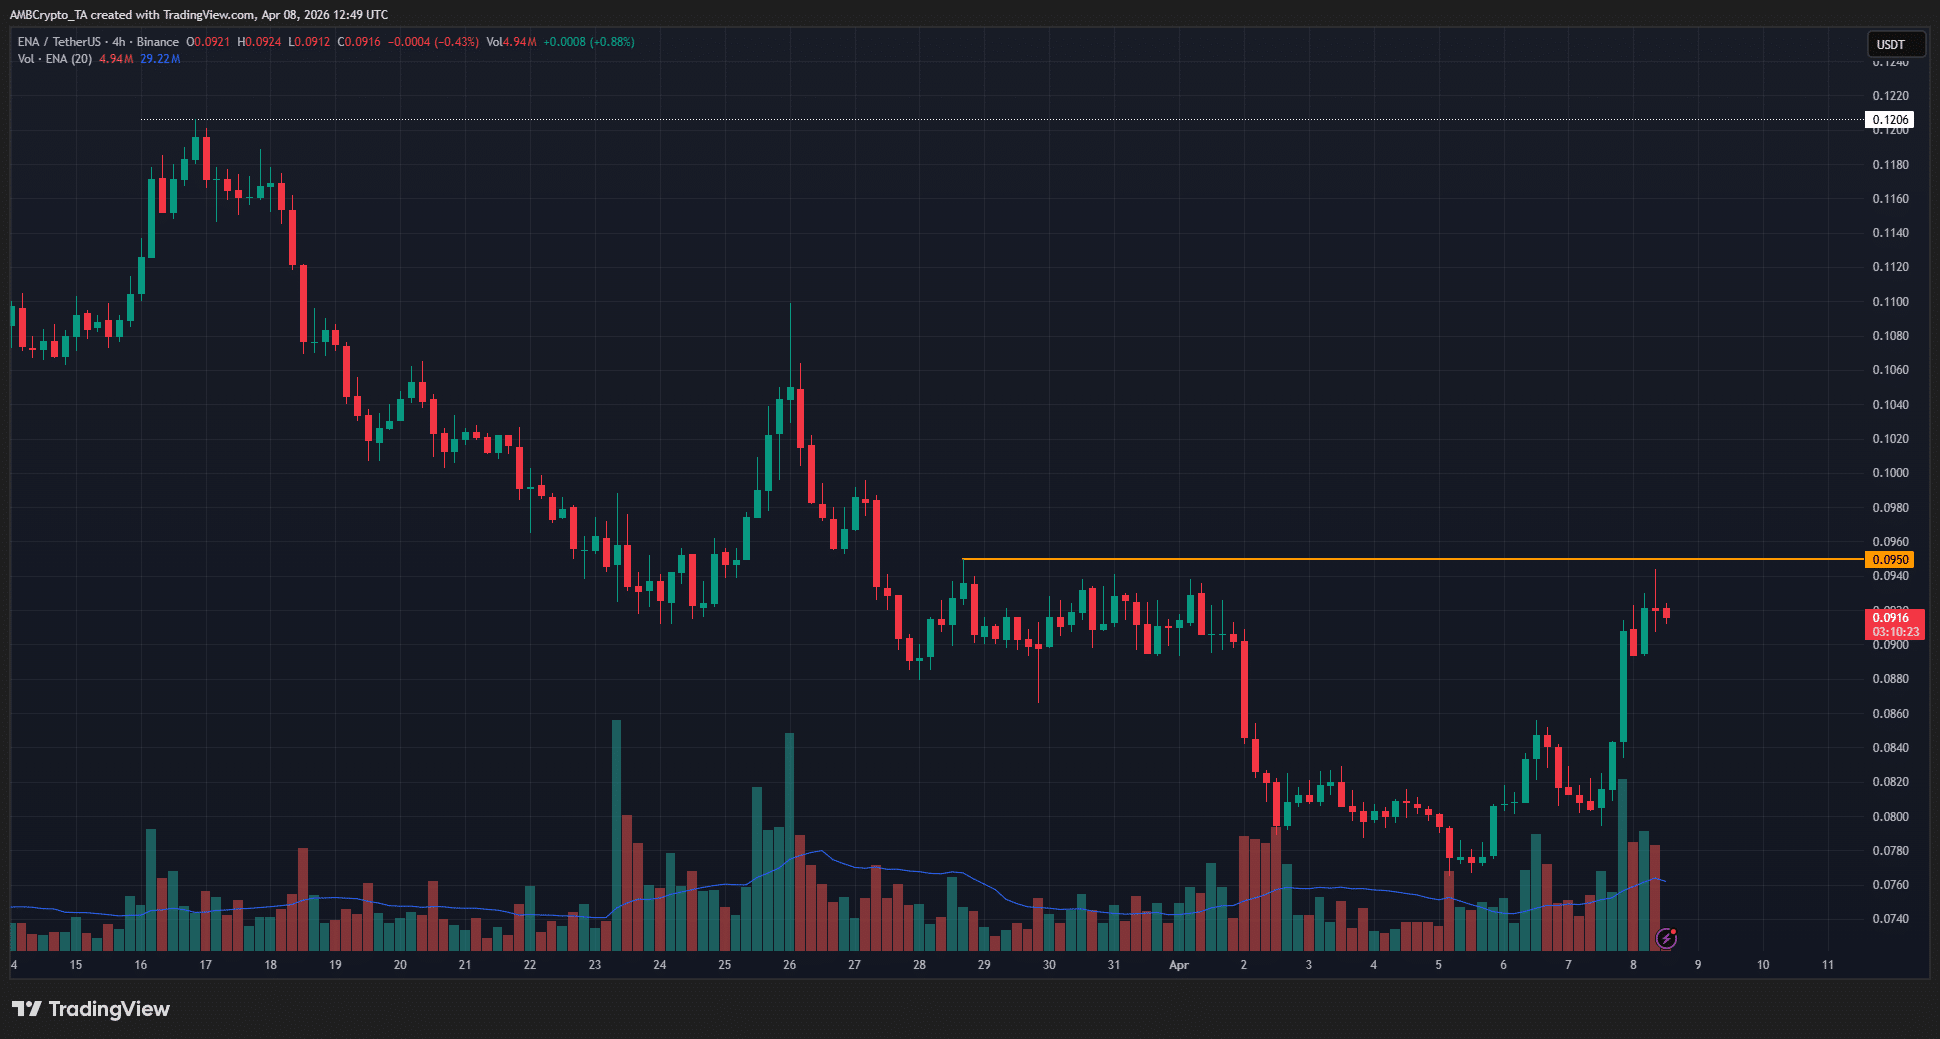
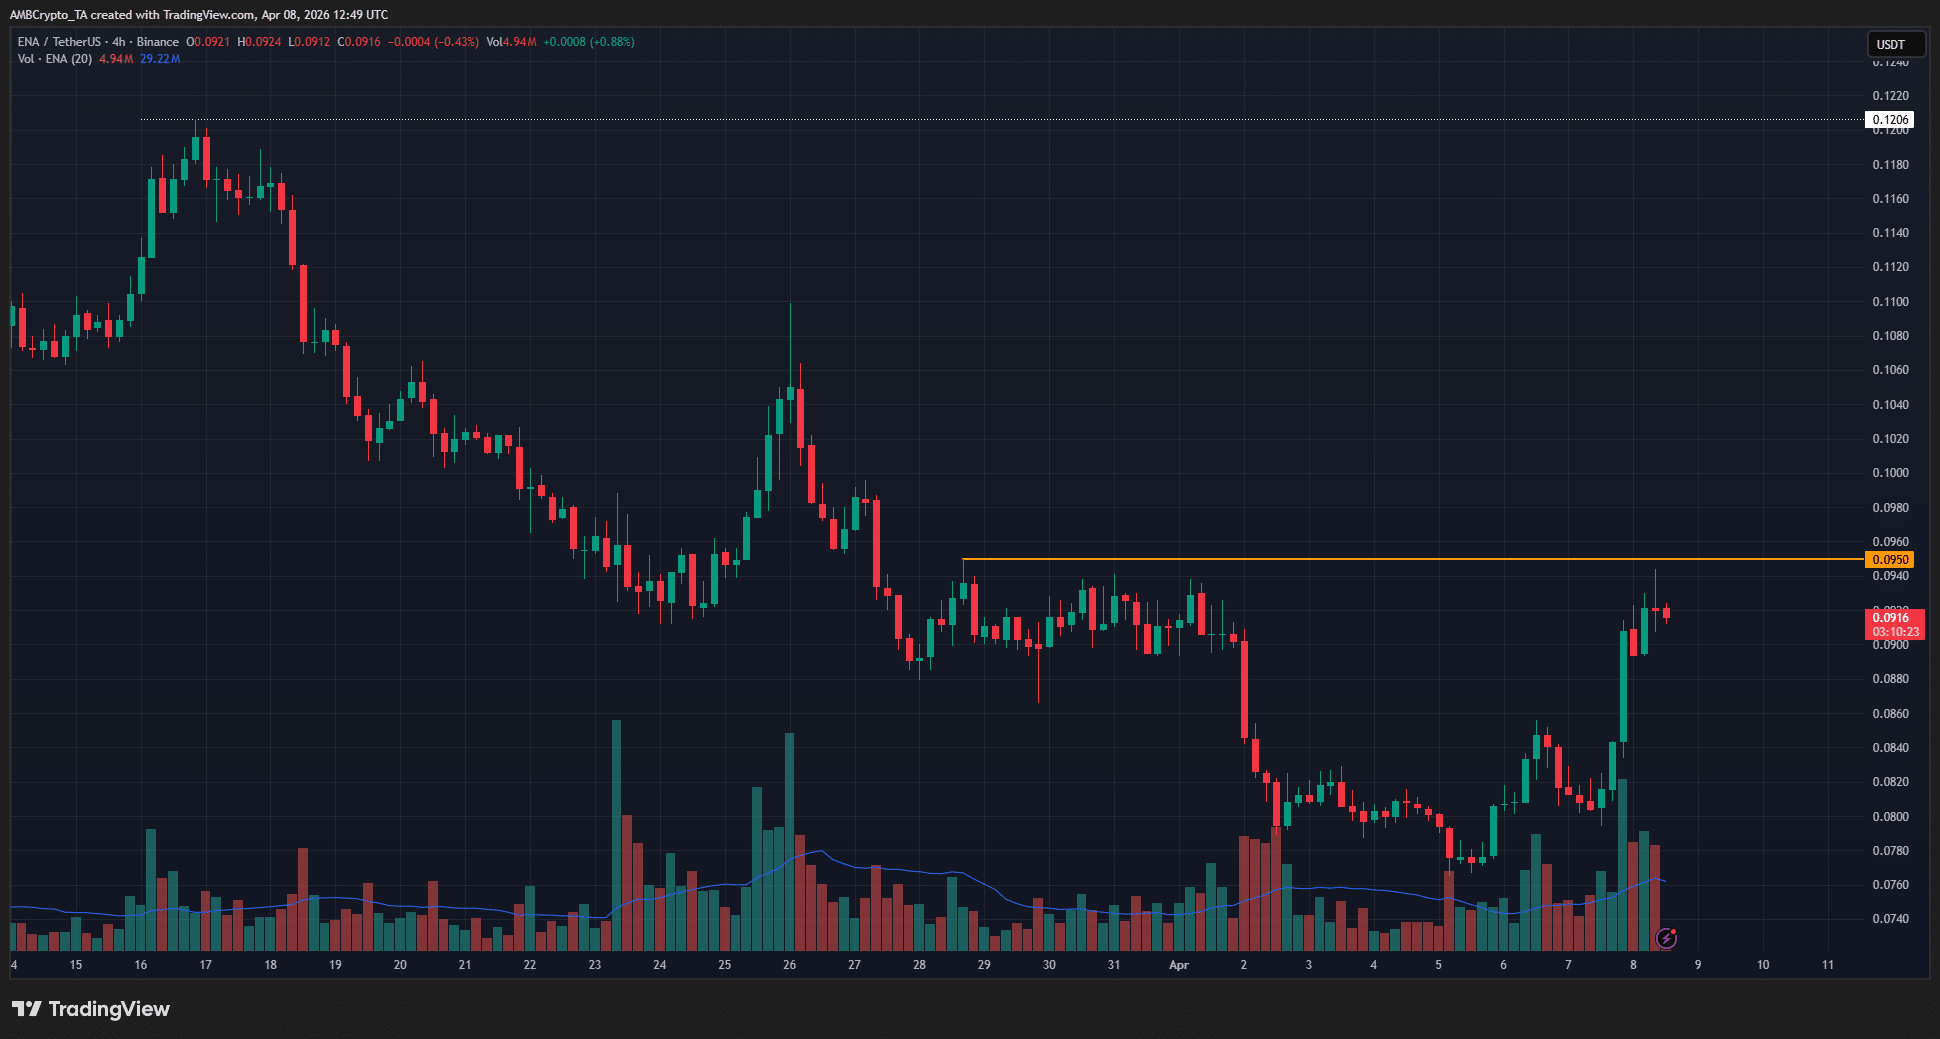
Source: ENA/USDT on TradingView

The 4-hour timeframe’s structure remained bearish. The $0.095 level must be beaten for the swing structure to shift bullishly. A breakout and retest as support can inform bulls that the momentum might continue.

Until then, traders can maintain a bearish bias and look to take profits from the bounce.


Final Summary

  • Ethena has racked up sizeable gains since the start of the week and was aided by the ceasefire announcement and crypto market bounce.
  • The $0.095-$0.10 resistance level remained in place, and traders should be prepared to take profits in this area as the swing structure remained bearish.


Related Questions

QWhat was the main reason behind Ethena's 14.6% price rally in the past 24 hours?

AThe rally was primarily driven by a bullish boost from short liquidations following President Trump's ceasefire announcement, as well as Ethena's plan to diversify its USDe reserve assets into non-crypto assets.

QWhy is Ethena planning to diversify its USDe reserve assets into non-crypto assets?

AThe diversification aims to boost Ethena's falling yield and improve market performance, as the crypto rout since October 2025 led to declining USDe supply and yield, leaving the protocol poorly positioned.

QWhat key resistance level is ENA struggling to break, according to the technical analysis?

AENA is struggling to break the $0.095-$0.10 resistance level, which has been a significant barrier despite recent high-volume rallies.

QWhat do the RSI and OBV indicators suggest about ENA's market trend?

AThe RSI is below the neutral 50 level, and the OBV is in a slump, indicating that the trend, selling pressure, and market structure are all in favor of sellers.

QWhat trading bias does the article recommend for ENA based on its current market structure?

AThe article recommends maintaining a bearish bias and taking profits from the bounce, as the swing structure remains bearish unless ENA convincingly breaks and holds above $0.095.

Related Reads

Interview with Robinhood Executive: Meme + Tokenized US Stocks as "Barbell" Customer Acquisition Strategy, All Business Lines Achieve Hundreds of Millions in Revenue

Interview with Robinhood executive Johann Kerbrat reveals the company's "barbell" customer acquisition strategy for its new Robinhood Chain, combining meme tokens with tokenized stocks. Three weeks after mainnet launch, the chain has seen over $3B in weekly DEX volume and 105M transactions. Kerbrat explains the logic behind the permissionless chain: meme tokens attract DeFi users, while tokenized real-world assets (RWA), currently over 90 US stocks and ETFs accessible in 120+ countries, serve global users. The goal is to bring Robinhood's 27 million funded accounts on-chain by simplifying DeFi with a user-friendly interface, exemplified by features like Robinhood Earn which offers yield without requiring wallet management. Built on Arbitrum's technology stack for its speed, low cost, and Ethereum's security, the chain focuses on financial products like Earn, spot trading, and perpetuals. Kerbrat downplays direct competition with platforms like Base, emphasizing the goal of expanding the overall market for on-chain assets. He details selective partnerships (e.g., Morpho, Lighter) based on compliance, unique UX, and differentiation. While regulatory clarity is pending for US perpetuals, the expansion continues via Bitstamp in Europe. Finally, Kerbrat positions Robinhood as a "super app" integrating stocks, options, crypto, banking, and AI trading, with all major business lines generating hundreds of millions in revenue. For the chain, current priority is driving adoption over maximizing gas fee revenue.

marsbit15m ago

Interview with Robinhood Executive: Meme + Tokenized US Stocks as "Barbell" Customer Acquisition Strategy, All Business Lines Achieve Hundreds of Millions in Revenue

marsbit15m ago

Fidelity Q3 Report: BTC, ETH, and SOL Continue to Build Bottoms; How Much Further Will This Crypto Bear Market Go?

Fidelity's Q3 Crypto Signal Report analyzes the current bear market, noting Bitcoin (BTC), Ethereum (ETH), and Solana (SOL) are in a prolonged bottoming phase. Key indicators like the weighted Net Unrealized Profit/Loss (NUPL) have turned negative (-0.01), signaling the market is slightly below its aggregate cost basis, with BTC acting as the primary stabilizing asset. BTC's dominance has risen to 68%, indicating a lack of capital rotation to other digital assets. Performance has been weak across the board, with BTC, ETH, and SOL down significantly year-to-date. Market sentiment is depressed, exacerbated by substantial outflows from spot ETPs and a challenging macro environment. The report compares the current ~203-day downtrend to historical ~300-day bottoming cycles, suggesting the process may be two-thirds complete, with late 2026 as a potential timeframe to monitor. For Bitcoin, NUPL at 0.09 indicates cautious sentiment, while momentum signals remain negative. The Yardstick metric points to potential undervaluation relative to network security (hashrate). Ethereum's NUPL is deep in the "capitulation" zone at -0.43, a historically positive signal for future returns, though its momentum and network fee revenue are negative. Solana shows the deepest NUPL at -0.72 but demonstrates relative resilience in on-chain activity and stablecoin transfer volume. The report concludes that while several metrics are near historical capitulation levels, a definitive market bottom has not yet been established. The path forward likely involves continued consolidation, with BTC's relative strength and fundamental on-chain usage for ETH and SOL providing key areas for investor observation.

marsbit29m ago

Fidelity Q3 Report: BTC, ETH, and SOL Continue to Build Bottoms; How Much Further Will This Crypto Bear Market Go?

marsbit29m ago

Trading

Spot
活动图片