Global Asset Plunge: Hormuz, Chips, and a Korean Holiday

marsbitPublished on 2026-03-04Last updated on 2026-03-04

Abstract

A major geopolitical shock occurred on February 28th when a US-Israel coalition launched a massive airstrike on Iran, resulting in significant global market turmoil. This event served as a severe stress test for popular financial narratives, particularly the "debasement trade" which posits that gold and Bitcoin act as hedges against currency devaluation during crises. Initially, gold spiked but then fell over 4%, while silver plummeted 8%. Bitcoin remained largely stagnant. Contrary to expectations, the US Dollar Index rose 1.1%. The core insight was that in an acute crisis, the US dollar, due to its deep liquidity, became the primary safe-haven asset as investors rushed to cover margins and deleverage. South Korea's market, closed for a holiday, experienced a delayed and extreme reaction, with the KOSPI crashing 7.24% upon reopening. This sell-off was exacerbated by high retail leverage and concentrated exposure in key semiconductor firms like Samsung and SK Hynix, critical to the global AI supply chain. The conflict also raised fears about oil supply disruptions via the Strait of Hormuz, directly impacting energy-dependent economies and manufacturing. The event demonstrated that while long-term narratives about dollar debasement and the rise of hard assets remain valid, acute crises overwhelmingly favor dollar liquidity. In moments of panic, the financial system's architecture ensures that the dollar remains the ultimate refuge.

On February 28, the US-Israel coalition launched the "Epic Fury" operation against Iran, carrying out airstrikes on over 2,000 targets. Supreme Leader Khamenei was killed in the attack.

This is the largest geopolitical event to occur in the Middle East in decades.

Global capital waited through an entire weekend to verify one question: Were the narratives they had bet on for two years actually true? Is gold a hard asset in troubled times? Is Bitcoin digital gold? Is the debasement trade a real proposition or a narrative bubble?

The results are in.

Gold first rose to $5,400, then fell over 4% along with stocks. Silver plummeted 8% in a single day. Bitcoin fell initially, then fluctuated, ultimately ending up back where it started. The US Dollar Index rose 1.1%.

Narrative Stress Test

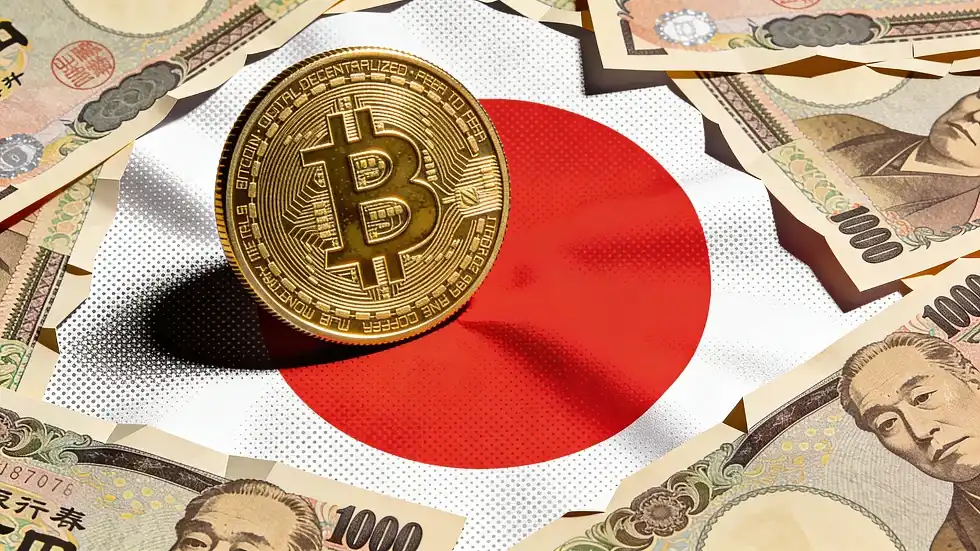
Over the past two years, a nearly flawless narrative has been popular in crypto and macro circles: out-of-control US debt, long-term dollar devaluation, with gold and BTC being hard assets that hedge against currency dilution, collectively known as the "debasement trade." In 2025, the data supporting this narrative seemed incredibly solid—gold rose over 50% for the year, BTC reached a high of $126,000, the US Dollar Index fell nearly 11%, marking its worst first-half performance in 50 years. Ken Griffin of Citadel repeatedly mentioned this term in public, and BlackRock's BTC ETF assets under management approached $100 billion.

The core implicit assumption of this narrative is: When a real crisis hits, people will flee the dollar and rush to hard assets.

Last weekend, this assumption faced its first real-intensity stress test.

At Monday's open, gold did rise initially—spot gold in London hit a high of $5,418 intraday, nearly matching the all-time high from late January. But then, as oil prices continued to soar, inflation expectations reignited, and the market began repricing the Fed's rate cut path, everything reversed. Gold closed lower on the day and fell further by over 4% on Tuesday, returning to levels last seen on February 20.

Silver fared worse. It broke above $96 on Monday, then saw intraday losses approaching 8% on Tuesday.

The reason is straightforward. Soaring oil prices mean rising inflation expectations, which mean reduced room for the Fed to cut rates, which means a stronger dollar. A stronger dollar is the direct counterpart to gold and silver. Add in forced liquidations triggered by a synchronous sell-off across all risk assets, and gold and silver, at the "time they should have risen the most," became the most liquid and easiest positions to sell.

This isn't the first time. When the Russia-Ukraine war broke out in 2022, BTC did not act as a safe haven; it fell along with the Nasdaq. Gold rose initially but was later sold off by profit-takers—the same script, just greater intensity.

BTC's situation is more awkward. That weekend the war started, the crypto market was the only market still trading. BTC fell from around $66,000 to below $64,000, then quickly rebounded, largely filling the gap before traditional markets opened on Monday. Superficially, this looks like "resilience." But the truth is: institutional money hadn't entered yet; it was retail investors and arbitrageurs finding direction amidst the volatility. On Tuesday, as the broader sell-off continued, BTC came under pressure again, hovering around $68,000. It neither showed the rise expected of "digital gold" nor the significant drop expected of a "risk asset"—it just... lingered there.

Hormuz, Chips, and a Korean Holiday

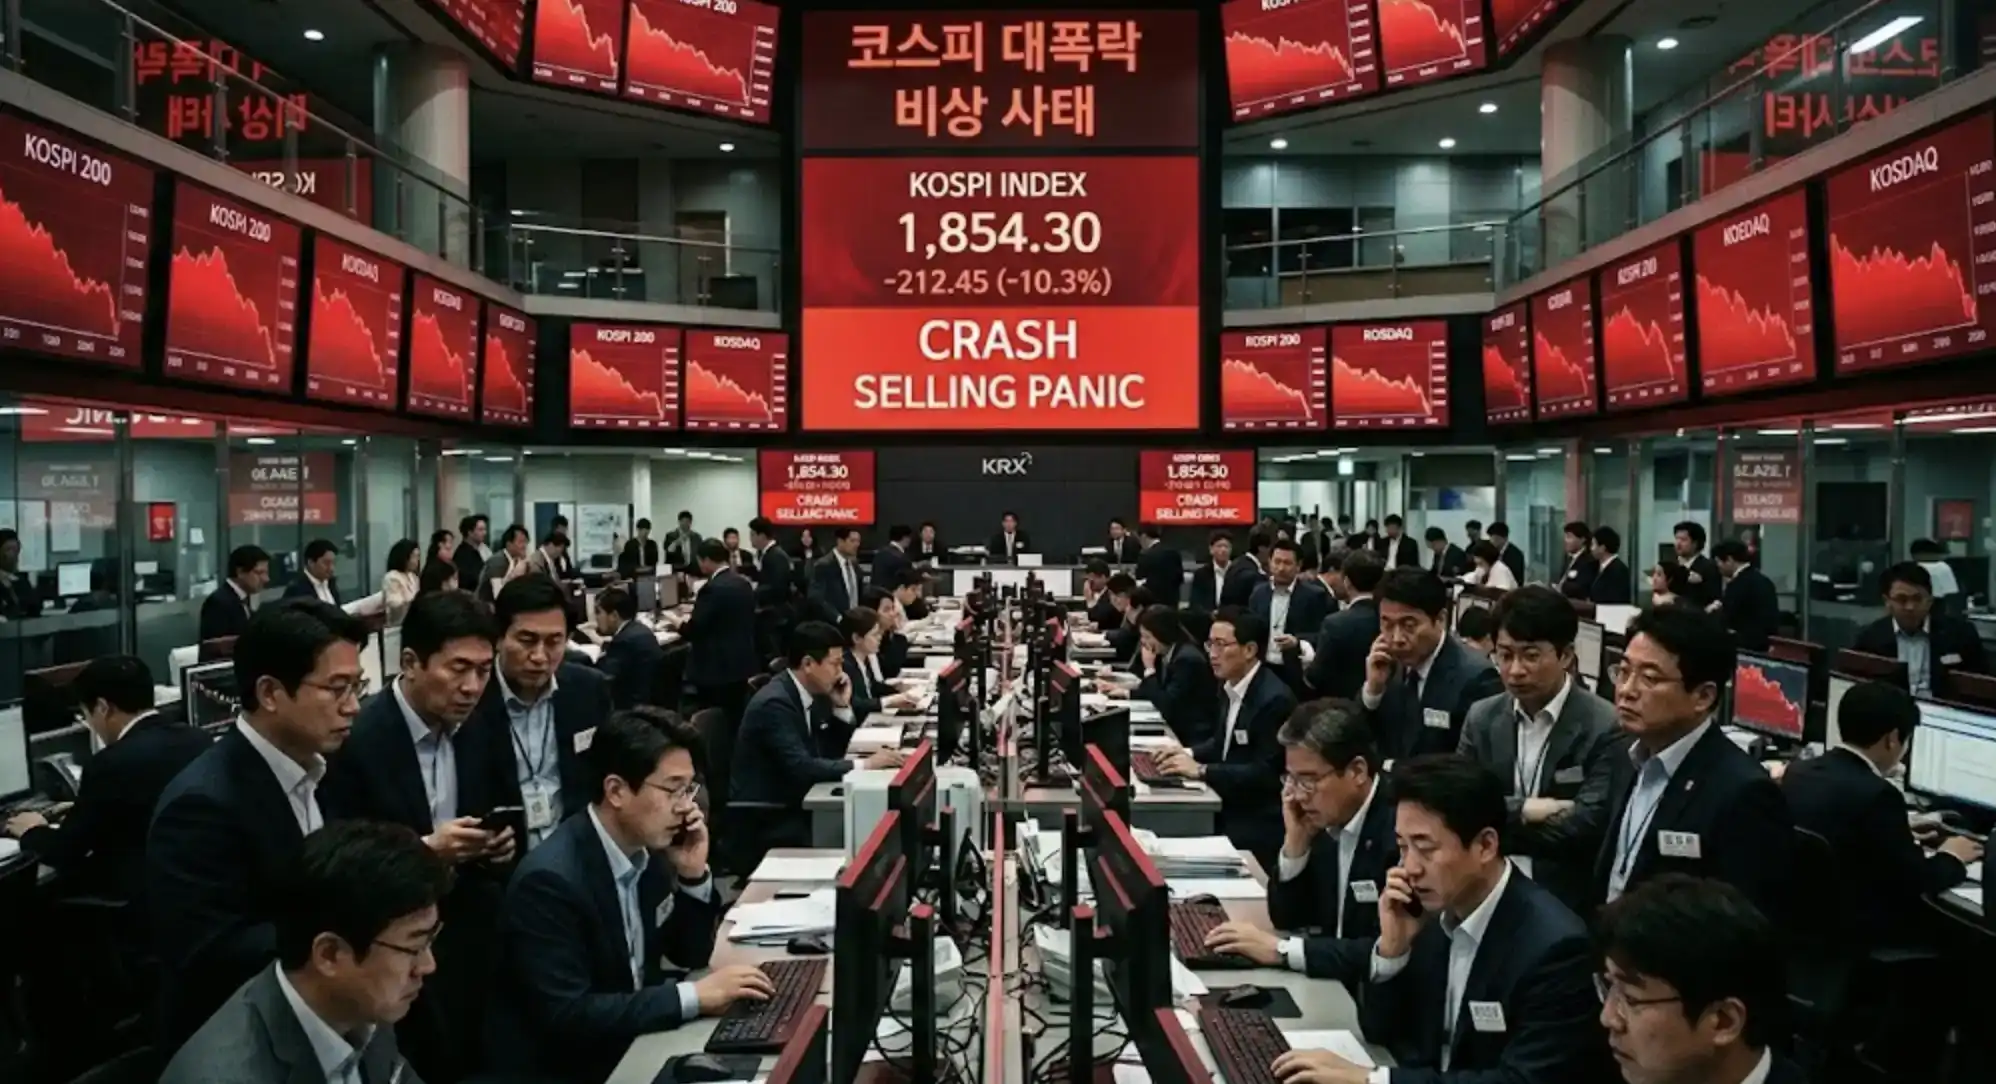
The stampede in Seoul was particularly severe for one structural reason: Monday was Samiljeol, a national holiday in South Korea, and the exchanges were closed.

Panic built up over the weekend with no outlet. At 9 AM on Tuesday, all the sell orders that couldn't be executed during the three-day holiday hit the market at the same second. The KOSPI opened directly triggering a circuit breaker warning, ultimately closing down 7.24%, wiping out approximately 377 trillion won in market value in a single day, equivalent to about $257 billion USD.

This was the largest single-day drop since the Yen carry trade crisis in August 2024. That time, the KOSPI plummeted 8.77% in a day, triggered by a crashed US non-farm payrolls report and a surprise rate hike by the Bank of Japan—a systematic unwinding of financial leverage. This time, the direct trigger was geopolitics—but behind it was同样 a tightly stretched string, just made of different material.

Over the past year and a half, Korean retail investors experienced an epic FOMO cycle. The KOSPI rose from 2400 points at the end of 2024 to break through 6000 points by the end of February this year, a gain of nearly 150% in 14 months. Some brokerages raised their target prices to 7000, even 8000. The number of trading accounts exceeded 100 million in January this year—a country of 50 million people has 100 million stock accounts. The Korean government even included "KOSPI 5000" in its policy agenda as a national policy goal.

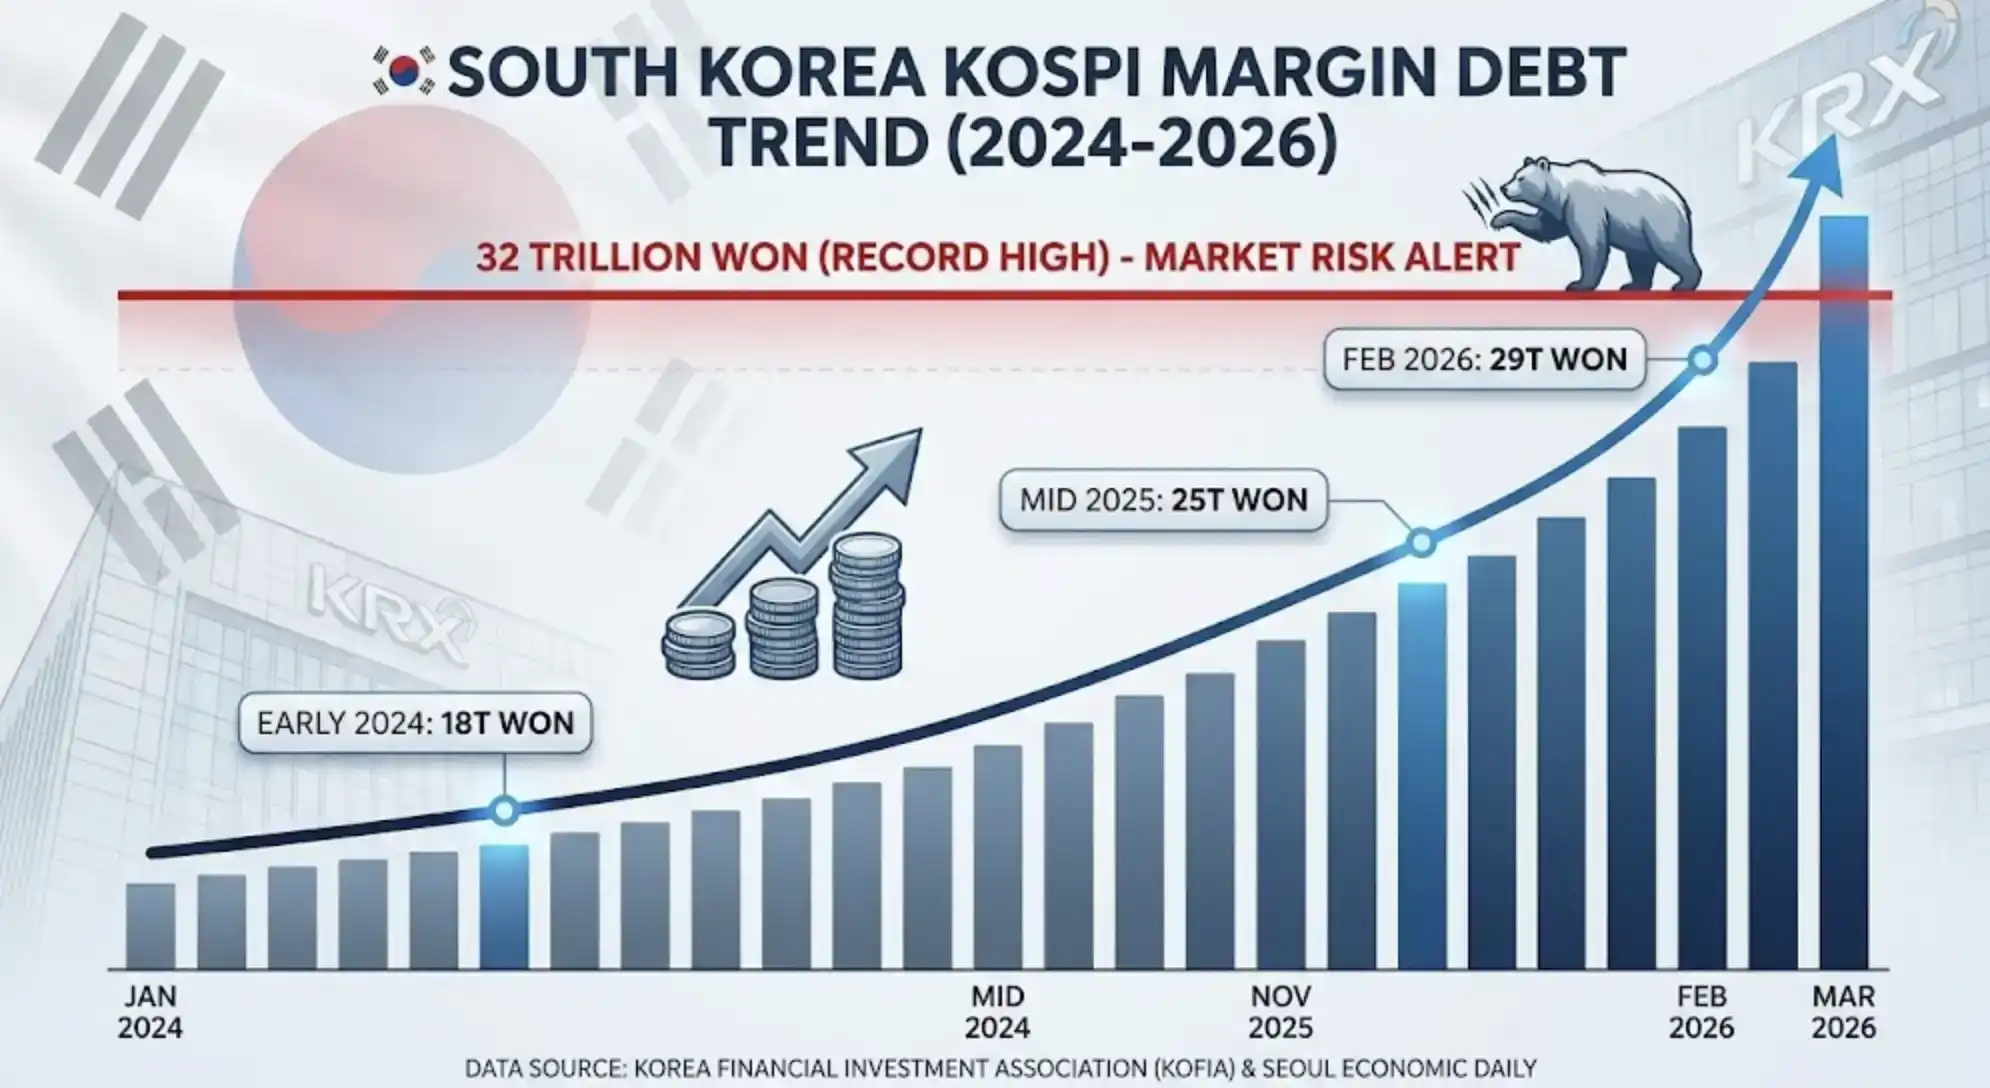
At the same time, margin debt also expanded同步. As of before the incident, the outstanding balance of on-exchange margin loans in South Korea exceeded 32 trillion won, approximately $22.4 billion USD, the highest level since 2021. The outstanding balance of stock pledge loans was another 26 trillion won, bringing the total to nearly $37 billion USD. The market fear gauge, VKOSPI, had already soared to 54 by the end of February, more than double the "normal" level—the entire market, while hitting new highs, had entered an extreme fear zone.

This structure, when hit with an acute shock, leads to a textbook liquidity squeeze.

Falling stock prices trigger margin calls, brokers initiate forced liquidations, liquidations further depress stock prices, lower prices trigger more margin calls—a self-reinforcing feedback loop. Foreign investors net sold over 5.17 trillion won on this day, about $3.5 billion USD, the largest single-day net selloff this year. Retail investors did the opposite: buying the dip during the stampede, continuing to add leveraged ETFs, betting on a rebound.

Other Asian markets were under pressure同步. The Nikkei 225 fell 3% that day, with Toyota down 5.5% and Sony down 4.3%. The Hong Kong Hang Seng fell 2.1%, leading the decline in the Asia-Pacific region. The Stock Exchange of Thailand announced a suspension of short selling for most securities. The broader MSCI Asia Pacific index fell about 2%.

But the core structural fragility was in Seoul.

What fell wasn't just stocks. It was the KOSPI market, which had been repeatedly narrated as the "best proxy for the AI super cycle." Samsung Electronics fell nearly 10%, breaking below the key psychological support level of 200,000 won. SK Hynix fell 11.5%. These two companies together account for about 40% of the KOSPI's market capitalization and are also the two most critical nodes in the global AI chip supply chain—Samsung is the world's largest DRAM and NAND flash memory manufacturer, SK Hynix is a core supplier of HBM (High Bandwidth Memory), the memory used in most of Nvidia's AI GPUs comes from here.

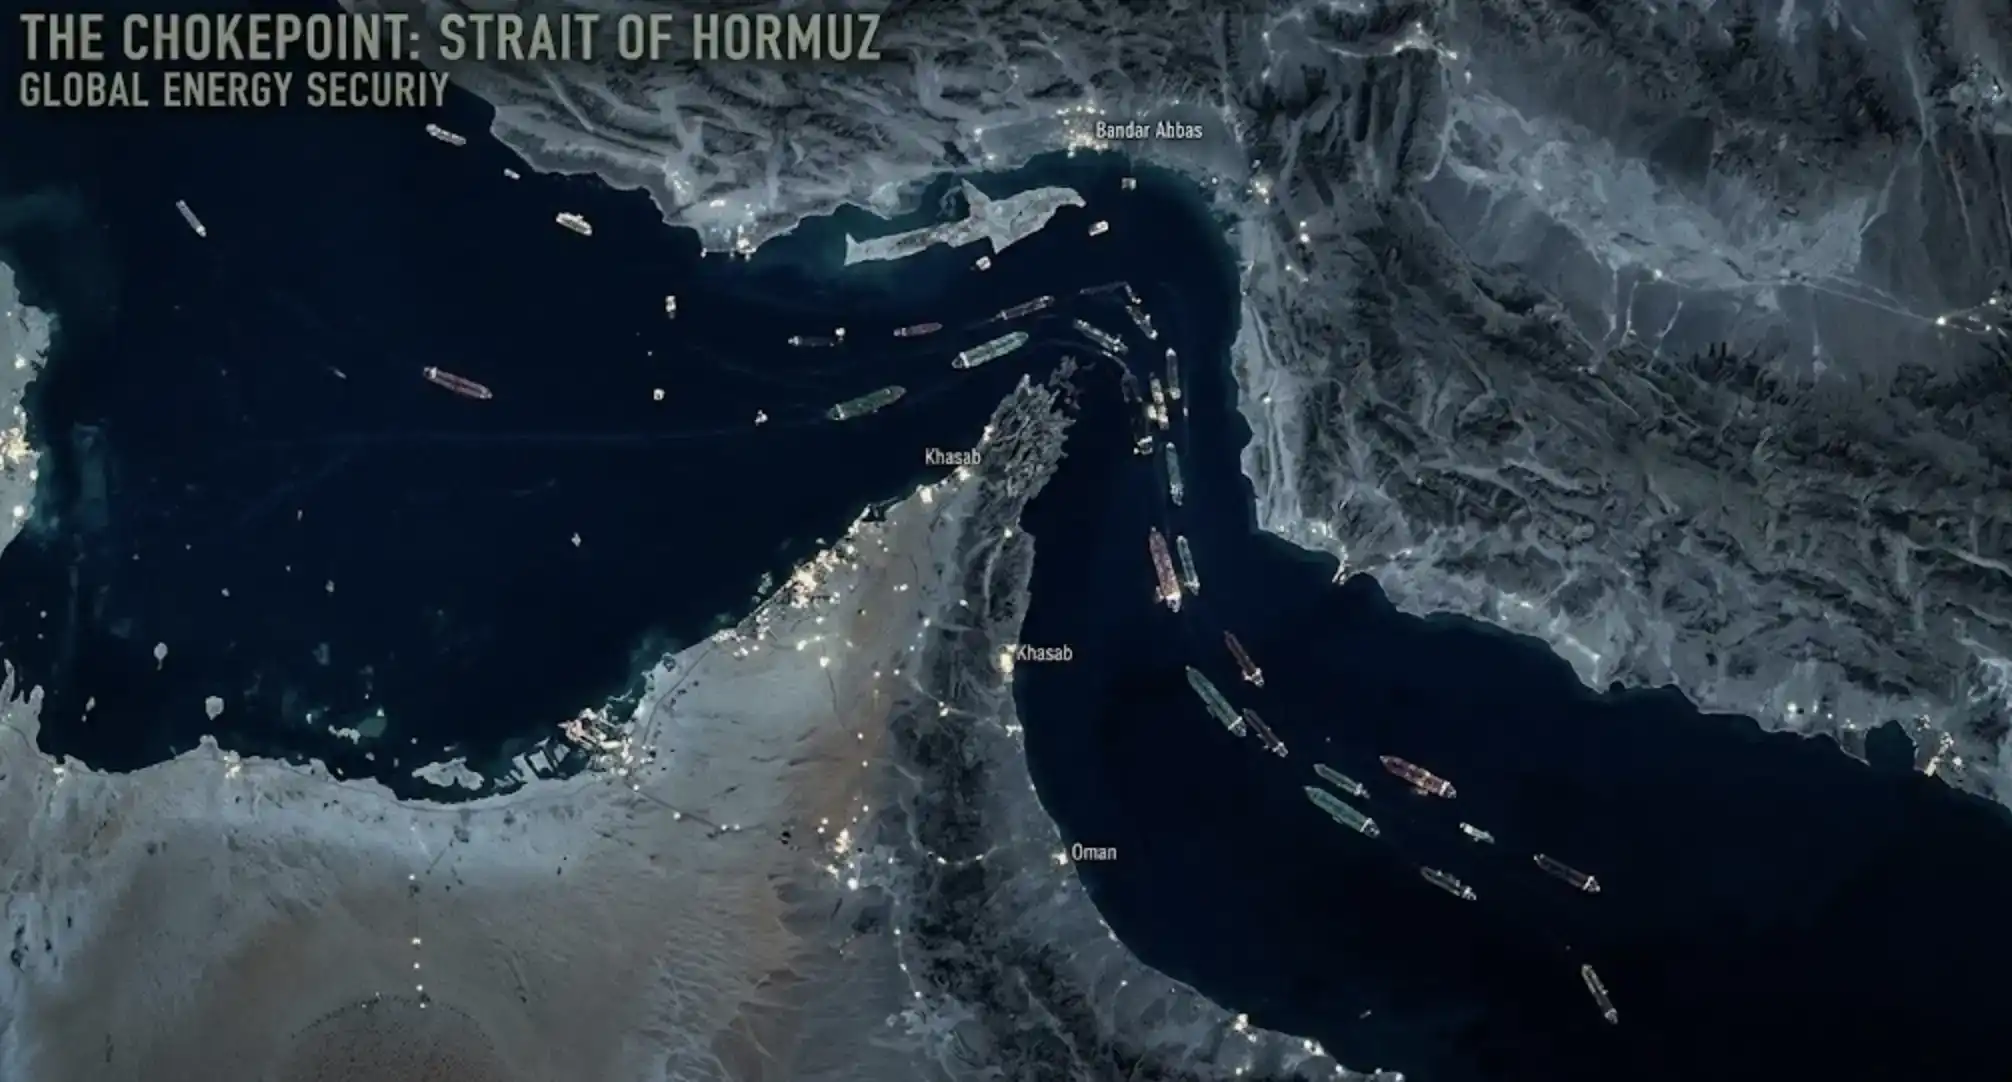
These factories are all in South Korea. South Korea imports 2.76 million barrels of oil per day, mostly from the Persian Gulf, passing through the Strait of Hormuz.

Iran announced the closure of the Strait of Hormuz, then retracted the statement. But insurers have already voted unilaterally: war risk insurance suspended, shipping companies stopped scheduling. An unofficially announced blockade is effectively in operation.

Simultaneously with the market stampede, another piece of news quietly surfaced: Samsung's US wafer fab in Taylor, Texas, a core asset in the US "chip reshoring" strategy, had its mass production timeline delayed again, pushed from 2026 to 2027. This factory, built in the desert of Texas—still needs oil that comes from the Persian Gulf.

The Dollar Won, Everyone Else Lost

Now for the most uncomfortable conclusion.

Throughout this cycle, "de-dollarization" has been one of the most mainstream macro narratives. The US dollar's share of global reserves has fallen below 47%, central banks are buying gold at a record pace, BRICS is building the mBridge cross-border settlement platform, and the scale of on-chain stablecoins has expanded from $205 billion to over $300 billion. Almost everyone in the circle was betting in some way: the dollar's golden age is over, the next era belongs to multipolarity, hard assets, decentralization.

Then the war started, and the US Dollar Index rose 1.1%, marking its largest single-day gain since last May.

On this day, there was同步 selling across the board: stocks fell, bonds fell, gold fell, silver fell, commodities fell. The flow had only one direction: the US dollar.

This is the nature of a liquidity squeeze. It's not that the dollar got better; it's that the dollar is the asset with the deepest liquidity in the global financial system. In an acute crisis, when everyone needs to exit at once, the dollar is the widest door. Leverage unwinding requires dollars, margin replenishment requires dollars, the first step in fleeing cross-border assets is also dollars. No other option has this scale.

Iran provided the clearest footnote for this logic.

The Iranian rial has depreciated over 30% year-to-date. Nobitex is Iran's largest crypto exchange, handling over 87% of Iran's on-chain crypto activity. Within minutes of the airstrike beginning, withdrawals from Nobitex surged 700% (Elliptic data). Chainalysis tracked the fund flows: a significant portion of the outflowing funds ultimately landed at overseas exchanges historically receiving Iranian inflows, to be converted into USDT and USDC.

In a real currency crisis, what people do using crypto networks is flee into the US dollar.

This is not to say the debasement trade is a false proposition. The structural pressures of US debt, inflation, and the long-term erosion of the dollar's purchasing power are real. The logic of gold outperforming in the long run was not overturned by this stress test.

But this tells us one thing: the debasement trade is a slow-variable narrative; it requires the刻度 of time to hold true. Geopolitical shocks are fast variables; they have only one刻度—today.

When two time frames are placed at the same moment, the slow variable yields.

The dollar won. In the next crisis, the dollar will most likely win again. Until one day, it doesn't—but that day will most likely not begin with this kind of dramatic opening.

Related Questions

QWhat was the immediate market reaction to the geopolitical event in the Middle East, specifically regarding gold and Bitcoin?

AGold initially surged to $5,400, then fell over 4% along with stocks. Bitcoin initially dropped, then rebounded to trade sideways, ending near its starting point.

QWhy did the Korean stock market (KOSPI) experience such a severe crash on the Tuesday following the event?

AThe crash was exacerbated by a structural factor: Monday was a national holiday (Samiljeol) in South Korea, so exchanges were closed. This caused three days of accumulated panic and unexecuted sell orders to hit the market simultaneously at Tuesday's open, triggering a circuit breaker and a 7.24% drop.

QWhat is the core argument of the 'debasement trade' narrative that was tested by this event, and what was the outcome of the test?

AThe 'debasement trade' narrative posits that due to uncontrolled U.S. debt and long-term dollar devaluation, hard assets like gold and Bitcoin would act as hedges. The pressure test revealed that in an acute crisis, this slow-variable narrative was overridden by the immediate need for liquidity. Instead of fleeing to hard assets, capital fled to the U.S. dollar, causing gold and Bitcoin to fall or stagnate.

QHow did the event highlight the structural vulnerability of the global AI chip supply chain?

AThe event highlighted the chain's dependence on geopolitical stability and oil. Key AI chip suppliers Samsung and SK Hynix, which are based in South Korea and account for ~40% of KOSPI's market cap, plummeted. Their factories rely on oil imported via the Strait of Hormuz, which faced a de facto blockade. This, combined with news of a delayed U.S. chip fab, exposed the supply chain's fragility.

QAccording to the article, what does the flow of capital from the Iranian rial via crypto exchanges ultimately demonstrate about the role of the U.S. dollar during a crisis?

AIt demonstrates that during an acute currency crisis, the primary use of crypto networks was not to find a decentralized alternative but to facilitate an escape into U.S. dollar-backed stablecoins (USDT, USDC). This underscores that the U.S. dollar remains the deepest and most liquid safe-haven asset in the global financial system during a panic, despite long-term 'de-dollarization' narratives.

Related Reads

Why Is the World Nervous About Japan Raising Interest Rates?

In June 2026, the Bank of Japan raised its policy rate to 1%, marking its first hike to this level since 1995. While this rate remains low compared to global peers like the US and Europe, the move signals a profound shift for a nation that has been a global source of ultra-cheap funding for decades. Japan's long-standing near-zero or negative interest rates had facilitated massive "yen carry trades," where international investors borrowed low-cost yen to invest in higher-yielding assets worldwide, such as US tech stocks and emerging market bonds. This made Japan a critical, often overlooked, source of global liquidity. Japan's ultra-loose policy stemmed from structural challenges post-1990s asset bubble: aging demographics, chronic low inflation/deflation, and high public debt. Recent shifts, including sustained wage growth (exceeding 5% in recent years) and inflation consistently above the 2% target, have created a "wage-price spiral" possibility, prompting the policy normalization. The global market's concern lies not in the absolute rate but in the potential unwinding of the yen carry trade. As Japanese borrowing costs rise, the economics of these leveraged global investments change, potentially triggering deleveraging and capital outflows from risk assets. Market anxiety focuses on the end of a thirty-year consensus that Japan would perpetually provide cheap funding. Ultimately, the global impact will depend on the interplay with US monetary policy. While Japan is tightening, the significant interest rate differential with the US remains. The key future dynamic is whether simultaneous Japanese hikes and eventual US rate cuts will narrow this gap, forcing a major recalibration of global capital flows and asset pricing built on an era of abundant, cheap yen liquidity.

marsbit1h ago

Why Is the World Nervous About Japan Raising Interest Rates?

marsbit1h ago

Research Report Analysis: MRVL's Optical AI Booming, Why High Valuation Keeps Morgan Stanley's Star Analyst Sidelined?

Report Recap: MRVL Optical AI Boom - Why High Valuation Led Morgan Stanley's Star Analyst to Stay Neutral? Morgan Stanley analyst Joseph Moore maintained an "Equal-weight" (Neutral) rating on Marvell Technology (MRVL) on May 28, raising the price target from $172 to $195, below the trading price. This stance comes despite Marvell reporting a record quarter and significantly raising its full-year outlook (FY27 revenue ~$11.5B, up ~40%). Moore's neutral view is based on valuation. The $195 target implies ~40x CY2027 P/E. He contrasts MRVL with NVDA: both trade near ~$200, but Nvidia's forward EPS is more than double Marvell's. For MRVL's valuation to hold, it needs consistent earnings upgrades, proof of networking market share gains, or certainty on large-scale custom AI chip shipments—none of which are confirmed yet. Growth is driven by two pillars: **1) Optical Interconnect** (the faster runner): Moore raised FY27 growth expectations to >70%, with the optical module product line nearing a $1B annualized run rate. **2) Custom AI Chips** (the climber): Confidence in FY28 is growing, but a major new customer project only ramps in FY28, with no current revenue visibility. Key risks are the underperforming Storage, Enterprise, and legacy Networking segments. Moore acknowledges the real AI opportunity but believes the current price already reflects it. For the stock to work from here, investors need to see the optical business hit its targets, custom chips ramp as planned, and a recovery in the weaker business units.

marsbit2h ago

Research Report Analysis: MRVL's Optical AI Booming, Why High Valuation Keeps Morgan Stanley's Star Analyst Sidelined?

marsbit2h ago

qinbaFrank: Review and Outlook of the AI Computing Power Wave — From the Three Debates on NVIDIA to Optical Interconnect and SpaceX IPO, How is Capital Rotating?

**Summary: Retrospective and Outlook on the AI Computing Wave - A Framework for Capital Rotation** Based on a presentation by investor qinbaFrank, this analysis reviews the AI computing market trajectory since 2023 and outlines a forward-looking framework. **Key Phases and Market Debates:** The AI bull market progressed through three major debates: 1) The necessity of massive capital expenditure (late 2023). 2) The sustainability of tech giants' spending (early 2024-early 2025). 3) Potential overestimation of compute needs (early 2025). Consensus solidified in late 2025 as model capabilities and utility demonstrably improved. **Core Thesis: Penetration Rate Drives Commercialization.** Unlike the 2000 dot-com bubble, the current AI wave benefits from mature digital infrastructure, enabling faster adoption. The critical threshold is 10% penetration; surpassing it (with recent enterprise intent surveys showing ~18%) indicates entry into a rapid growth "golden period" where user scale and willingness to pay increase simultaneously. **AI vs. Internet: A Fundamental Difference.** While the internet enhanced connection efficiency, AI directly substitutes human cognition and labor. Once AI performance exceeds the "societal average" human level, its commercial value scales exponentially as payment shifts from human labor costs to AI service fees. **Investment Logic Evolution in the Compute Chain.** The focus has expanded from GPUs to a systemic re-rating of the entire hardware stack: storage/HBM, CPUs, interconnects, power, and advanced packaging. The framework is: **short-term "scarcity pricing," mid-term "upgrade pricing" (e.g., optical interconnects, power networks), and long-term "Physical AI" pricing** (edge computing, robotics). **Market Focus Shift and Adjustment Framework.** The market is transitioning from "hardware scarcity" to "commercialization validation." The ultimate anchor for the narrative is sustained high growth in model providers' Annual Recurring Revenue (ARR) and cloud business revenue, which justifies continued capital expenditure. Adjustments are categorized into three levels: * **L1 (Minor):** Driven by valuation compression or macro noise (e.g., single CPI print). Fundamentals intact. * **L2 (Moderate):** Triggered by significant macro events requiring risk repricing. Requires new data for confidence restoration. * **L3 (Major):** Involves a reset of the core industrial narrative or macro regime (e.g., AI commercialization growth stalling). The **crucial dividing line** is whether AI commercialization growth slows. Without a slowdown, pullbacks are likely L1/L2 "repricing" events. A genuine growth deceleration would signal an L2/L3 narrative reset. **Conclusion: A Foundational Civilizational Leap.** AI represents a foundational upgrade to "intelligence" itself—akin to humanity mastering fire—rather than a single-point industrial revolution. This底层能力跃迁 (underlying capability leap) will spawn successive waves of innovation (Agent, robotics, industry workflow重构). The journey will be波浪式的 (wavelike), driven by cycles of scarcity, technological upgrades, and远期兑现 (long-term realization).

marsbit2h ago

qinbaFrank: Review and Outlook of the AI Computing Power Wave — From the Three Debates on NVIDIA to Optical Interconnect and SpaceX IPO, How is Capital Rotating?

marsbit2h ago

Trading

Spot
Futures
活动图片