[Key interpretation] USDT users have decreased significantly, and BTC has accelerated to fall below the recent investor cost price

Huobi ResearchPublished on 2022-07-26Last updated on 2022-07-27

Abstract

The supply of stable currency fell by $35.1 billion, and usdt users decreased significantly, putting short-term pressure on the market.

1. BTC volume stagflation

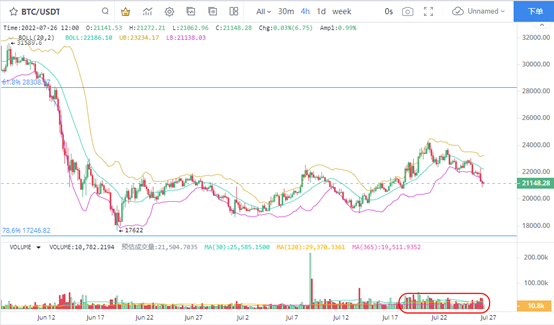
BTC's 4-hour K-line chart hours. With the price adjustment, BTC, which currently maintains a high-volume state, has continued its decline for several trading days. Since July 20, BTC has fallen below the middle rail of the brin line after falling back from the high US $24200. BTC's short-term decline expanded to 12.5%, and the Bollinger line expansion trend continued. In the case of high trading volume, the possibility of BTC falling beyond expectations has significantly increased.

Recently, BTC has accumulated more chips below US $24000. The large volume of spot BTC transactions and the increase in the number of online transfers have increased the concentration of chips in this price range. In terms of support, we are concerned about the possibility that BTC will rebound at US $19000 and US $20000.

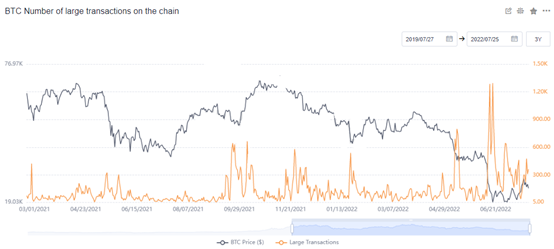
2. BTC high-level operation of large transactions

The number of large transactions with more than 500 BTCs is running at a high level, and the current value has frequently reached 500, indicating that the main force is highly active. The activity of the main players in the low price zone has increased, which represents the growth trend of the number of low turnover BTCs. A large number of BTCs transfer money in the low price zone, and it is difficult for BTCs to get out of the price range below $24000 at present. However, after the change of hands is completed, considering that the volatility of BTC price rebounded on July 25, it seems to be preparing for a downward break. In the short term, we can prepare for emergencies, and the important $19000 may be used as the key support point.

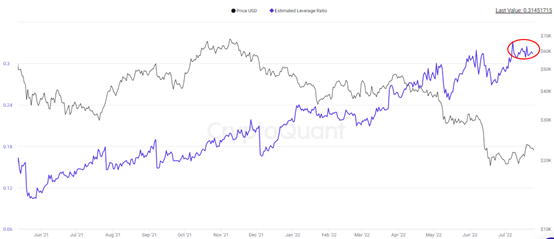
3. BTC estimated high leverage operation

BTC estimates that the leverage ratio is running at a high level, and there has been no significant growth since June. Nevertheless, judging from the growth trend of leverage ratio, it is still the highest level in history. It is estimated that the high leverage ratio means that the stock of BTC in the exchange decreases, the trading leverage ratio of investors is high, and BTC still has high volatility potential.

Numerically, the leverage ratio was estimated to be around 0.315 on July 24, with a significant increase of 43% during the year. In terms of trading, pay attention to the intra day amplitude performance of BTC, and pay attention to the expectation of high-intensity fluctuations caused by price changes.

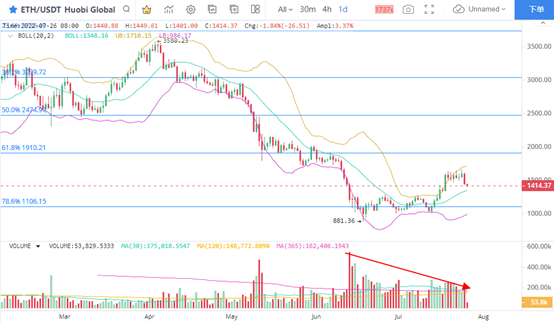
4. Eth continuous adjustment signal

The daily K-line chart of eth shows that after the price fell from the high platform, the trading volume maintained a shrinking trend. At present, the trading volume is close to falling below the equivalent line, and the ETH price is close to the brin line medium rail. According to the price operation rhythm, ETH implementation will seek the support of $1348 corresponding to the brin line medium rail, so as to further verify the price long and short rhythm.

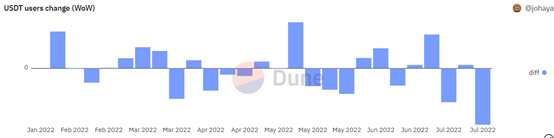
5. Decrease in stable currency users

The decreasing trend of stable currency users continued, especially the number of users of usdt with the highest market value continued to decline, and the decline was significantly increased. The data showed that the number of usdt users fell by 80884 on July 25, the largest decline in the year. Judging from the downward trend of usdt users, investors' trading enthusiasm for the current mainstream currencies is obviously at a low level. The decline in the number of users means that more investors are less willing to copy the bottom of the market. Although mainstream currencies such as BTC and eth retreated, it may be difficult to support the short-term rebound, so the recent trend is not optimistic.

Related Reads

STRC Severely Unpegged, What Risks Is the Market Pricing In?

The article analyzes the recent significant de-pegging of Strategy's perpetual preferred stock, STRC, whose price fell to approximately $89, far below its $100 face value. This discount has pushed its simple yield to around 12.9%, creating a paradox. The stock was designed as a high-yield instrument trading near par, and Strategy maintains an 11.5% annual dividend, even recently switching to semi-monthly payments to support the price. The author explores several reasons why the high yield hasn't attracted enough buying pressure to restore the par value. A key factor is potential reverse deleveraging from carry trades, where leveraged investors may be forced to sell due to margin calls as the price falls, creating a self-reinforcing downward spiral. Additionally, the tokenization and integration of STRC into DeFi protocols (like Apyx, Saturn, Pendle) have introduced faster, more transparent, and potentially more volatile price adjustment mechanisms through leverage and yield-splitting products. The emergence of a competing product, Strive's SATA, offering a 13% yield with daily dividends, has also changed the yield benchmark, challenging STRC's unique high-yield narrative. Furthermore, the market is questioning the distinction between Strategy's substantial Bitcoin reserves, which provide long-term balance sheet coverage, and the certainty of stable near-term cash flow for dividends. Ultimately, the price dip represents a stress test for this type of BTC-backed, high-yield financing tool. The future path of STRC depends on whether Strategy acts to reinforce the $100 peg (e.g., by adjusting dividends), whether DeFi-related leverage unwinds further, and how investors ultimately price the risks of leverage, competition, and cash flow uncertainty against the offered yield.

marsbit11m ago

STRC Severely Unpegged, What Risks Is the Market Pricing In?

marsbit11m ago

LIT Token Hits Six-Month High: How Long Can the Buyback Flywheel Keep Burning Fuel?

The LIT token of decentralized perpetual exchange Lighter surged to a six-month high above $1.90 on June 18th, with a market cap of $425 million. After a price correction earlier this year, the recent rebound is attributed to its core "buyback flywheel" mechanism. All protocol fee revenue is used for programmatic, hourly market buybacks of LIT. Since its TGE in December 2025, approximately 15 million LIT (6% of circulating supply) has been repurchased for around $21 million. Additional price support comes from the LLP (Lighter Liquidity Pool), where providers must stake LIT worth 10% of their deposited USDC, locking significant token supply. However, challenges persist. Trading volume has declined amidst a sluggish market, with total volume at $1.68 trillion, significantly lower than leading competitor Hyperliquid's $4.37 trillion. While Lighter focuses on perpetual contracts, RWA, and Pre-IPO markets, Hyperliquid has expanded into prediction markets and boasts a U.S. spot ETF, attracting institutional investment and influencer endorsements like from Arthur Hayes. In contrast, LIT currently lacks similar high-profile backing. With 75% of LIT's total 1 billion supply still locked (team and investor tokens begin a 3-year linear unlock in December 2026), there is no immediate unlock selling pressure. The token's future performance hinges on sustaining trading volume growth, successful product iteration, and executing its transparent buyback strategy against a dominant competitor.

Foresight News30m ago

LIT Token Hits Six-Month High: How Long Can the Buyback Flywheel Keep Burning Fuel?

Foresight News30m ago

Football Draw Harvests Whales: Extreme Profit-Loss Divergence on Polymarket's World Cup

A bettor known as "fishalive" made a stunning profit of nearly $9 million on the Polymarket prediction platform by correctly wagering against favorites during the 2026 FIFA World Cup group stage. The account, registered just before the tournament, risked roughly $400,000 on two contracts for a Spain vs. Cape Verde match: one that Spain would *not* win, and another on a Cape Verde +2.5 goal handicap. The resulting 0-0 draw triggered both payouts. This single event, with a total market volume of $64 million, highlighted extreme profit-and-loss divergence. Other traders, like "betoor619" and "leeeeroyjenkins," lost millions by betting heavily on favorites Spain and Belgium to win outright—contracts that become worthless in a draw. The article explains that while markets heavily favored strong teams, the "team to win" contracts are binary and do not account for the common outcome of a draw. This creates high-risk, low-reward scenarios for favorite backers, while asymmetric profits flow to those betting on underdogs or against outright wins. The transparency of Polymarket's on-chain ledger publicly documents these massive wins and losses, driving mainstream media coverage. As the tournament progresses, the author suggests traders may shift towards hedging strategies that account for draws. The piece also notes growing regulatory scrutiny in the US and Europe, questioning whether such large-scale, anonymous sports prediction markets should be regulated as gambling or financial derivatives.

Foresight News1h ago

Football Draw Harvests Whales: Extreme Profit-Loss Divergence on Polymarket's World Cup

Foresight News1h ago

Trading

Spot
Futures
活动图片