1、 BTC short-term selling signal appears
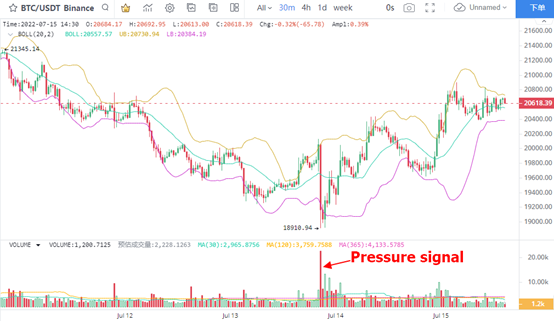
BTC's 30 minute K-line chart is hourly. Recently, the main short-term pressure on BTC's price retreat shows a very strong willingness to sell. From 20:30 on July 13, BTC prices suddenly fell from a high level. Within 30 minutes, the price amplitude was 5.75%, and the closing decline also reached 4.44%. At the same time, the trading volume was 230% larger than the previous 30 minute trading range. After the trading volume was tripled, the BTC price fell by $1000 from above $20000.
Although BTC has recently shown signs of rebound, its growth is relatively limited. Judging from this, the current BTC price trend is not strong, with strong range shocks and adjustment expectations.
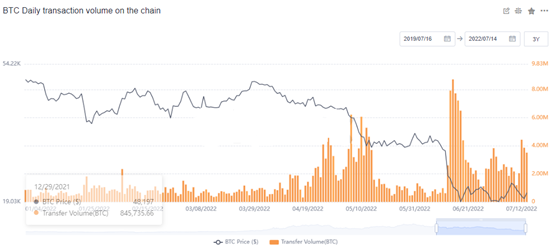
2. BTC chain trading volume remains high
The trading volume on the chain has always maintained a high level, which means that the turnover of BTC is relatively sufficient, and there are more investors trading or transferring BTC in the low price area. This shows that in the shock around us $20000, if the adjustment time is long enough, BTC will confirm the bottom feature at US $20000. The recent selling pressure is very important to the trend of BTC price. If the selling pressure increases, the BTC price may fall again. At present, the price platform of $20000 has been maintained for one month. The trading time is not long, and the active buying is less, which has a great impact on the market performance.
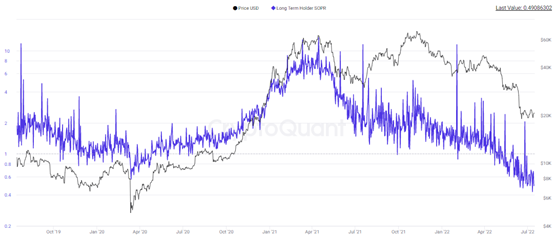
3. Main loss escape signal continues
Although BTC's activity has increased slightly recently, the trading volume of both the chain and the exchange has rebounded, the loss trading of BTC's long-term investors has not ended. SOPR indicators of long-term investors show that the overall loss trading range of the main force is more than 40%. In other words, the main force trades BTC at a loss of 40%, making the short-term bottom confirmation process relatively bumpy. In particular, compared with the SOPR index performance of long-term investors in 2020, the recent selling intention of long-term investors shows no sign of ending, so important reversal signals still need to wait patiently.
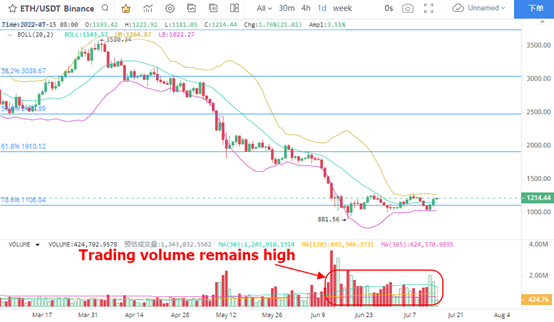
4. Eth trading volume remains high
Eth finished sideways around us $1100, and the range rebound again occurred under the brin line, indicating that the bottom of the price is being confirmed. At present, the trading volume at the bottom of eth remains high, so a lot of chips have accumulated around $1100. Not surprisingly, the price rebound space corresponding to high trading volume will also gradually increase. With the accumulation of trading volume, the increase in the range is expected to remain below $1910. Fibonacci's 61.8% corresponding to $1910 to $1106 is an important fluctuation range, and the lower limit of this range is still an important buying point.
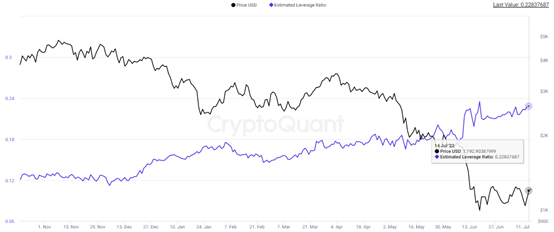
5. Eth estimated leverage rebound
Eth estimated that the leverage ratio continued to strengthen in the short term, reaching 0.228 on July 14, almost the highest value in a month. It can be seen that investors' trading enthusiasm continues to rise, and the impact on prices is also increasing. Recently, the spot trading volume of eth has also remained relatively high, and the price fluctuation space has increased. Judging from the pressure level, the breakthrough of eth below $1240 is bound to be confirmed in the short term. Once it picks up, the fluctuation space will quickly open. Investors who do not hold a large amount of money can continue to hold money and wait for a clear trading signal.