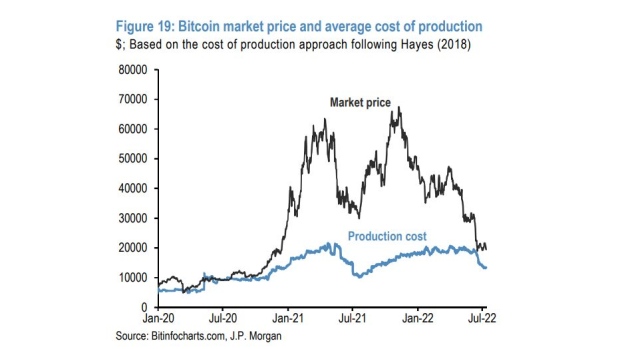
Wall Street banking JPMorgan has recently published a report that suggests that the Bitcoin production cost has dropped 50% over the last month. Currently, the BTC production cost stands at $13,000 down from the $24,000 cost at the start of June 2022.
JPMorgan strategists led by Nikolaos Panigirtzoglou wrote that this drop comes amid the fall in electricity use as per data from Cambridge Bitcoin Electricity Consumption Index.
The banking giant notes that this is an effort y the miners to protect profitability and deploy efficient rigs. However, it could also serve as a major obstacle to any gains in the Bitcoin price. The JPMorgan strategists wrote:
“While clearly helping miners’ profitability and potentially reducing pressures on miners to sell Bitcoin holdings to raise liquidity or for deleveraging, the decline in the production cost might be perceived as negative for the Bitcoin price outlook going forward. The production cost is perceived by some market participants as the lower bound of the Bitcoin’s price range in a bear market.”
Bitcoin Miner Capitulation
During the second quarter of 2022, Bitcoin miners were on a selling spree. As the Bitcoin price corrected a staggering 70% from its all-time highs in November 2021, miners had to offload more quantity in order to cover their operational costs.
Last month, JPMorgan strategists said that Bitcoin could further witness selling pressure during the third quarter as well. Miners are further likely to liquidate their holdings going ahead. Also, if the BTC production has actually gone to $13,000 as per JPMorgan, miners might have a good profit to make on its new production.
On-chain data provider Glassnode recently shared its insights wherein it notes that long-term holder (LTH) capitulation. The report adds:
“There is an increased probability that a long-term holder (LTH) capitulation is underway. Bitcoin investors are not out of the woods yet”.
On the upside, Bitcoin (BTC) still has to cross its 200-day EMA at around $22,500 and hold above that level to resume the uptrend.