1、 BTC brewing double bottom form
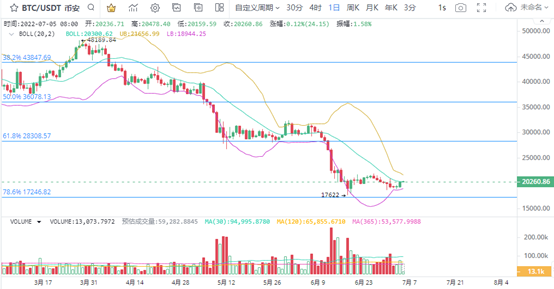
In the daily K-line chart of BTC, BTC ushered in a technical rebound trend when the closing price was not continuously at a new low.
The figure shows that the rebound intensity of BTC is not high, but the closing price has risen significantly from the low level. The amplitude reached 6.72%, and BTC brewed the volume bottom shape in the low price area. This bottom can be compared with the previous rebound on June 18, which is the second rebound performance. Therefore, there is a better expectation of double bottom reversal. Operationally, investors can pay attention to further low absorption and currency holding opportunities.
In terms of indicators, the rebound of BTC continues after the short-term closing of the brin line, which is a typical rebound signal after the increase of fluctuation intensity. Although it has not effectively broken through the middle rail of the brin line, with the expansion of price increase, the possibility of further rise is enhanced.
At present, BTC only needs a small price increase to confirm the typical rebound signal, so the increase is relatively expected.
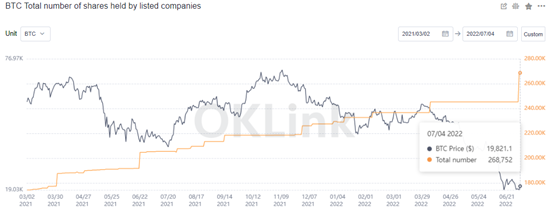
2. BTC obtains increased holdings from Listed Companies
The increase of listed companies' holdings in BTC means that the main force or has recognized the buying opportunities of BTC. The message shows that the bank for International Settlements allows banks to retain 1% of bitcoin reserves, which means that BTC's hedging function may play a greater role.
The number of currency held by listed companies increased rapidly during this period. By July 3, 2022, the number of BTC listed companies increased to 268752 BTCs, an increase of 23378 BTCs compared with 245374 BTCs on July 2. Although the trend of listed companies to increase their holdings of BTC over the past year is very significant, the scale of this increase is undoubtedly the highest. Combined with the cost advantage of BTC, the increased holdings of listed companies are around us $19300, which is also a confirmation signal for the bottom of BTC.
After listed companies increase their holdings of BTC, it is unlikely to be sold. Once BTC's buying opportunity below $20000 is recognized by more investors, the possibility of its reversal will be greatly enhanced.
3. BTC price is close to the cost price of investors
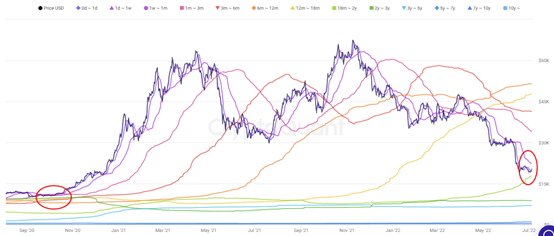
During the low-level and high-volume operation of BTC price, its cost price is rapidly approaching the cost price of investors. The cost price mentioned here includes the main cost price of holding money for 18 to 24 months, as well as the cost price of investors holding money for 1 to 1 week. Recently, in the process of low-level sideways consolidation, the latest 18 to 24 month long-term investor cost price further rebounded to $17788 on July 4. Accordingly, the main cost price of holding money for one week to one month fell back to $22251.
Review the performance of BTC accelerating its rise from the main cost price around us $10000 at the end of 2020.
This time, BTC is close to the short-term and long-term investor cost price, which also indicates a very typical buying opportunity. After different cost prices are close to the current price of BTC, the expectation of further price correction is weak, and the chance of success in bottoming is greatly improved.
From the perspective of holding time, the cost price of investors holding money for 18 to 24 months has risen to $17643, that is to say, this point has been higher than the recent BTC lowest price of $17622. In other words, if BTC is close to US $17643 in the short term, the possibility of further breaking and falling has been significantly reduced. The cost price of investors holding money for 18 to 24 months is the main price for holding money for a long time. Its currency holding cycle starts from the middle of 2020. If the main cost price is lower than this cost price, the cost may be an important buying signal.
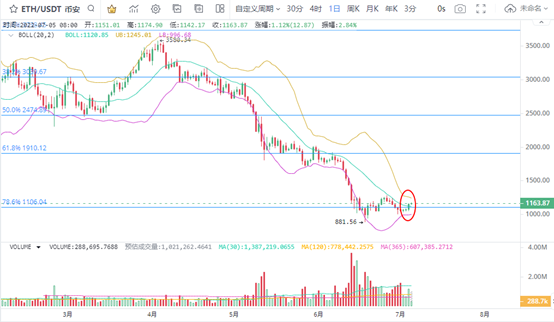
4. Eth key position rebound
In the daily K-line chart of eth, the price performance is significantly stronger than that of BTC. Eth has broken through the medium gauge of the brin line during the rebound, thus indicating a strong signal of short-term price, creating conditions for further expansion of the increase.
In terms of trading volume, the trading volume of eth rebounded slightly on July 4, about twice that of the previous day. In terms of support, after eth received short-term support of 78.6% of Fibonacci's corresponding US $1106, the price trend was better. It is expected that the linkage between Eth and BTC will be enhanced, especially in the stage of price rise, which further verifies the trading opportunities.
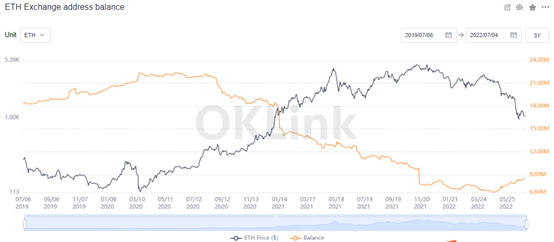
5. Increase in the number of eth exchanges
Recently, the number of eth in the exchange showed signs of growth, from a low of 6.69 million to 8.56 million eth on July 4, with an increase of 1.87 million eth, an increase of 27%. From June 26 to July 4, the growth of eth means that the release space of selling pressure is increasing. In terms of absolute number, the number of eth of the exchange is still running at a low level. From the end of 2020 to the end of 2021, the number of eth in the exchange fell from 2.2 million to 8.2 million, and its downward trend has always continued. Since 2022, the number of eth in the exchange has shown signs of a low rebound. In the recent three months, ETH fell from US $3000 to below US $1000, which was synchronized with the rebound of eth in the number of exchanges.
In the short term, the number of eth in the exchange remains stable, and then we can continue to pay attention to the impact of changes in the number on the market.