After reaching a level last seen in November 2020, the average Ethereum gas fee is now below $1.
Ethereum Gas Fees Falls
The Ethereum network experienced transaction fees as low as 69 cents on Saturday, which has not happened in the previous 19 months. The following day, gas prices reached $1.57 or 0.0015 ETH, which is equivalent to December 2020’s numbers. Transaction costs on the network today ranged from 20 cents to merely 20 cents, with 20 cents being the highest.
Gas prices in the Ethereum ecosystem ranged from $0.01 to $0.10 from July 2016 to May 2017. Users are now assessed a substantial cost; in May 2021, average transaction fees reached $69 per transaction. The highest gas price ever observed was $196.683 in May 2022.
Notably, the Ethereum blockchain has struggled to become widely used, much to the chagrin of users, due to the high cost of gas or network fees, payments necessary to complete a transaction on a blockchain. NFT holders are seen profiting from the decline as the numbers dwindle.
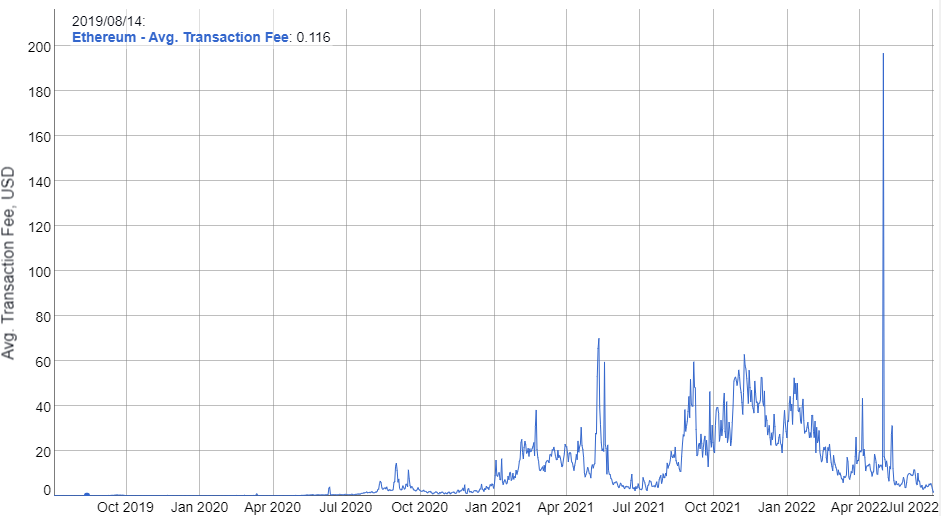
Source: Bitinfo charts
DappRadar reports that 50,466 people have traded their assets in OpenSea, up 10.14 percent from the previous day. At the time of writing, the largest NFT market’s trading volume increased by 34.18 percent to $15.92 million.
All of the top 20 collections, led by Ethereum Name Service, DopeApeClub, God Hates NFTees, Bored Ape Yacht Club (BAYC), and Mutant Ape Yacht Club (MAYC), were transacted within Ethereum, according to data from DappRadar.
Price Slumps Further
The analysis of the price of ethereum is bearish due to consolidation near $1,050 and rejection of further recovery. As a result, ETH/USD is prepared to decline even further and surpass the $1,000 local support. After that is finished, the prior swing low at $900 should be challenged the following week.
The decline approached the $1040–$1000 area that serves as a close support and was accompanied by a sharp increase in demand pressure. The numerous smaller price rejection candles at this point represent attempts by sellers to break through this support that were unsuccessful.
Therefore, the renewed positive momentum could encourage buyers to again attack the overhead barrier of $1260, providing ETH holders with a chance for a recovery.
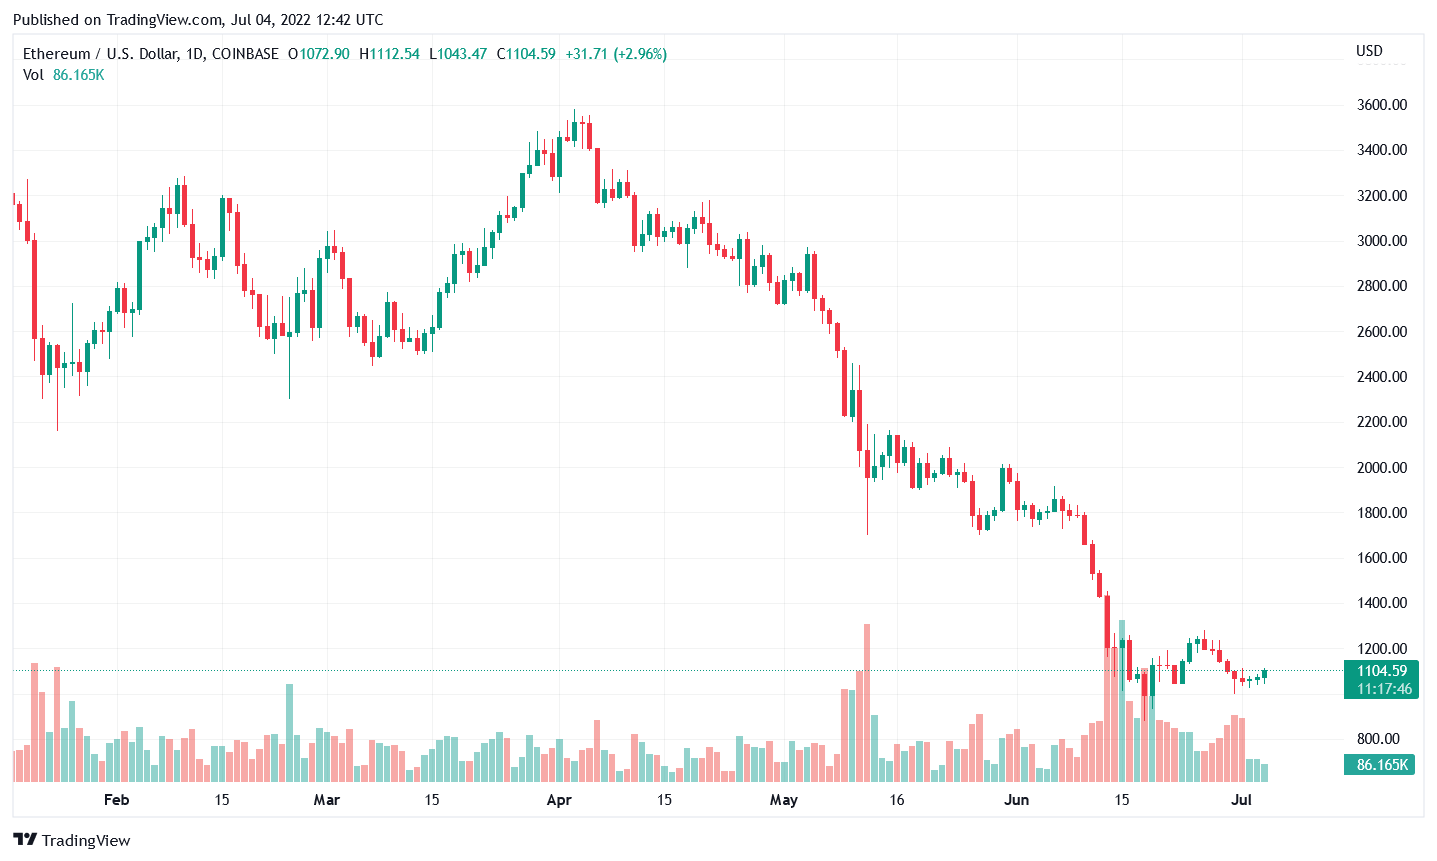
ETH/USD consolidates above $1k. Source: TradingView
At the start of the week, a significant new swing bottom was established in the price movement of ethereum. After falling by more than 21%, the price of ETH/USD hit a new low at $1,000.
From then, a swift upward reaction continued to the $1,115 level, where Friday’s rejection of further recovery was observed. Following sideways consolidation, lower local highs and lows were set.
Since then, the $1,050 level has functioned as the main trading range, with this morning’s denial of further gains. As a result, ETH/USD is prepared to drop even more and try to surpass the current low of $1,000.
If the traders continue to be persuaded by the sellers to break through the bottom support, the next decline could drive the price of ETH down by 12.56% to $880.