鲸鱼买入BTC对抗通货膨胀,是大势所趋吗?

火必研究院Published on 2022-06-30Last updated on 2022-07-01

Abstract

BTC下跌不改长期投资价值,巨鲸依然持有大量筹码。

美国通货膨胀率达40年来最高水平后,美联储货币供应量超发后的大幅加息预期强烈。比特币跌至2万美元以下后,低吸机会增长逐步确认。

高通胀推升利率

2022年,更多对物价敏感的投资者开始谈论通货膨胀。例如,美国的物价上涨对消费者的预算挤压超过了过去40 年的最高水平,投资者和消费者都非常需要寻找保护他们购买力和资金安全的好方法。

用于追踪消费物价指数变化,美国消费者价格指数 (CPI) 从2020年4月的-1.2%回升到了2022年4月的11.5%,增长趋势非常显著,通货膨胀率为40年来最高水平。

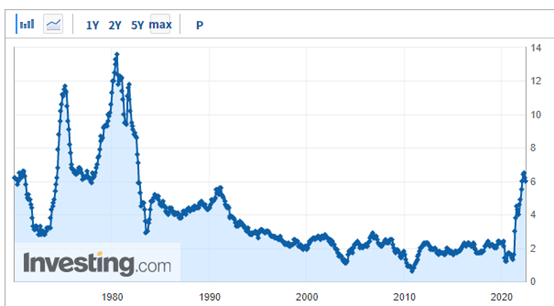
美国未季调核心居民消费价格指数(CPI)年率

在这种情况下,美联储开足马力加息,使得预期美元利率达到空前高度。

对今年底的联邦基金利率的预测,目前市场则最多押注于3.5%-3.75%,略低于6月16日美联储发布的点阵图中3.75%-4%的预测峰值。
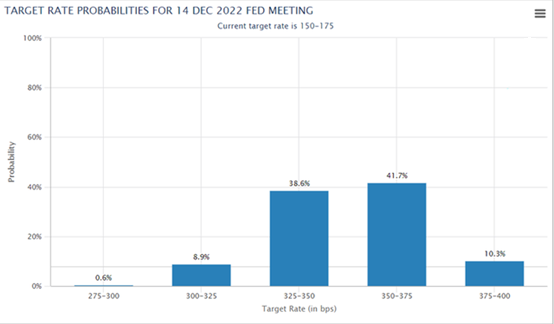
美联储加息预期点阵图

6月的点阵图显示,美联储的基准利率将从目前1.5%-1.75%的目标区间升至3.25%-3.5%;由此,接下来4次会议将累计加息175个基点。

美联储加息预期升温,大幅加息以后使得美元对投资者的吸引力大为增强。因为年内利率增长空间较大,这成为资金大户短期重新配置资产的重要推动因素。

比特币通胀率变化

数据显示,在比特币矿工Poolin挖出第742988 区块后,BTC供应量达到了19081175枚,流通量达到了90.86%。

当前挖矿周期内,每10分钟BTC的产量可达6.25枚,计算每年的BTC产量为328500枚BTC。也就是说,对于供应量为19081175枚BTC来讲,当前的年通胀率可达1.72%。从数值上看,该比值低于多数国家货币的年利率。
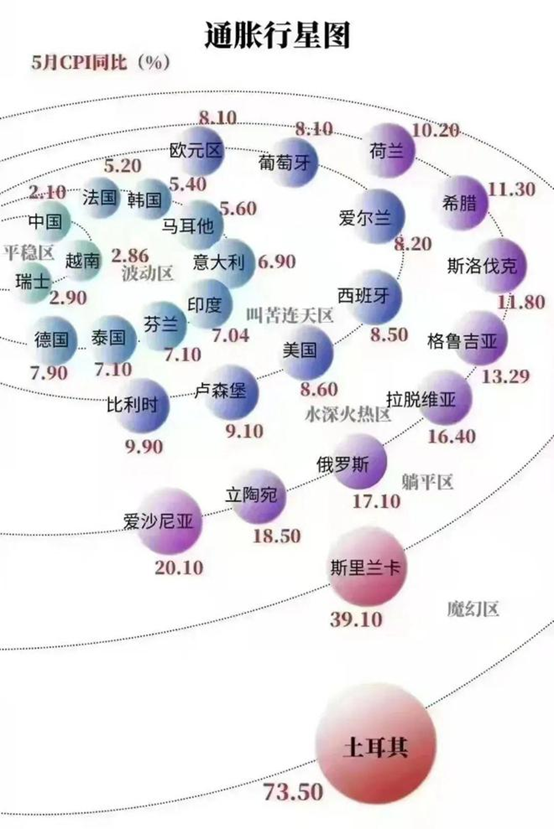
各国2022年5月通货膨胀率

从各国5月份的通货膨胀表现来看,多数国家的利率水平要高于远远高于1.72%。也就是说,BTC的通胀率完全有竞争优势,是通胀率非常低的品种。并且随着BTC每4年区块奖励减半的延续,其通胀率下降趋势也将长期存在。因此,BTC的稀缺性用于抗通胀更有效果。
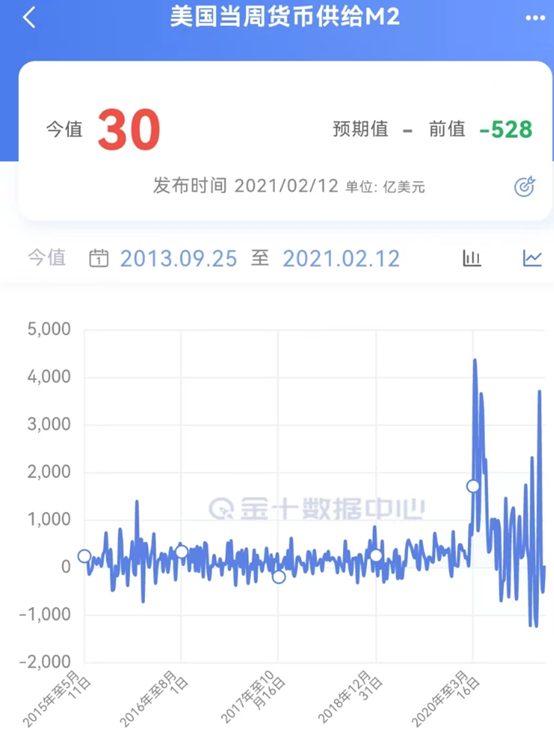
美国货币供应充足

美国近年来货币供应量增长较快,每周M2的供应量峰值可超过4000亿美元。据此判断,这是推高通货膨胀率的罪魁祸首。美元泛滥,无形中提升了长期通胀率下降的BTC的吸引力。毕竟,在BTC最终结束挖矿奖励以后,BTC的通胀目标为0。这其中,还有长期投资者持币数量增长,减少了BTC的流通量以后,增加了远期通缩预期。

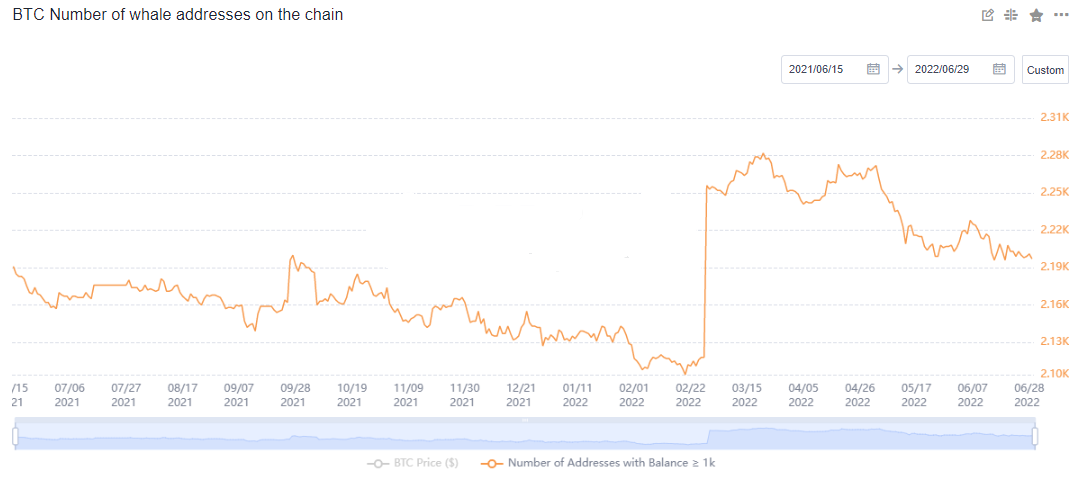
巨鲸增持大量持有BTC 持币地址数的数据显示,BTC得巨鲸地址数不断增长,背景是美联储加息和BTC价格大幅度下跌。持币数量在1000枚BTC的地址数维持高位运行,数值在2月28日大幅度增长以后,数值始终维持高位震荡。这说明,主力持币集中度依然较高。虽然,这里不排除交易所持币增长的因素,整体来看BTC的巨鲸持币增加,或许是对抗通胀长期表现的认可。因此在投资机会把握上,长期定投低吸或许是较好的选择。

Related Reads

Bitcoin Trading Strategy Breakdown: Celebrity Predictions and Classic Models All Fail, Only These Four Indicators Remain

Analysis of Bitcoin Trading Strategies: Why Celebrity Forecasts and Classic Models Fail, Leaving Only These Four Reliable Indicators This analysis examines the failure of common Bitcoin prediction methods and identifies four reliable indicators for constructing a trading strategy. The author reviewed all major BTC prediction approaches from 2017-2025, categorizing them into three groups: celebrity price targets (consistently over-optimistic), analytical models like Stock-to-Flow (broken post-2022), and on-chain signals. The key finding is that more data often creates confusion, not clarity. The strategy discards unreliable elements: celebrity predictions (incentivized to be extreme), pure models (invalidated by post-ETF market changes), and the Fear & Greed Index used alone (too many false signals). Four reliable indicators were selected: 1. **MVRV Z-Score:** Accurately identifies cycle bottoms when entering its green zone (e.g., 2018, 2020, 2022). Note: Its ability to call tops is now ineffective post-2024. 2. **SOPR (28-day MA):** Consistently signals bottoms when below 1.0, indicating holders are selling at a loss. 3. **ETF Net Flow:** A crucial post-2024 metric showing institutional momentum (e.g., sustained inflows = buying). 4. **Macro Liquidity (Fed policy & M2):** Sets the overall directional bias (e.g., bullish during easing cycles). The core strategy involves waiting for a multi-signal共振 (resonance). For example, a bottom signal requires MVRV in the green zone + SOPR < 1.0. A top signal requires overheated on-chain data + sustained ETF outflows. Macro policy sets the overall direction. The Fear & Greed Index is only used as a weighted confirmatory signal, never alone. Action is only taken when three or more indicators align. The author automated this into a monitoring system that sends Telegram alerts only when signals trigger. As of the article's date (April 15, 2026), the system showed a strong bottom signal: extreme fear (F&G=12), MVRV in the buy zone, and SOPR < 1.0. The only contrary signal was weak ETF flows. Historically, such triple on-chain共振 has preceded 100%+ returns. The conclusion emphasizes building a personal framework over relying on external predictions, allowing for iterative improvement and customization based on individual risk tolerance.

marsbit18m ago

Bitcoin Trading Strategy Breakdown: Celebrity Predictions and Classic Models All Fail, Only These Four Indicators Remain

marsbit18m ago

Trading

Spot
Futures
活动图片