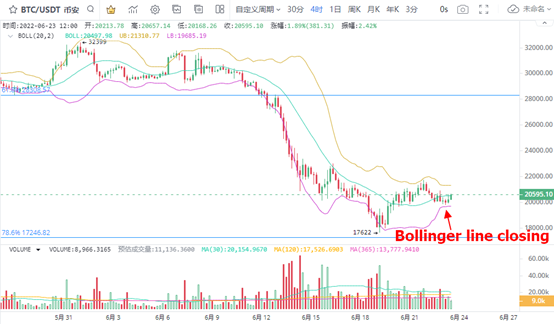
1、 BTC vulnerable consolidation
The recent fluctuation of BTC has narrowed, and the price has been below the middle rail of brin line, so there is a demand for further price change. At the same time, the brin line has closed significantly in the near future, and the distance between the brin line and the brin line has narrowed after the off track of the brin line picks up. This shows that the market is on the eve of further changes. In the 4-hour K-line chart, if BTC operates at the current trading volume, the energy to pull up the price is limited.
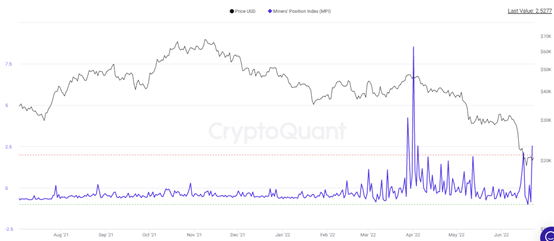
2. Significant increase in BTC miners' selling
The trading direction of investors has a relatively important impact on the price trend. When more BTCs change hands at low prices, the trading heat of miners rises. On June 22, the MPI index rebounded to a high of 2.53, which means that the selling volume has been at a high level.
The MPI measure is defined as the ratio of the dollar outflows of all mining companies divided by their 365 day moving average. During the index recovery period, it raised the signal that the selling volume of miners increased. The MPI index rose to 2.53, the highest since April 4. The number of BTC sold by miners is 2.53 times of the average value in one year, and the price decline signal can be properly paid attention to. After the MPI reached 8.54 and 2.54 in the early stage, BTC entered the stage of continuous decline, so the prompt effect on the market may be verified again.
3. BTC sold by more investors
On the judgment of BTC investors' trading direction, the capital flow of ETF represents the trading intention of more investors. On June 17, 24510 BTCs were sold, indicating that there are many opportunities for BTCs to fall. After June 17, the flow of BTC purpose ETF decreased significantly. Therefore, it can be confirmed that after BTC's selling pressure was released, the market did not continue to change much, and the market was still obviously bearish. In the short term, the current price of BTC is below US $21000, which is similar to the price at which BTC was sold off in a large amount on June 17 in the previous period. The short-term selling pressure can be paid due attention.
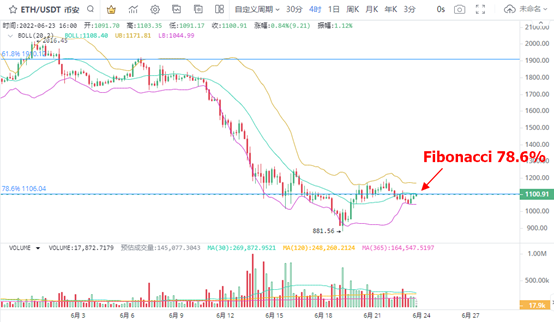
4. Eth returns below the pressure level
The most important technical support line of eth, Fibonacci, with 78.6% of the corresponding support of USD 1106, was rebounded and confirmed. Soon after, the price of eth retreated below the split line again. This shows that there are still many changes in the market. At present, there are more opportunities for adjustment below the pressure level.
In the 4-hour K-line chart, the BTC bottom reversal is in the process of confirmation, but the reversal can only be tested after the price rises. At present, the ETH trading volume is shrinking slowly, and there are signs that the market rhythm is slowing down.
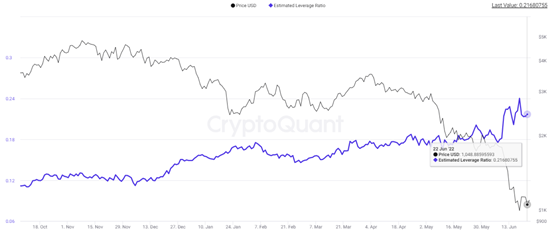
5. ETH contract position bottoming sign
The leverage ratio of eth contract is stable and still at a high level within one month. The ETH leverage ratio on June 22 was 0.216, which was significantly higher than 0.175 at the beginning of June, with a rebound space of 23%. Compared with the leverage ratio near 0.1 at the beginning of 2020 and 0.15 at the beginning of 2022, the current eth leverage ratio growth space is 116% and 44%. The ETH leverage ratio has great room for growth, and with the fall of eth price, the possibility of extreme market near 1100 cannot be ruled out.