- PI token trading below descending trendline since April 12 after $3 peak.
- On-balance volume indicator signals growing buying interest.
- BBTrend histogram contraction points to weakening selling pressure.
The PI token has been caught in a persistent downtrend since reaching its all-time high of $3 on February 26, with prices consistently trading below a descending trendline since April 12. This extended decline has created a negative market sentiment around the altcoin, but several technical indicators now suggest that a bullish reversal may be forming.
According to a recent analysis, the PI/USD one-day chart displays early signals of a potential rally following this extended period of price weakness. Most telling among these indicators is the on-balance volume (OBV), which has shown a noticeable uptick over the past two trading days.
The OBV indicator is a technical analysis tool that uses volume flow to predict changes in price movement. It works by adding volume on days when prices close higher and subtracting volume on days when prices close lower. In PI’s case, the rising OBV even as price remains subdued creates a bullish divergence – typically a reliable signal that market sentiment is shifting beneath the surface.
Current data shows buyers are accumulating PI tokens
The current reading indicates that buyers are quietly accumulating PI tokens despite the ongoing price weakness. This accumulation phase frequently precedes price breakouts, particularly when combined with other supportive technical factors. One such factor is the visible contraction in PI’s BBTrend indicator histogram, where the red bars have progressively shortened in recent trading sessions.
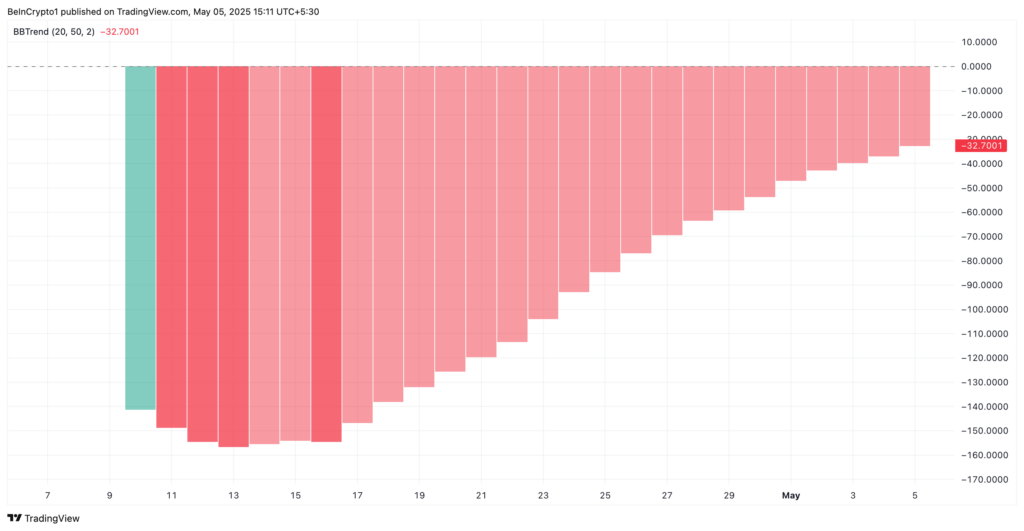
PI BBTrend. Source: TradingView The BBTrend tool measures the relationship between price and Bollinger Bands, with contracting histogram bars indicating a reduction in selling pressure. This pattern often serves as an early warning signal that a prevailing downtrend is losing momentum and may soon reverse.
For traders monitoring PI, the convergence of these technical signals suggests that the token may be approaching a significant turning point. The combination of rising buying interest (as indicated by OBV) with diminishing selling pressure (shown by BBTrend) often precedes a bullish breakout, particularly after an extended downtrend has pushed prices to potentially oversold levels.
However, prudent investors should note that for a complete trend reversal, PI would need to break above the descending trendline that has capped its price since April 12. Until this resistance is definitively broken, the token remains in a technical downtrend despite the encouraging indicators.