Chainalysis:2023全球加密货币市场收益总览

Odaily星球日报Published on 2024-03-18Last updated on 2024-03-18

Abstract

2023 年是加密货币市场复苏的一年,2023 年的积极趋势已经延续到了 2024 年。

原文标题:《2023 Cryptocurrency Gains by Country

原文作者:CHAINALYSIS TEAM

原文编译:Yvonne,火星财经

2023 年是加密货币市场复苏的一年,在经历了充满挑战的 2022 年之后,资产价格和市场情绪在这一年中都有所改善。但投资者的实际表现如何?在本文中,我们将根据投资者与中心化交易所的互动情况,分享我们对 2023 年加密货币收益的估计,包括按国家分列的估计收益细目。

我们的方法:如何计算加密货币收益并按国家估算收益

我们使用链上数据来估算投资者的加密货币收益,估算的依据是加密资产进出服务的流动情况,在这些服务中,加密资产可以转入或转出法币。具体来说,我们首先测量一组选定资产的链上宏观流量,这些资产约占所有加密货币总市值的 80% ,并在提供加密货币到法币转换服务的主要中心化交易所进行交易。然后,我们通过测量该资产所有取款的美元价值与该资产所有存款价值之间的差额,估算出每种资产的集体总收益。这种方法基于这样一个事实,即任何存入提供离线取款服务的存款都有可能转化为现金,从而实现该资产的任何收益或损失。虽然这种方法并不完美,但它为我们提供了对在中心化交易所交易的热门资产收益的有力估算。

一旦我们使用这种方法估算出我们跟踪的每项服务的用户在加密资产上的收益,我们就会根据每个国家在每项服务网站上所占的网络流量份额,将这些收益分配到各个国家。这种交易数据和网络流量的组合也是我们用来计算年度全球加密货币采用指数的相同框架。

2023 年预计加密货币总收益

总体而言,我们估计所有加密货币投资者在 2023 年的总收益为 376 亿美元。

Chainalysis:2023全球加密货币市场收益总览

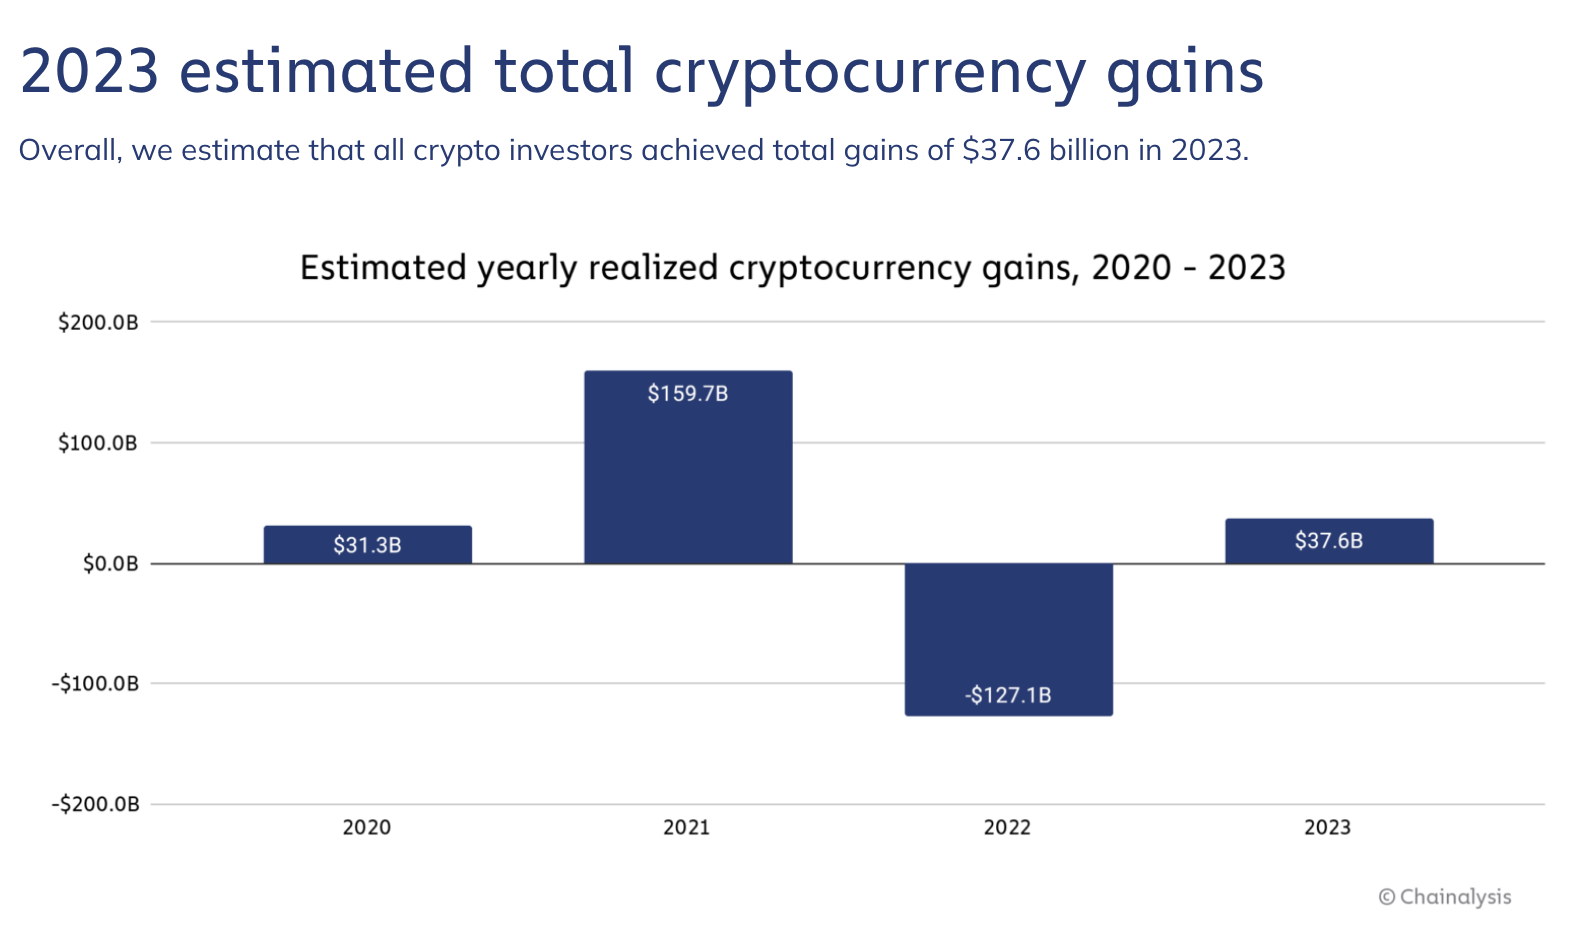
虽然这一总额远低于 2021 年牛市期间的 1, 597 亿美元收益,但与 2022 年的 1, 271 亿美元损失估计相比,已经大幅回升。有趣的是,我们对 2023 年总收益的估计低于 2021 年,尽管这两年加密资产价格的增长率相近。一种可能的解释是, 2023 年的投资者不太可能将加密资产转换成现金,因为他们预期价格会涨得更高,因为 2023 年的价格在任何时候都没有超过之前的历史高点,这一点与 2021 年不同。 

Chainalysis:2023全球加密货币市场收益总览

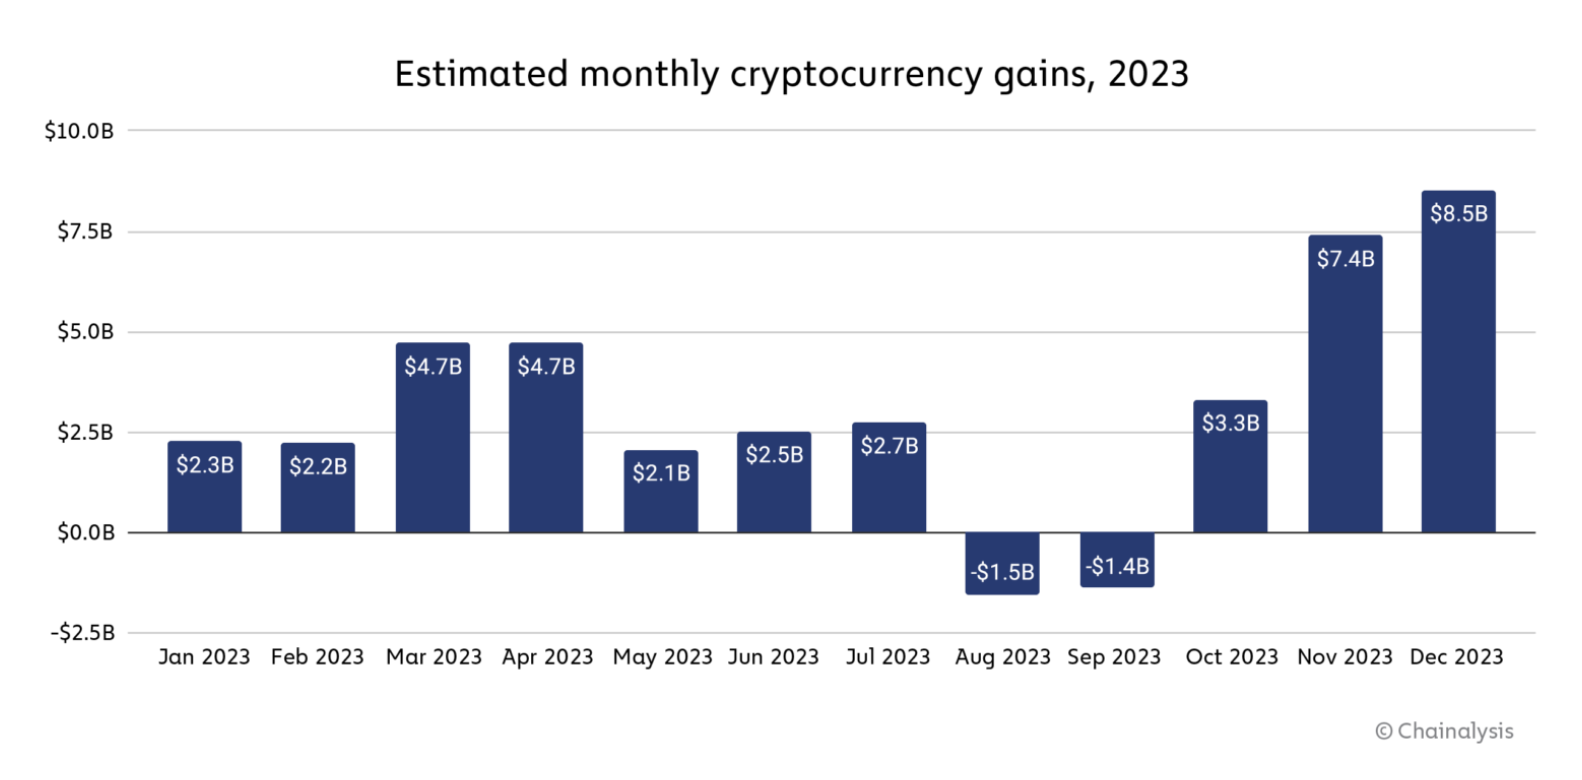
在 8 月和 9 月出现连续两个月的下跌之前,加密货币的涨势在全年都比较稳定。此后,涨幅急剧上升, 11 月和 12 月的涨幅与前几个月相比相形见绌。

2023 年各国加密货币收益估算

2023 年,美国在加密货币收益方面遥遥领先,估计达到 93.6 亿美元。英国位居第二,加密货币收益约为 13.9 亿美元。

Chainalysis:2023全球加密货币市场收益总览

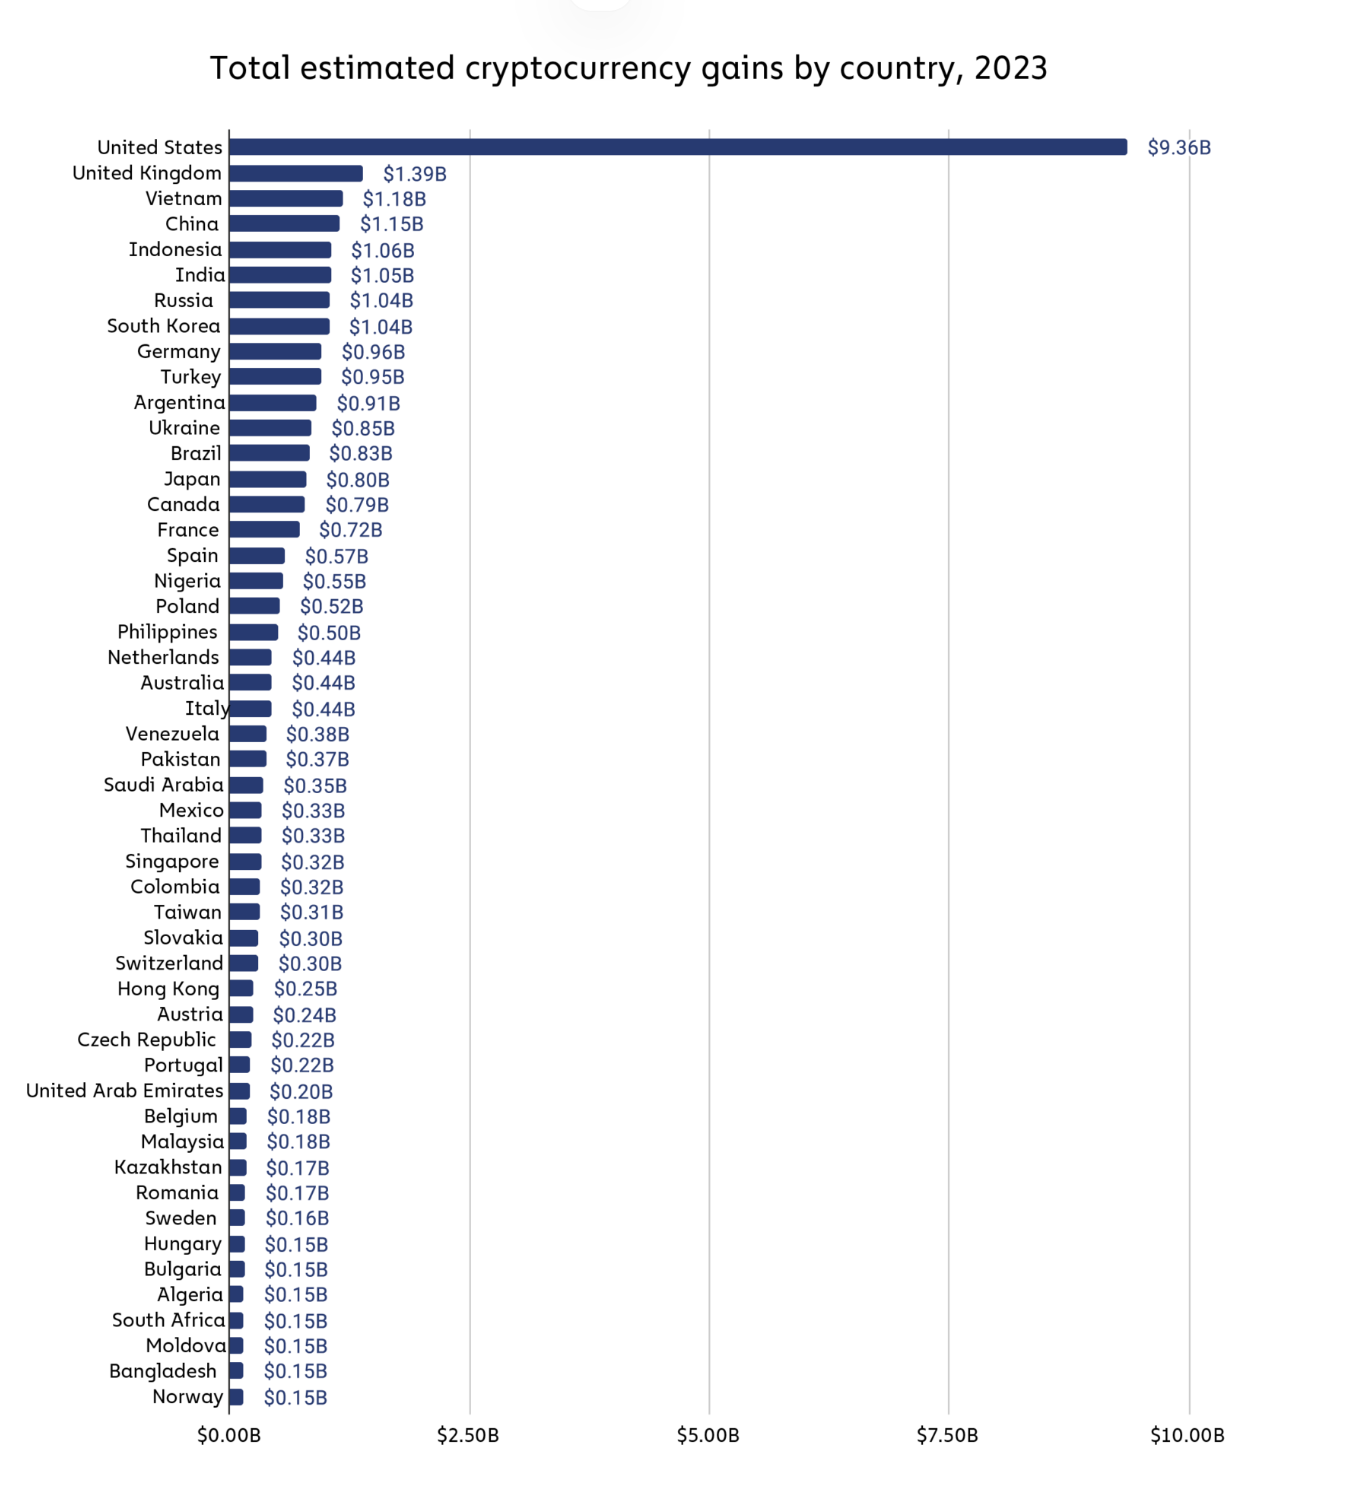
有趣的是,我们还看到一些中高收入和中低收入国家的居民似乎取得了超额收益,尤其是在亚洲,例如越南、中国、印度尼西亚和印度的估计收益都超过了 10 亿美元,在所有国家中排名前六。我们曾在「 2023 年加密货币地理报告」中指出,这些收入类别的国家,尤其是中低收入国家,对加密货币的采用率很高,即使在最近的熊市中也保持了明显的弹性。我们的收益估算表明,这些国家的许多投资者已经从接受该资产类别中获益。

2024 年会发生什么?

到目前为止, 2023 年的积极趋势已经延续到了 2024 年,随着比特币 ETF 的批准和机构采用率的提高,比特币等知名加密资产创下了历史新高。如果这些趋势继续下去,我们可能会看到与 2021 年更加一致的收益。截至 3 月 13 日,比特币在 2024 年上涨了 65.4% ,ETH 上涨了 70.2% 。

Related Reads

Report Interpretation: J.P. Morgan Details Micron's Pre-Earnings Sentiment, Current Hardware Sector Dynamics

Morgan Stanley analyst Joshua Meyers' report (June 21, 2026) highlights key trends in the hardware and semiconductor sector ahead of Micron's earnings. The core takeaways are: 1. **Micron & Memory:** Memory remains a high-conviction long theme, driven by strong AI demand and rising ASPs. However, investor focus is shifting to the sustainability of Micron's >80% gross margins and the specifics of potential new long-term supply agreements (SCAs). 2. **Hardware Supply Chain:** AI-related demand for servers, networking, and storage remains robust, but company performance is diverging. Celestica (CLS) shows improved margin confidence, Western Digital and Seagate benefit from pricing, Fabrinet (FN) sees predictable AI optics growth, and Teradyne (TER) anticipates a new Google customer. 3. **AI Capex & WFE Forecasts:** JPMorgan increased its Wafer Fab Equipment (WFE) market growth forecasts to 28% in 2026 and 29% in 2027. AI infrastructure financing is evolving, with higher project-level debt reducing constraints on capex expansion. The report signals that while the AI-driven hardware cycle is strong, the market is entering a phase focused on execution verification (e.g., Micron's SCA details, Fabrinet's ramp with Amazon) and valuation sustainability. Key near-term signals include Micron's guidance, Arista Networks' outlook, and the pace of demand normalization post potential tariff-related pull-ins.

marsbit6h ago

Report Interpretation: J.P. Morgan Details Micron's Pre-Earnings Sentiment, Current Hardware Sector Dynamics

marsbit6h ago

Research Report Analysis: The Fed's New Chair's Debut – New Leader, But Same Script?

Report Analysis: Federal Reserve's New Chair Debut – A New Captain, But the Same Script? Morgan Stanley's chief global economist Seth B. Carpenter analyzes the first FOMC meeting under new Fed Chair Kevin Warsh in a June 21 report. Warsh deliberately avoided providing forward guidance on interest rates, aligning with his philosophy. However, market expectations for a rate hike this year were reinforced. Key signals lie elsewhere: inflation may fall more than expected, and quantitative tightening (QT) could be more aggressive than anticipated. The FOMC's "dot plot" suggests only one rate hike in 2026. Carpenter argues that if inflation undershoots forecasts, the logic for even a single hike weakens, especially as projections indicate potential rate cuts in 2027. On QT, Warsh's stance is clear. Carpenter notes that measures like halving the Treasury's account balance could shrink the Fed's balance sheet by around $500 billion with minimal market impact. Combined with adjustments to reserve interest and liquidity rules, the ultimate QT scale may exceed expectations, though its market effect might be less disruptive unless the Fed actively sells Mortgage-Backed Securities (MBS). While Warsh initiated a review of the Fed's policy framework, the 2% inflation target remains intact for now. The report concludes that the market may be overestimating the significance of reduced forward guidance and the near-term rate hike risk, while potentially underestimating the scope and manageable nature of the coming balance sheet reduction. The key debates will hinge on upcoming core PCE data, the specifics of the QT path, and the framework review's findings.

marsbit6h ago

Research Report Analysis: The Fed's New Chair's Debut – New Leader, But Same Script?

marsbit6h ago

Critical Game Week: BTC Retracement Confirmation vs. HYPE Support Battle | Guest Analysis

This weekly analysis outlines a critical juncture for BTC and HYPE markets, focusing on key price level confirmations. **BTC Analysis:** BTC is at a pivotal point after a five-wave rally from the June 5th low of $59,100. The price has broken below a short-term rising channel's lower boundary, with the current move seen as a pullback to test this breakdown. Failure to reclaim this level could lead to a retest of the $59,000-$60,000 support zone. The core scenario hinges on this channel retest outcome. * **Key Levels:** Resistance at $64,500-$65,000 (channel boundary) and $69,500-$70,500. Support at $59,000-$60,000 and $55,000. * **Strategy:** A core bearish stance is maintained (20% short from last week), with short-term plans for tactical trades. Three detailed contingency plans (A/B/C) are provided for short positions on resistance tests or breakdowns, emphasizing strict stop-loss discipline. **HYPE Analysis:** HYPE shows strong momentum but is currently in a corrective phase after hitting a new high of $76.94. The price is retesting the crucial $64-$66 support area. * **Key Levels:** Resistance near $77 and $80-$82. Support at $64-$66 and $52-$54. * **Strategy:** The short-term approach is "buy on dips, avoid chasing rallies." A long position is considered only if clear stabilization signals appear at the $64-$66 or deeper $52-$54 support zones, with tight risk controls. **General Risk Management:** A standardized trailing stop-loss protocol is emphasized: set initial stop, breakeven at +1% profit, then trail stops upward to lock in gains. *Disclaimer: All analysis is presented as a personal trading framework, not investment advice. Market conditions are complex and require dynamic adjustment.*

marsbit6h ago

Critical Game Week: BTC Retracement Confirmation vs. HYPE Support Battle | Guest Analysis

marsbit6h ago

Trading

Spot
Futures
活动图片