At the end of 2025, the crypto market is at a critical juncture. Bitcoin (BTC) is hovering around $90,000, the market Fear & Greed Index has dropped to 25 (Extreme Fear), and short-term holder capitulation has reached the second-highest level in history, second only to the bottom of the 2024 Yen carry trade crash. The December 10th FOMC meeting has concluded, with the Federal Reserve (Fed) cutting interest rates by 25 basis points as expected by the market, lowering the federal funds rate to 3.50%-3.75%, but the forward guidance turned hawkish—only one rate cut is expected in 2026. This caused BTC to briefly fall below the $90,000 mark, with a muted market reaction and a "buy the rumor, sell the news" pullback.
However, the Fed also initiated a "Reserve Management Purchases" (RMP) plan, injecting $40 billion in short-term Treasury liquidity monthly, which is seen as a "non-QE" signal of moderate easing that could reshape market dynamics in 2026. In this "year-end final exam," should one "hold coins for the holiday" to welcome a potential rebound, or "take profits off the table" to lock in gains? This article combines the impact of the FOMC, on-chain data, institutional trends, and historical patterns to discuss allocation strategies and outlooks for 2026 positioning.
FOMC Decision Interpretation
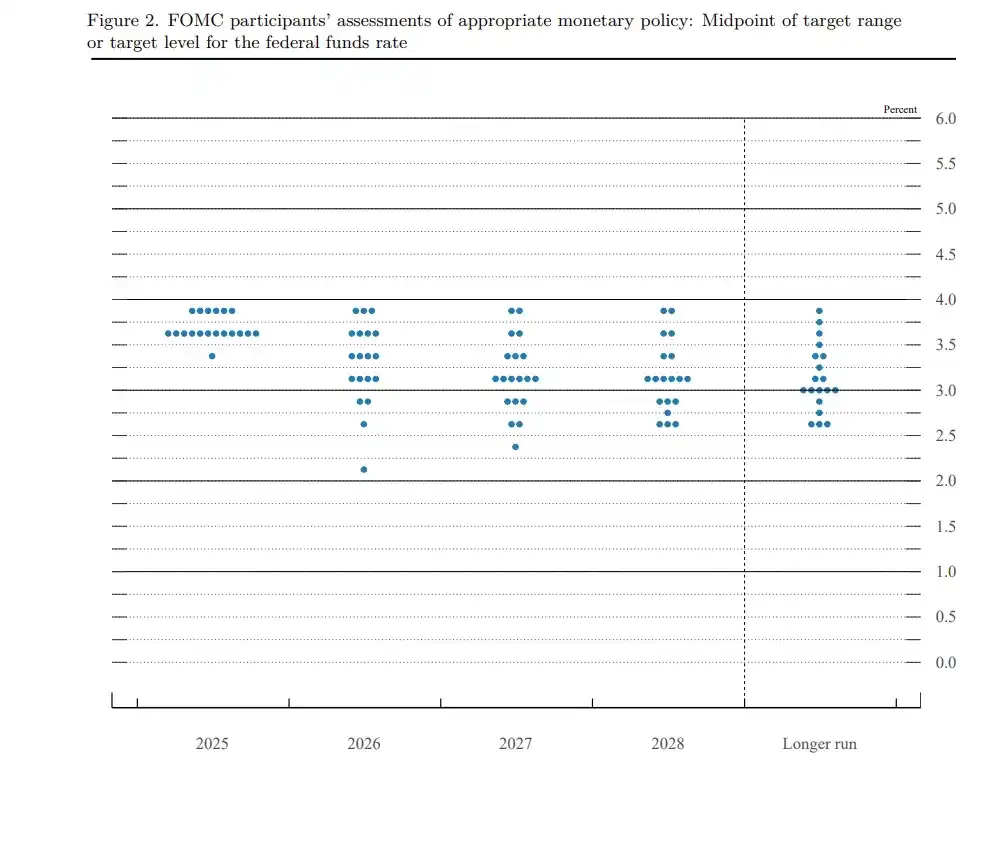
Liquidity Turning Point Under Hawkish Rate Cut The FOMC meeting was the final monetary policy decision of 2025. This one passed the rate cut with a 9:3 split, but the "dot plot" showed a slower rate cut path for 2026, with only one 25 basis point cut remaining.
This reinforces the "hawkish cut" narrative: the Fed is worried about rebounding inflation and a soft landing in the job market and is unwilling to ease too aggressively in the short term. The market had priced in an 89% probability of a cut, leading to only minor BTC fluctuations after the event, while ETH consolidated around $3,000.
Dual impact on crypto:
- Short-term pressure: Hawkish guidance increases risk aversion. BTC did not rebound to the expected high of $94,000 but instead triggered tens of billions of dollars in leveraged liquidations. Year-end thin liquidity (e.g., perpetual open interest down 40%-50% from October), combined with the Bank of Japan (BOJ) decision, makes the market prone to "pump and dump" behavior.
- Long-term positive: QT (Quantitative Tightening) officially ended on December 1st. The Fed's balance sheet shrank from $9 trillion to $6.5 trillion before starting to rise again. The RMP plan is equivalent to "stealth QE," expected to inject trillions in liquidity in 2026, driving a reassessment of risk assets. Historical data shows liquidity turning points often trigger crypto rebounds (e.g., BTC surged after the Fed pivot in 2024). Furthermore, explosive growth in global M2 money supply, a weakening DXY US Dollar Index, and stimulus policies from China/the EU will further tilt capital towards risk assets.
The FOMC reinforced the "macro-dominated" narrative. Crypto is no longer driven solely by cycles but is increasingly correlated with stocks/AI assets. Short-term volatility is intensifying, but liquidity injections are paving the way for 2026.
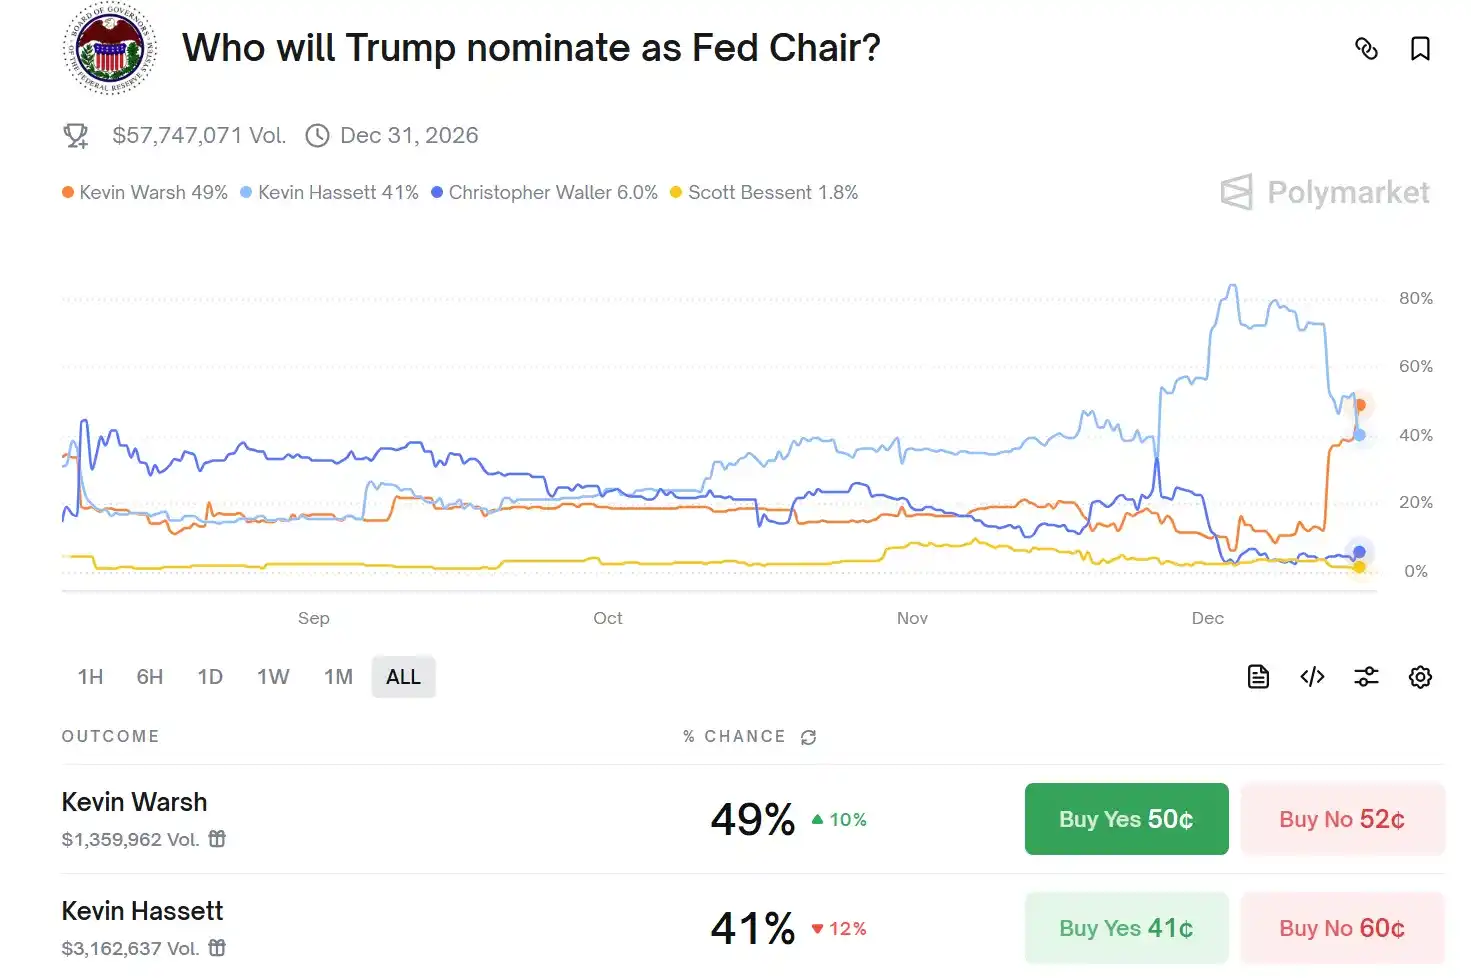
The appointment of the new Fed Chair will also be a key variable for the 2026 liquidity environment. Jerome Powell's term as Chair officially ends in May 2026 (his term as Governor lasts until January 2028). President Trump has stated he will announce the successor nominee in early 2026. Current top candidates focus on the "two Kevins": National Economic Council Director Kevin Hassett (advocates for more aggressive rate cuts) and former Fed Governor Kevin Warsh (recently visited the White House, emphasizing consulting the President on interest rate views).
A Chair more aligned with Trump and more inclined towards easing policies could strengthen the 2026 rate cut path and accelerate liquidity injection, resonating with policies like the RMP plan and a national Bitcoin reserve, further boosting confidence in risk assets.
Institutional Trends Preview: 2026 Layout—From "Defense" to "Structural Participation"
2025 is seen as the "Year of Crypto Mainstreaming." Institutional entry is no longer an edge experiment but a systemic shift. According to a16z's "State of Crypto 2025 Report," traditional financial institutions like Visa, BlackRock, Fidelity, and JPMorgan Chase have fully launched crypto products, while tech-native players like PayPal and Stripe are doubling down on payment infrastructure.
This marks a paradigm shift from "retail-led" to "institution-led": A joint survey by EY-Parthenon and Coinbase shows 83% of institutional investors plan to increase crypto allocation in 2025, with DeFi exposure expected to jump from 24% to 75%, focusing on derivatives, lending, and yield opportunities.
Institutional Allocation Trends: From Single BTC Allocation to Multi-Asset Portfolios
- BTC remains core, but its share is declining: BTC as "digital gold" continues to dominate institutional positions (ETF AUM exceeds $168 billion, accounting for 60-80% of institutional crypto exposure), but institutions see it as a low-correlation diversification tool rather than a single speculative asset.
- Expansion into ETH, Altcoins, and emerging assets: Institutions are adding ETH (attracted by staking yields), Solana (high TPS and institutional partnerships), stablecoins (payment infrastructure), and RWA (real-world asset tokenization). A Coinbase report shows 76% of institutions plan to invest in tokenized assets in 2026, focusing on tokenized Treasuries, private equity, and bonds, offering instant settlement and fractional ownership.
- Pension funds and sovereign wealth funds testing the waters: Although mostly indirect exposure (e.g., Norwegian fund holding BTC via MicroStrategy), direct allocations of 0.5-3% are expected to increase in 2026 (via ETFs or tokenized instruments). Reports from BlackRock et al. indicate sovereign and pension funds are seriously considering crypto as a long-term diversification hedge, with gradually increasing allocation ratios.
Historical Pattern: BTC's Year-End "Spring Festival Effect"
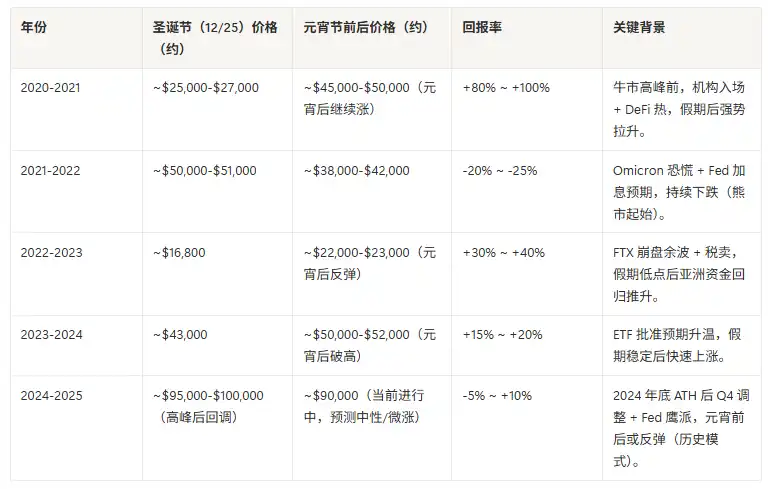
Drivers of the "Christmas Low - Spring Festival Rally" Pattern
Western liquidity drought: From December 20th to early January, European and US institutions enter holiday mode, and trading volume plummets. In a low-liquidity environment, any selling pressure amplifies volatility, forming technical lows.
Asian capital回流 (inflow): Around the Spring Festival (late January to mid-February), year-end bonuses and red packets are distributed in Mainland China, Hong Kong, Singapore, etc., leading retail and high-net-worth individuals to increase risk asset allocations. Historical data shows that BTC buying volume on Asian exchanges (like Binance, OKX) typically rises in the two weeks before the Lunar New Year.
Institutional rebalancing: January marks the start of the new fiscal year for institutions. Pension funds and hedge funds reassess asset allocations. If BTC shows relative resilience in December (e.g., only a 5-10% pullback in 2025), institutions tend to add positions in January to catch up with benchmark returns.
On-Chain Data: Dense Appearance of Bottom Signals
After the hawkish FOMC rate cut landed, the crypto market entered a typical "year-end low liquidity" phase. Bitcoin (BTC) fluctuated repeatedly in the $88,000-$92,000 range, and the Fear & Greed Index fell to 25 (Extreme Fear). Superficially, this is a "sell the news" pullback. But on-chain data reveals more structural signals: deep capitulation by short-term holders, continued accumulation by long-term holders, accelerated outflow from exchange reserves, and bottoming characteristics in medium-to-long-term indicators. This data suggests the current situation is not a simple bear market but rather a "mid-cycle adjustment + washout" phase within a bull market.
1. Short-Term Holder (STH) Capitulation: Pain Nearing its End
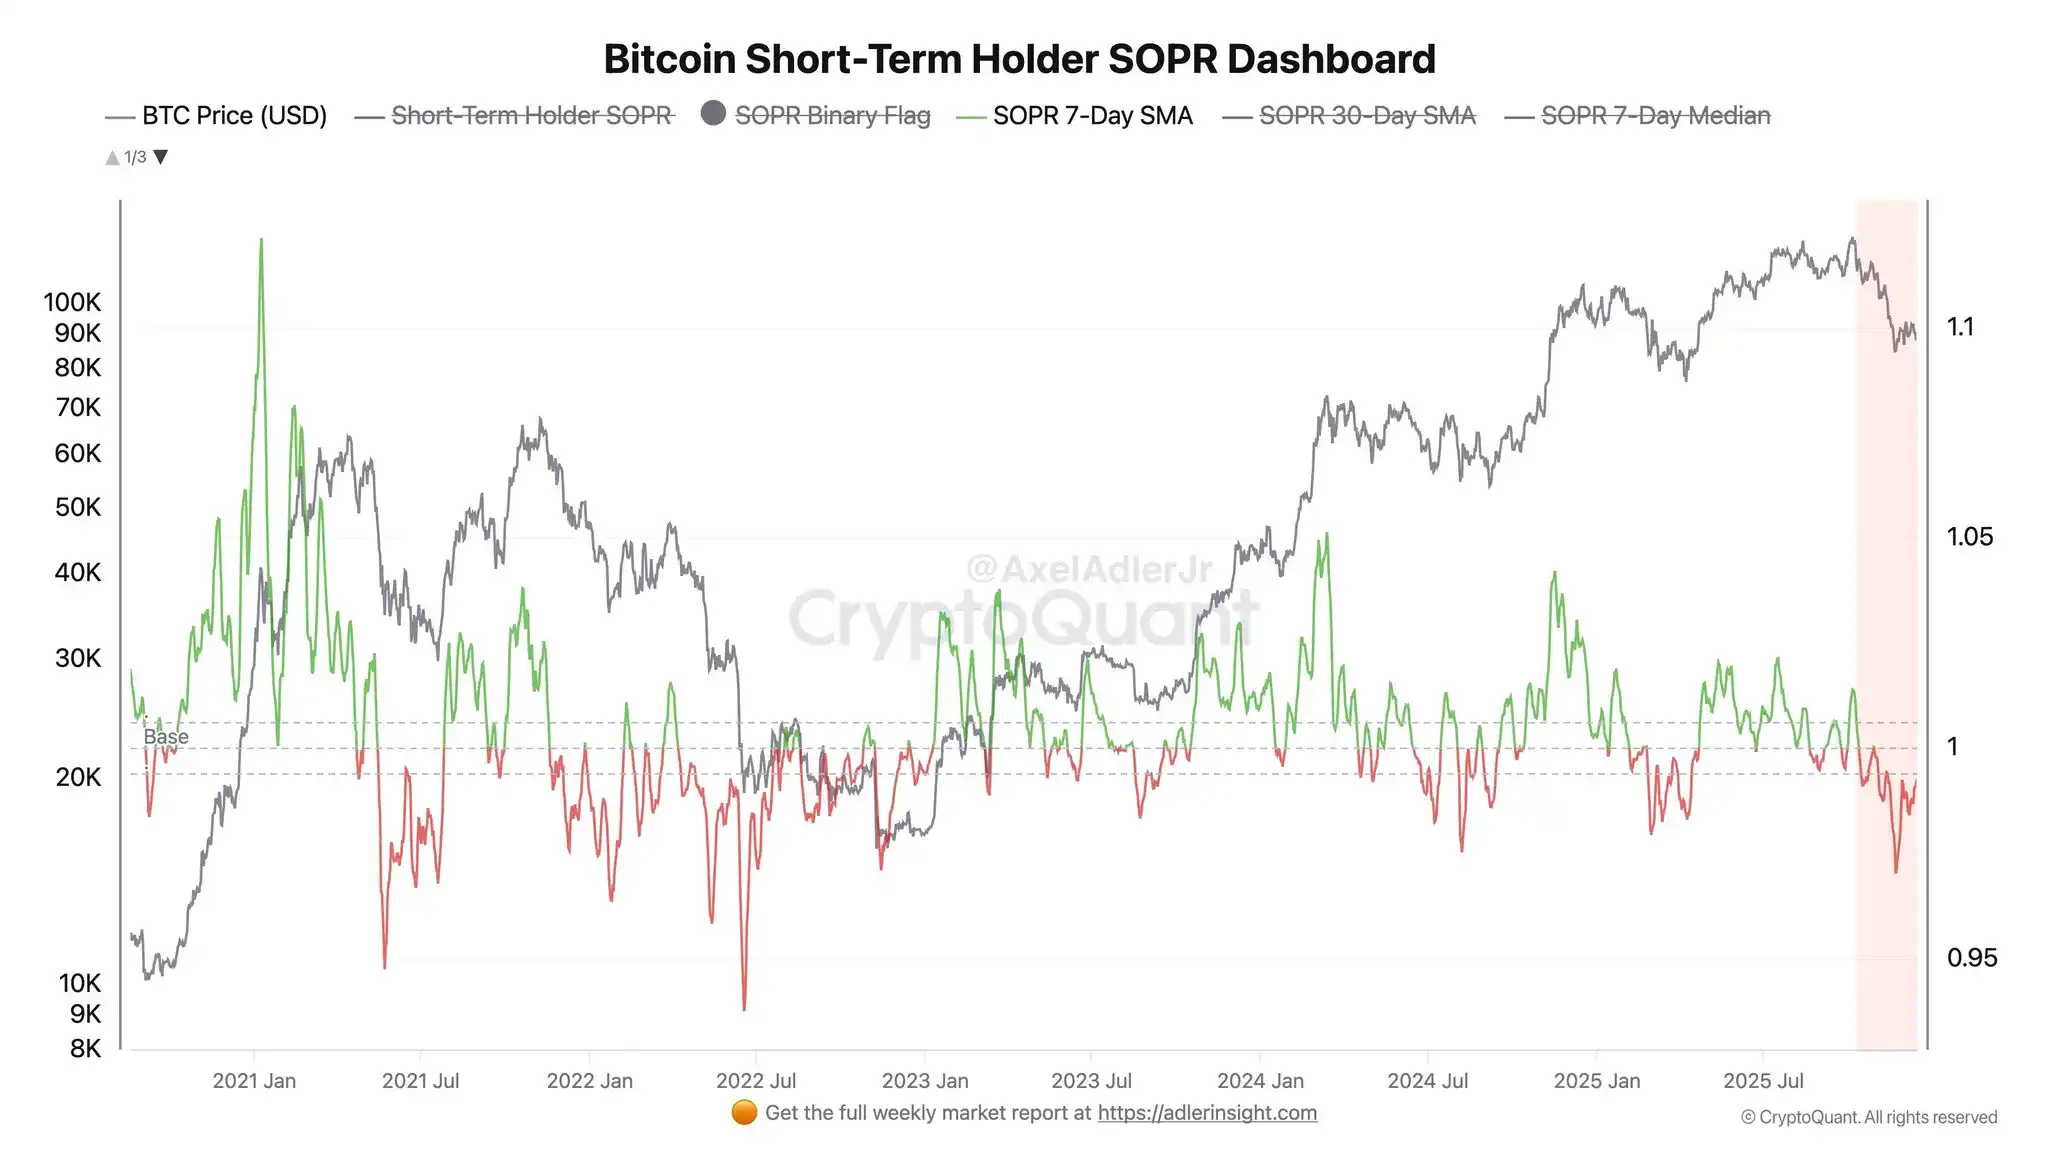
- Realized Loss Scale: Over the past 30 days, short-term holders (holding <155 days) realized losses exceeding $4.5 billion, second only to the $5.2 billion during the August 2024 Yen carry trade crash (Glassnode data). This indicates leveraged players and FOMO retail have largely capitulated.
- SOPR Indicator: The Short-Term Holder SOPR (Spent Output Profit Ratio) has remained below 1 (average selling at a loss) for over 3 weeks. History shows that after such deep capitulation, BTC often finds a阶段性 bottom within 1-3 months.
2. Exchange Reserves & Withdrawals: Strengthening De-platforming Trend
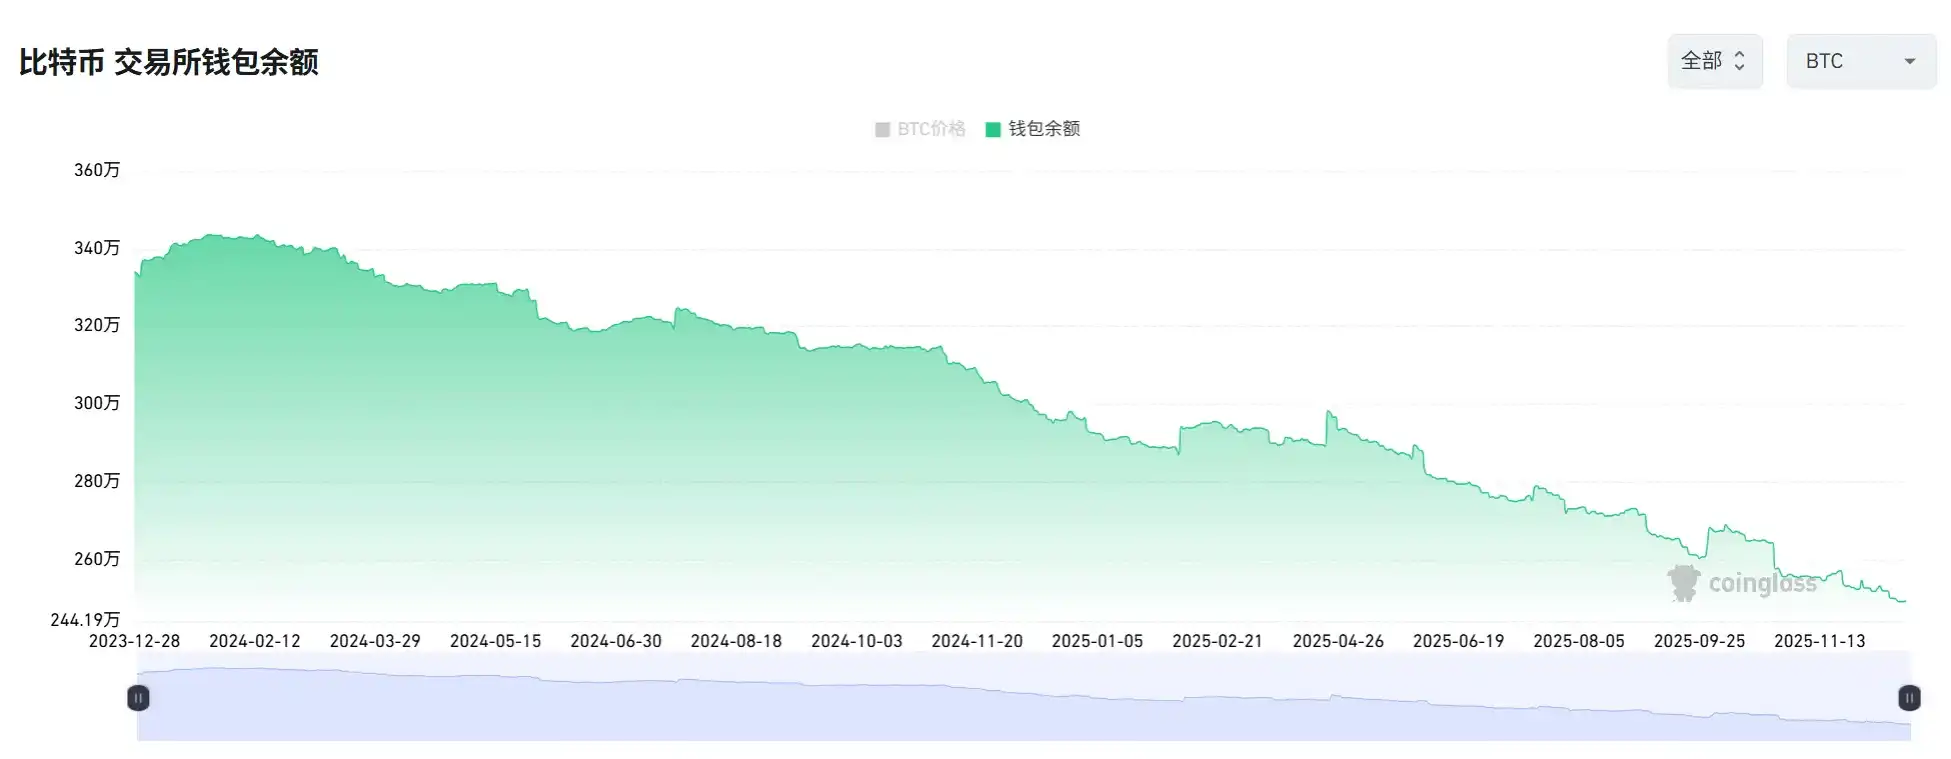
- Exchange BTC Balance: Over the past 30 days, BTC reserves across all exchanges decreased by approximately 120,000 BTC (about 2.5%), falling below 2.6 million (CryptoQuant), the lowest level since 2018.
- ETH Exchange Reserves: Decreased by about 1.2 million ETH during the same period, with withdrawal speeds hitting a 2025 high, reflecting strong staking and self-custody demand.
- Stablecoin Reserves: Exchange balances of USDT/USDC saw seasonal declines, but active on-chain addresses and transfer volumes remained stable, indicating capital has not left the market but moved to cold storage awaiting re-entry.
Capital outflow from exchanges often预示 a price bottom, reducing selling pressure while building momentum for a subsequent rebound.
3. Medium-to-Long-Term Indicators: Dense Bottom Signals
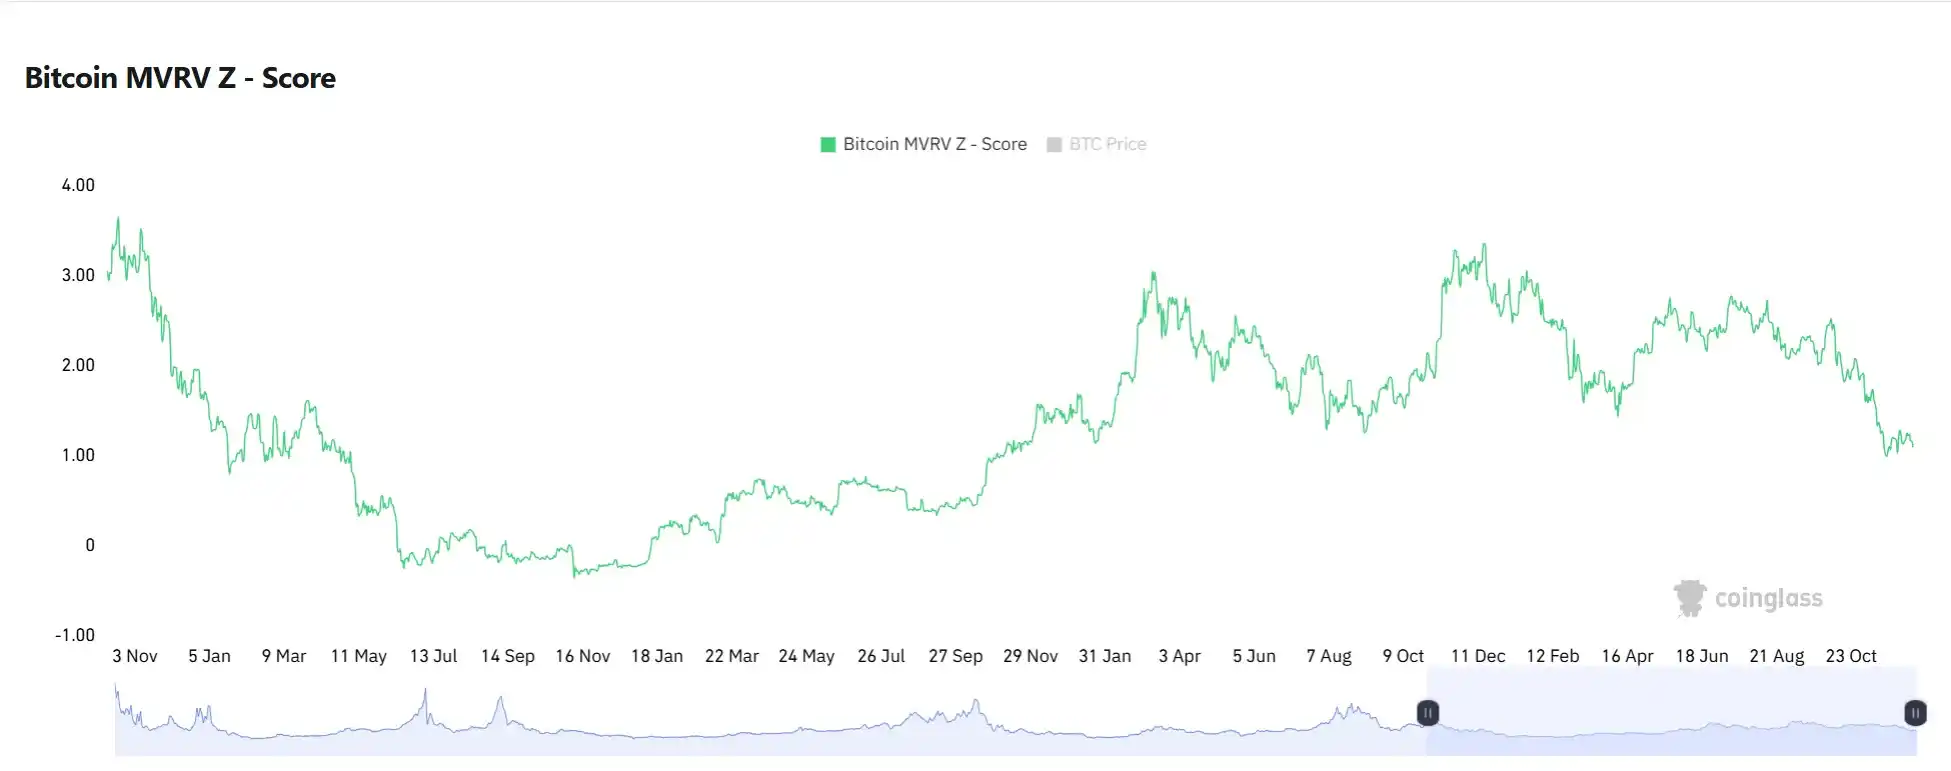
- MVRV Z-Score: Currently at 1.1, entering the historical "green buy zone."
- RHODL Ratio: Has fallen to levels seen at the bottom of the 2022 bear market, indicating market fervor has completely cooled.
- Puell Multiple: The miner revenue indicator fell back to 0.6. Historical lows often accompany price reversals after mining capitulation.
- Active Addresses & Volume: Although sluggish short-term, the 30-day MA has not seen a cliff-like drop, unlike the "activity exhaustion" at the 2021 bull market top.
Allocation Strategy: Finding Certainty Amid Uncertainty
The market is at a rare confluence:
- Short-term sentiment is extremely fearful (Fear & Greed Index 25), but on-chain data shows密集 bottom特征
- The historical "Christmas Low - Spring Festival Rally" pattern provides seasonal support, validated three times in the past five years
- Macro liquidity is about to turn (QT end, RMP start), but is still suppressed by hawkish guidance short-term
- The institutionalization process is accelerating, shifting market structure from "speculation-driven" to "allocation-driven"
For investors seeking long-term value, the current environment provides a relatively clear risk-reward framework: deep capitulation by short-term holders, accelerated outflow from exchange reserves, continued accumulation by long-term holders, and valuation indicators like MVRV and RHODL entering historical buy zones—these signals have historically marked the opening of medium-to-long-term allocation windows. For traders focused on liquidity management, December's liquidity drought period is both a risk and an opportunity. Maintaining sufficient flexibility, preserving ammunition during market panic, and acting顺势 when the Spring Festival effect is validated might be wiser than chasing short-term fluctuations.
Data for this report was compiled by WolfDAO editorial team; please contact us for updates if you have questions;
Author: Nikka / WolfDAO ( X : @10xWolfdao )