2025 Prediction Market Review: Total Trading Volume Exceeds $50 Billion, Top Two Players Hold Over 97.5% Market Share

Odaily星球日报Published on 2026-01-08Last updated on 2026-01-08

Abstract

2025 Prediction Market Review: Total Trading Volume Exceeds $50 Billion, Duopoly Holds Over 97.5% Market Share In 2025, the prediction market sector reached a total trading volume of $50.25 billion, with Kalshi and Polymarket dominating the landscape by capturing over 97.5% of the market share. The remaining ecosystem accounted for just $1.25 billion in trading volume, involving emerging platforms like Azuro, TrendleFi, and others. Kalshi reported a record-breaking year with a nominal trading volume of $23.8 billion, marking a 1,108% year-over-year increase. December alone saw $6.38 billion in trades, setting multiple historical highs. Polymarket’s annual volume was estimated at approximately $22 billion, though data varied across sources like DefiLlama and Dune. Sports dominated Kalshi’s trading volume (85%), while Polymarket saw a more diversified distribution: sports (39%), politics (34%), and cryptocurrency (18%). Other categories like economics and tech/science also saw significant growth, with open interest expanding substantially throughout the year. Trading activity surged in the second half of 2025, driven by major events and elections. November and December were particularly strong, with combined monthly volumes for Kalshi and Polymarket nearing $10 billion and exceeding $13 billion, respectively. The top platforms by historical trading volume were Kalshi ($27.1B), Polymarket ($23.2B), Opinion ($13.1B), Limitless ($512M), and Azuro ($444M). The sector is poised...

Original|Odaily Planet Daily(@OdailyChina)

Author|Wenser(@wenser 2010 )

As 2025 concludes, the prediction market sector has delivered its report card.

According to data from PredictionIndex.xyz, the total trading volume in the prediction market sector for 2025 reached $50.25 billion. Excluding Kalshi and Polymarket, the trading volume for the rest of the ecosystem was $1.25 billion. Additionally, data released by KalshiData shows that Kalshi's total nominal trading volume for the year reached $23.8 billion, a year-on-year increase of 1108%. With both Polymarket and Kalshi achieving valuations exceeding $10 billion, these results undoubtedly provide a strong boost of confidence to the capital markets and user base. In 2026, the prediction market sector will continue to be a focal point in crypto.

Odaily Planet Daily will provide a梳理 (overview) and brief analysis of the overall 2025 prediction market data in this article for readers' reference.

Overall Scale of the 2025 Prediction Market: The $50 Billion Level, Kalshi and Polymarket Hold Over 97.5% Market Share

PredictionIndex.xyz conducted end-to-end index tracking of the prediction market ecosystem, covering markets, infrastructure, end-users, and new experimental projects. The final results are as follows—

  • According to incomplete statistics from the platform, the total trading volume of the prediction market in 2025 was approximately $50.25 billion.
  • Excluding Kalshi and Polymarket, the trading volume for the rest of the ecosystem was $1.25 billion.
  • This long-tail market is crucial for testing and evolving new market designs, incentives, and ideas, involving projects such as azuroprotocol, TrendleFi, hyperstiti0ns, Limitless, MyriadMarkets, overtime, footballdotfun, xodotmarket, predictonfliq, DGbet_official, and BRKTgg.
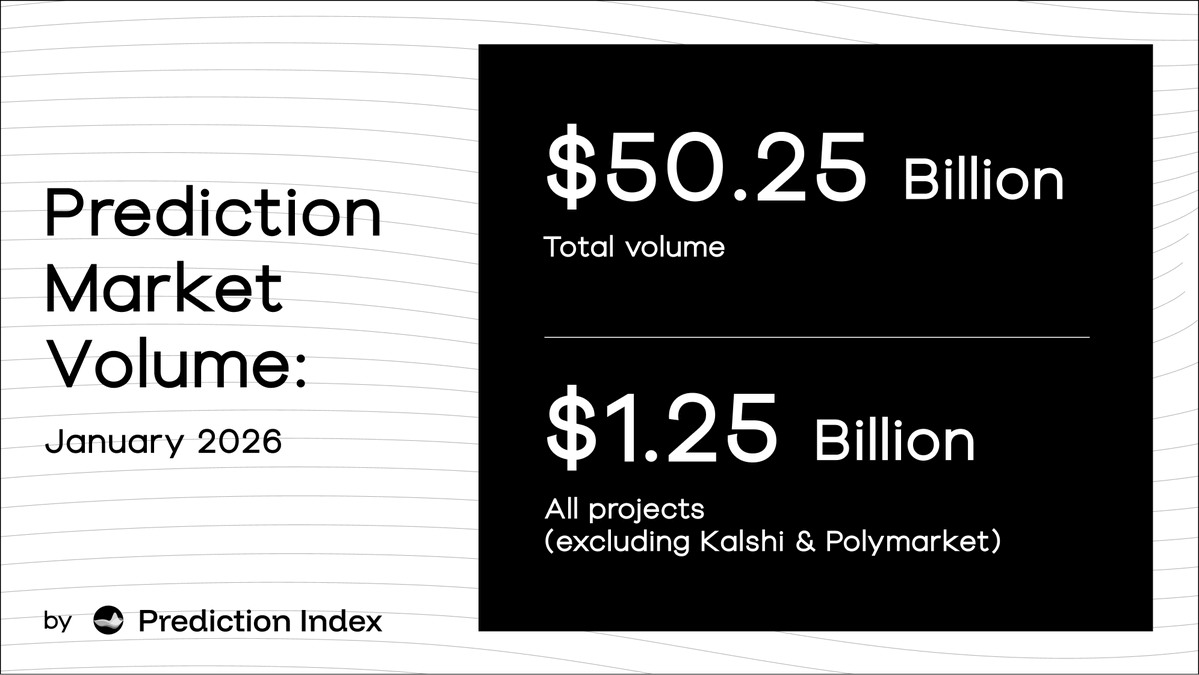
If such data shows us the current "duopoly"格局 (landscape) of the prediction market, then the 2025 annual data provided by KalshiData, under the Kalshi platform, gives us a more detailed view of the火热程度 (hotness) of the current popular sectors.

Kalshi's 2025 Report Card: Trading Volume Reaches $23.8 Billion, Over 11x Year-on-Year Growth

On January 3rd, KalshiData announced that Kalshi achieved record growth across all metrics in 2025.

In terms of nominal trading volume, the annual total reached $23.8 billion, a year-on-year increase of 1108%, approximately 12.1 times.

  • December set a monthly historical high of $6.38 billion;
  • The 4th week of December set a weekly historical high of $1.7 billion;
  • December 21st set a daily historical high of $381.7 million.

In terms of the number of trades, the annual total reached 97 million, a year-on-year increase of 1680%, approximately 17.8 times.

  • December saw 27.67 million trades;
  • The 4th week of December saw 7.6 million trades;
  • December 21st saw 1.5 million trades, all setting historical highs.

In terms of open interest, the total reached $225 million, a year-on-year increase of 169%, approximately 2.7 times.

  • March 9th set a daily historical high of $533 million,
  • The 1st week of March set a weekly historical high of $530 million,
  • February set a monthly historical high of $499.5 million.

In terms of the number of contracts traded, the annual total reached 23.8 billion, a year-on-year increase of 1108%, approximately 12.1 times.

  • December set a monthly historical high with 6.38 billion contracts;
  • The 4th week of December set a weekly historical high with 1.7 billion contracts;
  • December 21st set a daily historical high with 382 million contracts.

According to data from the KalshiData website, since its launch on June 28, 2021, Kalshi's historical total trading volume has reached $2,725,575,718, with a daily average trading volume of $16,619,364, and a total number of trades of 27,242,274,566.
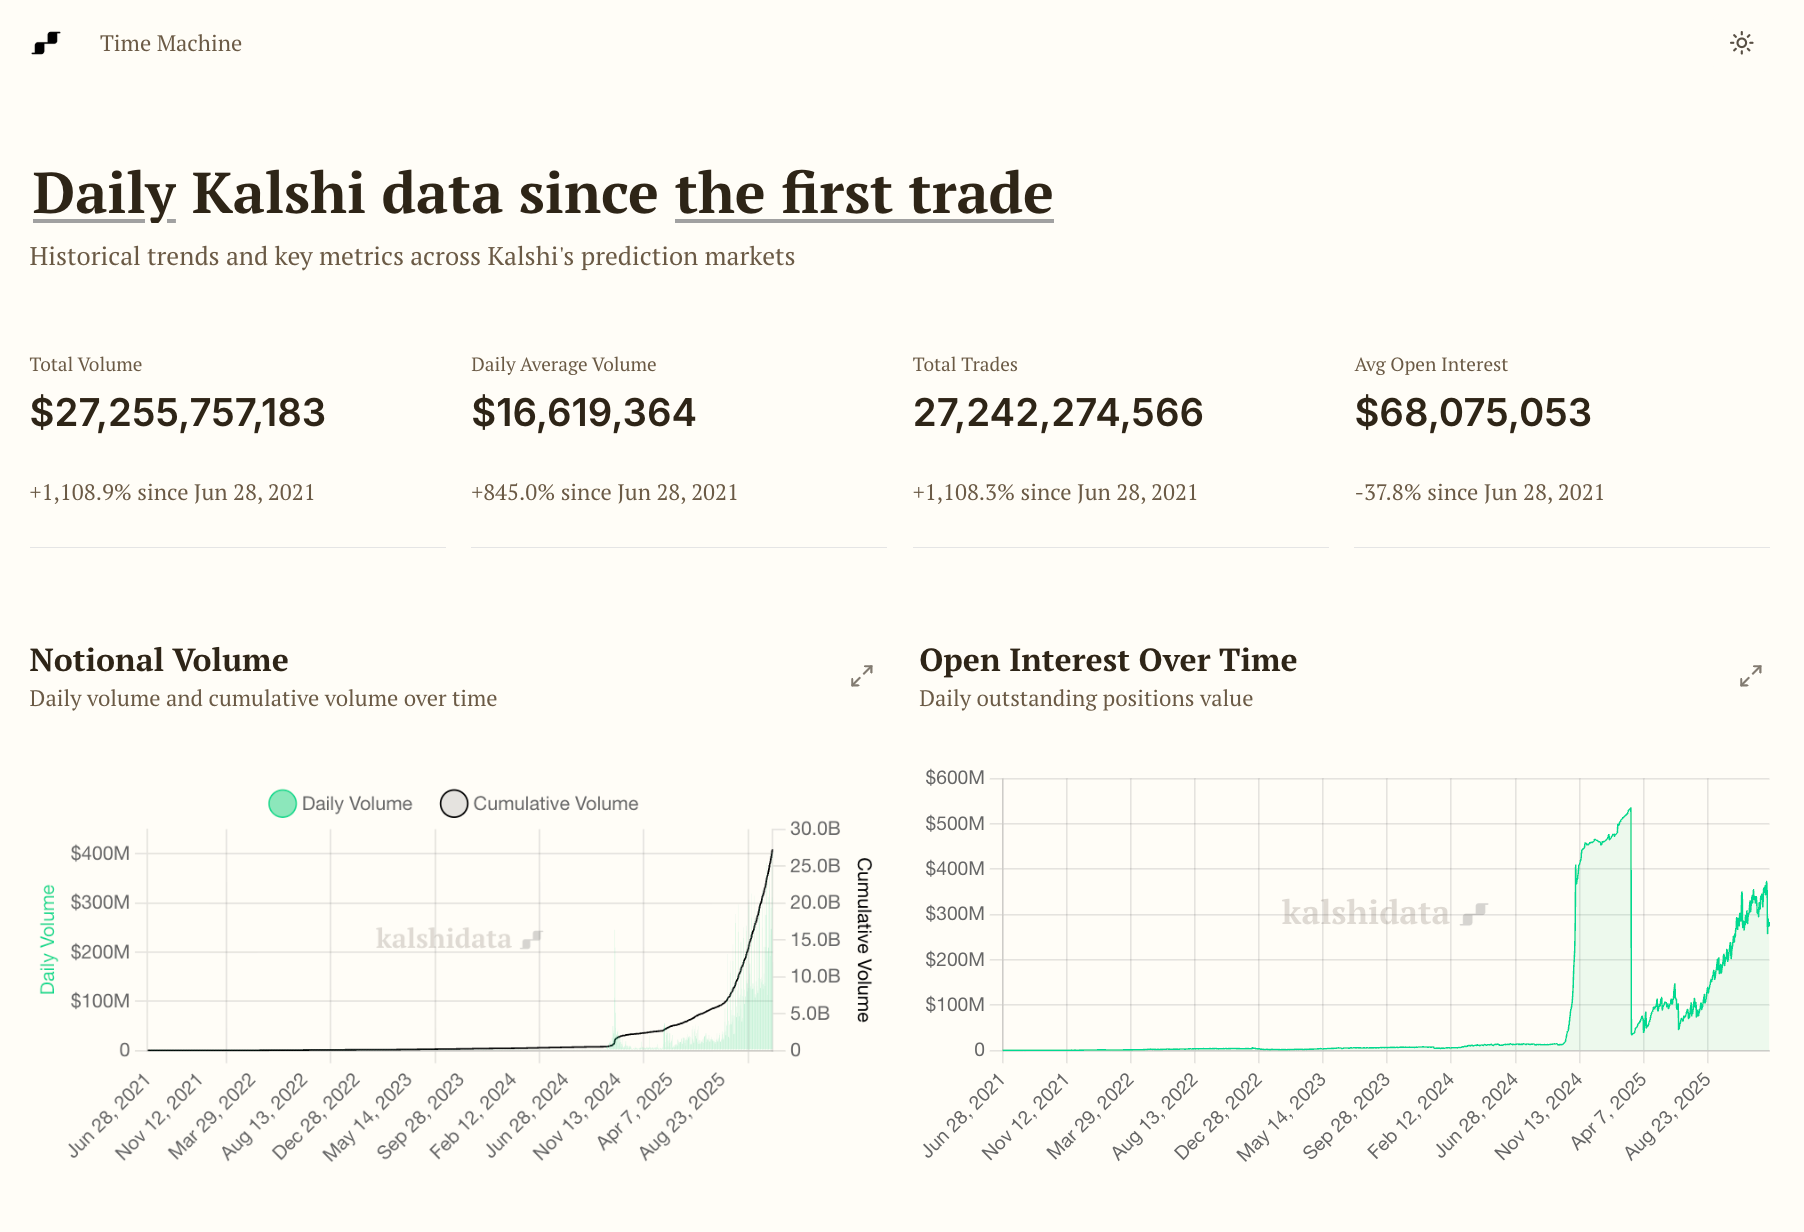
As for Polymarket, although it promotes the concept of an "on-chain prediction market," perhaps due to differences in statistical calibers and trading data channels, its 2025 trading volume data is relatively模糊 (vague).

Polymarket's 2025 Report Card: Trading Volume Estimated Around $22~25 Billion

According to DefiLlama data, Polymarket's annual DEX trading volume for 2025 was approximately $10.5 billion.

According to information from a Dune dashboard, Polymarket's annual trading volume for 2025 was approximately $22.5 billion.

According to information from the PredictionIndex.xyz website, Polymarket's historical cumulative trading volume is $23.2 billion.

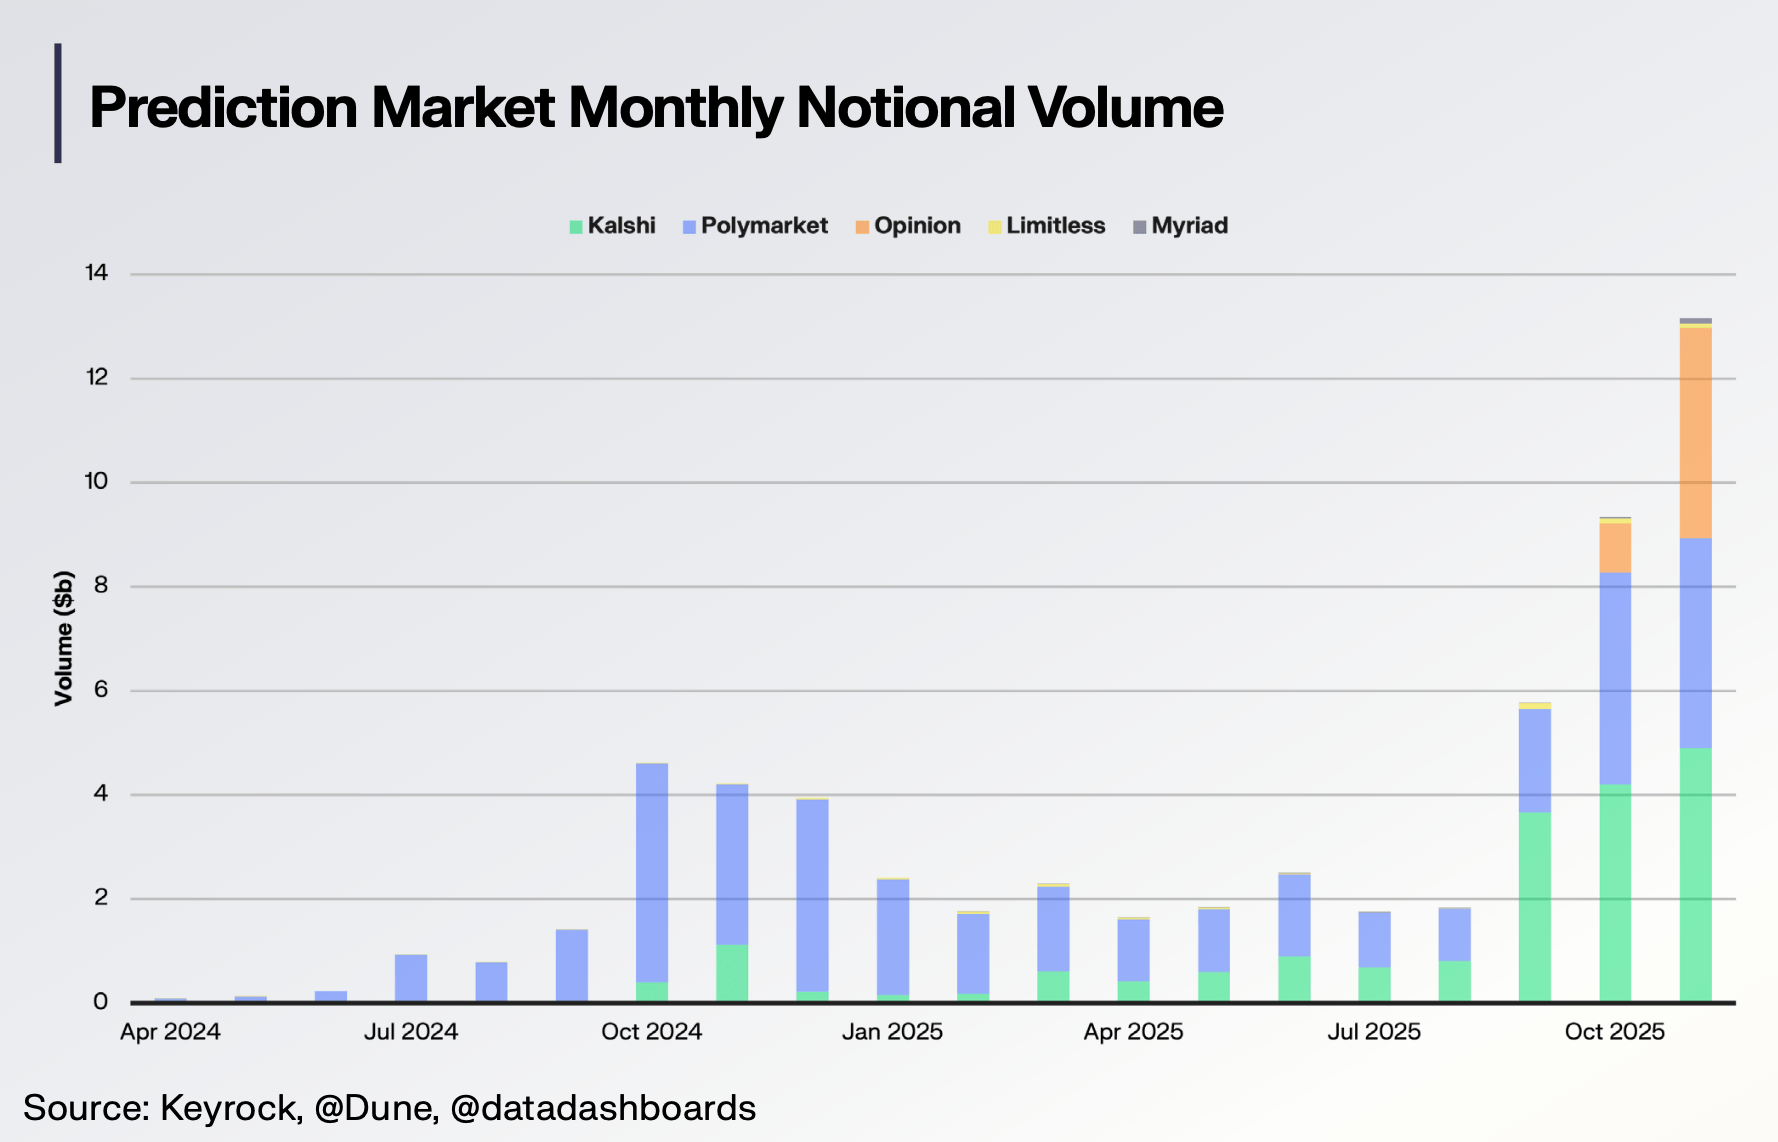
According to the "Prediction Market Report" jointly issued by Keyrock and platforms like Dune, the total transaction volume of the prediction market in 2025 was $44 billion, of which Polymarket's trading volume was approximately $21.5 billion (Odaily Planet Daily Note: In contrast, Kalshi's trading volume was about $17.1 billion).

综合以上信息以及 Kalshi 官方平台在前文中给出的 “Kalshi 年度交易量为 238 亿美元”的数据来看,我们取一个相对中间值,预估 Polymarket 2025 年总体交易量约为 220 亿美元左右。 (Synthesizing the above information and the data "Kalshi's annual trading volume is $23.8 billion" given by the official Kalshi platform earlier, we take a relatively median value and estimate Polymarket's total trading volume for 2025 to be approximately $22 billion.)
Prediction Market Segments: Sports Rank First, Political Events and Crypto Rank Second and Third

According to relevant information from the "Prediction Market Report" jointly issued by Keyrock and platforms like Dune, specifically regarding prediction market betting events,

In 2025, Kalshi still focused on sports, with sports accounting for about 85% of the nominal trading volume.

In contrast, Polymarket exhibited a more diversified portfolio—

Sports (39%), politics (34%), and cryptocurrency (18%) together drove over 90% of prediction market betting activity.
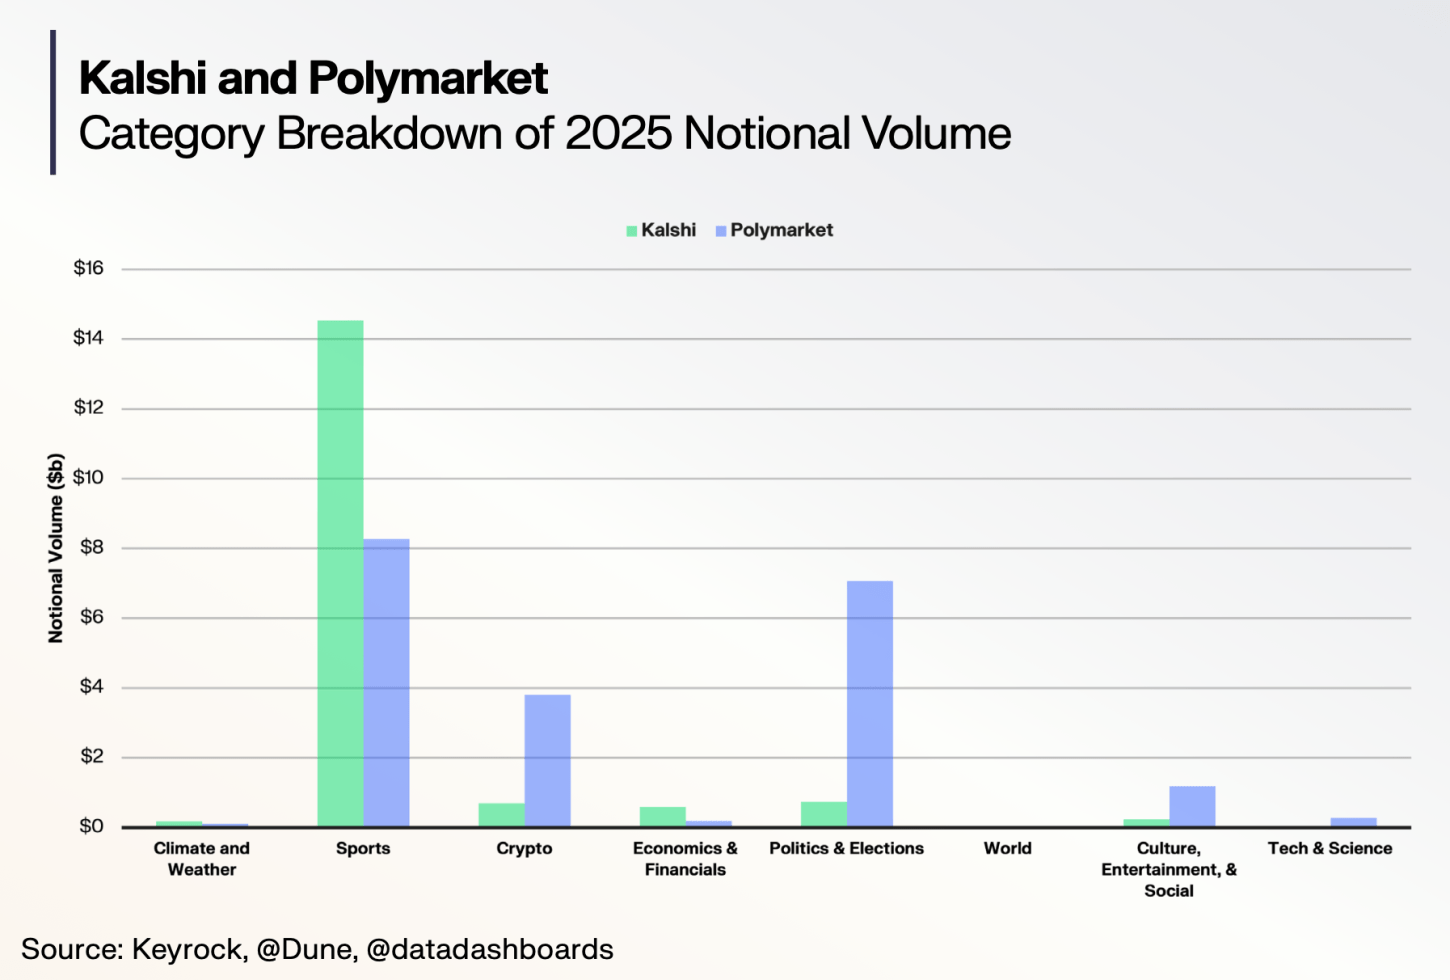
Furthermore, calculated by trading volume,

  • Trading volume for prediction events in the economics field grew 905%, reaching $112 million;
  • Trading volume for prediction events in technology and science grew 1637%, reaching $123 million;
  • Open betting events were led by economics (grew 7x to a market size of about $800 million) and social & culture (grew 6x to a market size of about $700 million), showing increasing use for macro hedging and long-term positioning.
  • Other categories (e.g., culture, society) also saw significant growth, with the overall contract opening trading size growing from about $3.3 billion at the beginning of 2025 to around $13 billion, indicating a substantial improvement in market depth and liquidity.

Prediction Markets Also Have "Peak and Off-Peak Seasons": The Second Half of the Year Saw a Trading Volume Surge

It is worth noting that, as of late August 2025, data showed that Polymarket's trading volume was still maintained at a market size of around $7.5~8 billion. However, with the surge of various unexpected events, political events, and sporting events in the second half of the year, both Polymarket and Kalshi experienced a "trading explosion period":

September: Combined trading volume of Kalshi and Polymarket reached $1.44 billion;

October: Prediction market trading volume reached $8.7 billion, with Kalshi leading and Polymarket following;

November: Combined trading volume of Kalshi and Polymarket approached $10 billion,其中 (among which), Kalshi's trading volume reached $5.8 billion, a month-on-month increase of 32%; Polymarket's trading volume reached $3.74 billion, a month-on-month increase of 23.8%.

In December 2025, analyst Patrick Scott stated that in November 2025, prediction market trading volume exceeded $13 billion, more than three times the trading volume during the peak of the 2024 election. Polymarket, Kalshi, and OPINION accounted for the vast majority of the trading volume. Binary options are now applied to political speeches, sporting events, and listed company earnings reports, becoming a probability layer for world events and news.

Combined with Kalshi's December trading volume of $6.38 billion, Polymarket's trading volume势必同样不遑多让 (must surely be equally impressive). The overall prediction market trading volume in December 2025 might have reached a scale of $13-15 billion.

Top 5 Star Players in the Prediction Market: Kalshi, Polymarket, and Others

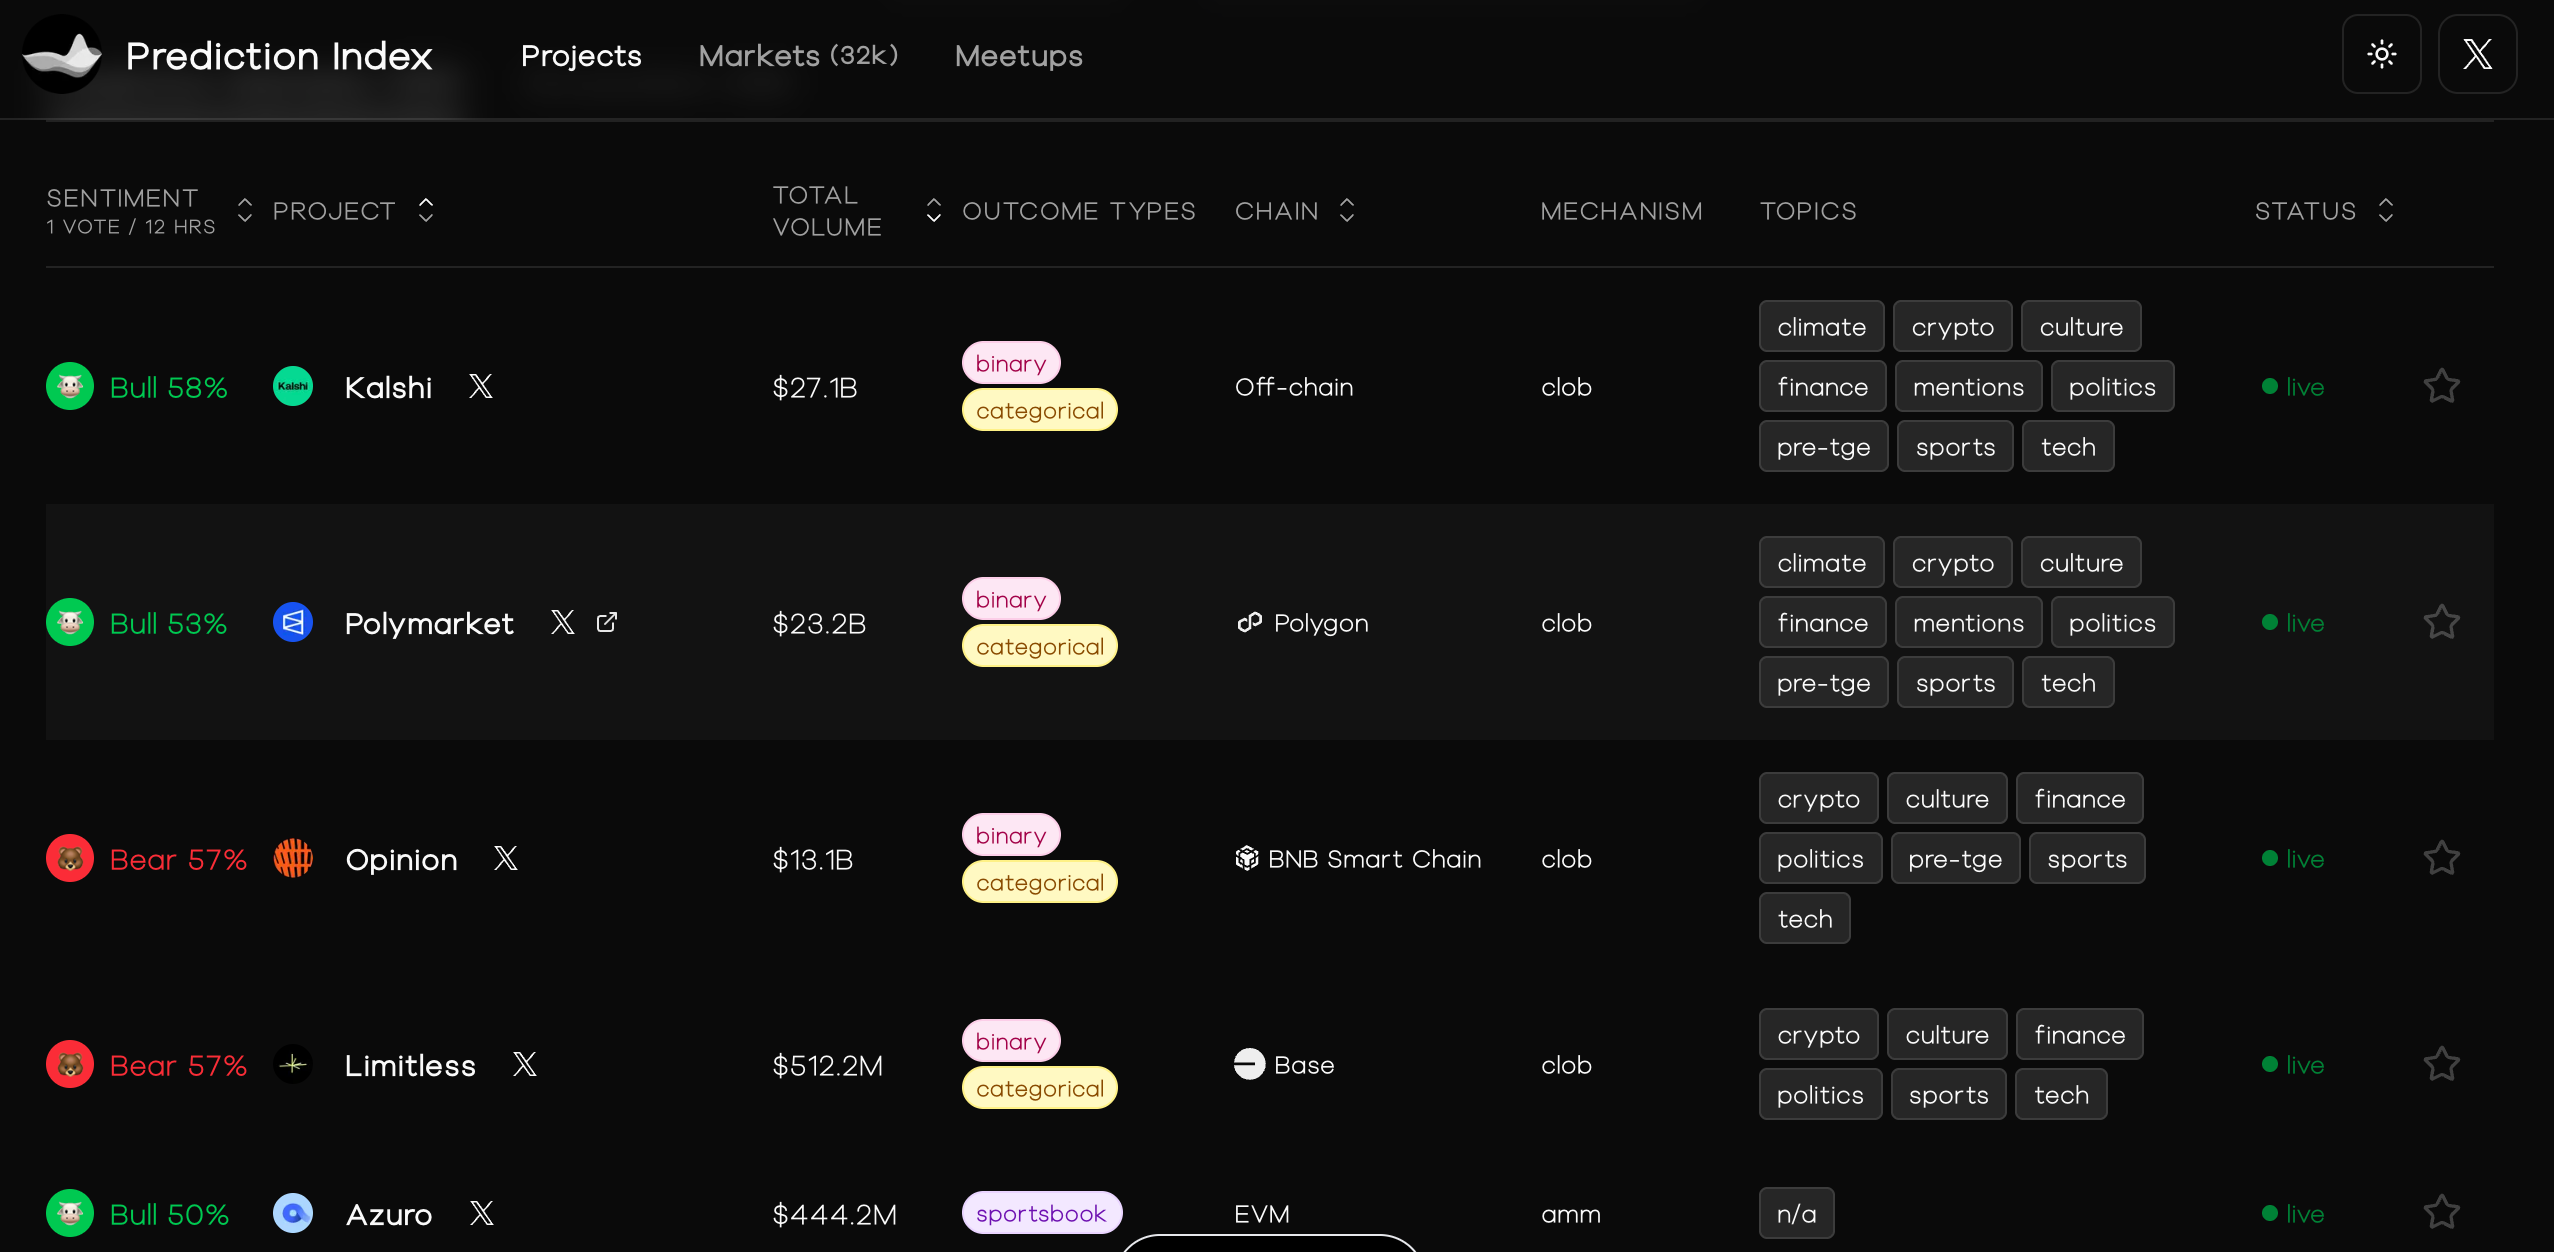
Finally, we can refer to the existing statistical data on the PredictionIndex.xyz website. As of the time of writing, the Top 5 platforms by prediction market trading volume are the following players:

  • Kalshi, platform historical trading volume approximately $27.1 billion;
  • Polymarket, platform historical trading volume approximately $23.2 billion;
  • Opinion, platform historical trading volume approximately $13.1 billion (Odaily Planet Daily Note: Considering the platform's launch time and platform mechanisms, there may be issues with wash trading. Here we only use the data statistics platform information as a reference);
  • Limitless, platform historical trading volume approximately $512 million;
  • Azuro, platform historical trading volume approximately $444 million.
Previously, Kalshi's CEO stated that the prediction market size is around $150 billion. Although the final total trading volume for 2025 was only one-third of what he mentioned, considering that the prediction market sector was not even fully formed in 2024, his statement of a "$150 billion market size" is not空谈 (empty talk). Combined with the certainty of major prediction events in 2026 such as the US midterm elections and the World Cup and other large sporting events, the overall market size of the prediction market in 2026 may still maintain 10x growth.

Of course, as we mentioned earlier in "Only One in Ten Prediction Markets Will Survive Until the End of the Year, Not an Exaggeration," a hot sector does not mean all projects and platforms will thrive. For ordinary players like us, considering liquidity depth and capital allocation constraints, perhaps specializing in 1-3 mainstream platforms is a better choice.

Related Questions

QWhat was the total trading volume of the prediction market in 2025, and what percentage of this did the top two platforms (Kalshi and Polymarket) hold?

AThe total trading volume of the prediction market in 2025 was $50.25 billion. The top two platforms, Kalshi and Polymarket, held a combined market share of over 97.5%.

QWhat was Kalshi's year-over-year growth in nominal trading volume for 2025, and what was its total volume?

AKalshi's nominal trading volume for 2025 was $23.8 billion, representing a year-over-year growth of 1108% (approximately 11 times).

QAccording to the article, what were the top three event categories by betting activity on the Polymarket platform in 2025?

AThe top three event categories by betting activity on Polymarket in 2025 were Sports (39%), Politics (34%), and Cryptocurrency (18%).

QWhich month in 2025 set a new all-time high for monthly trading volume on Kalshi, and what was the volume?

ADecember 2025 set a new all-time high for monthly trading volume on Kalshi, with a volume of $6.38 billion.

QWhat is the estimated historical total trading volume for the Polymarket platform as mentioned in the article?

AThe estimated historical total trading volume for the Polymarket platform is approximately $23.2 billion.

Related Reads

Bank of America Quietly Positions: Could $6 Trillion in Bank Deposits Flow into Stablecoins?

Bank of America (BofA) is making strategic moves in digital assets, appointing senior leaders to advance a platform covering stablecoins, tokenized deposits, custody, and crypto settlement. This comes amid a broader discussion about the potential migration of trillions in bank deposits to stablecoins. A cited TBAC report estimated up to $6.6 trillion in transactional deposits could be at risk of moving to stablecoins long-term, a point BofA's CEO previously conditioned on stablecoins being allowed to pay interest. The regulatory landscape is evolving, with the GENIUS Act setting a final implementation deadline for January 2027. Major banks, however, are not waiting; JPMorgan, Citi, BofA, and others are already developing tokenized deposit networks and services. Industry observers note that while retail crypto trading is sluggish, institutional adoption of stablecoins for real-world use cases is driving growth. Despite the activity, some analysts remain cautious, noting banks have a long history of blockchain announcements and that true structural change is slow. The stablecoin market itself has seen a recent dip from its peak. Optimistic projections, however, foresee significant growth, with stablecoin settlement volume already reaching $33 trillion in 2025. The race is on for the post-January 2027 landscape, where regulatory clarity is expected to accelerate the fusion of traditional finance and crypto.

marsbit3m ago

Bank of America Quietly Positions: Could $6 Trillion in Bank Deposits Flow into Stablecoins?

marsbit3m ago

STAR 50 Soars 10.73%, Why Did A-Shares Stage a "V-Shaped Reversal"?

After a prolonged decline, the Chinese A-share market staged a strong rally on July 21. The STAR 50 index surged 10.73%, its largest single-day gain in nearly a year, leading a broad-based "V-shaped" reversal. The Shanghai Composite Index rose 1.79%, the Shenzhen Component Index gained 4.81%, and the ChiNext Index jumped 7.05%. Total market turnover reached 2.97 trillion yuan, an increase of 256.1 billion yuan from the previous session, with over 3,100 stocks advancing. The semiconductor sector spearheaded the rebound, with related ETFs posting significant gains. Analysts attribute the surge to three converging factors. First, coordinated capital inflows from "national team" institutions, insurance funds, listed company buybacks, and fund house self-purchases have bolstered market liquidity and confidence. Second, supportive policy signals, including commitments from regulators to ensure stable market operations, provided a favorable backdrop. Third, a stabilization and recovery in overseas markets, notably South Korea, created a positive external environment. Institutions suggest the most severe panic selling phase for the tech sector has likely passed, following a significant digestion of crowded positions and leveraged funds. While short-term volatility may persist, the medium to long-term outlook remains underpinned by enduring trends like AI computing demand expansion and semiconductor localization. The market's focus now shifts to the sustainability of supportive fund flows, earnings reports, and upcoming catalysts from the global AI industry chain.

marsbit41m ago

STAR 50 Soars 10.73%, Why Did A-Shares Stage a "V-Shaped Reversal"?

marsbit41m ago

U.S. Tech Momentum Stocks Post Largest Single-Day Gain Ever, But Is the Plunge Over?

US tech momentum stocks staged a sharp rebound on Tuesday (July 21st). Morgan Stanley's TMT Momentum Factor surged over 12%, marking its largest single-day gain on record, exceeding even peaks from the 2000 dot-com bubble. Key momentum indices from Goldman Sachs also posted their strongest daily performances in years. The rally was led by semiconductors, with the Philadelphia Semiconductor Index jumping 4.6%. This rebound followed three consecutive down days and a cumulative 33% plunge in momentum stocks, one of the steepest drawdowns since the dot-com era. Analysts attribute the surge largely to a short squeeze. Heavy selling had pushed high-beta momentum stocks into deeply oversold territory, forcing many short sellers, particularly in Asia, to cover their positions, creating a self-reinforcing buying spiral. However, the rebound's internals appear weak. Trading volume was notably low, and advancing stocks still lagged decliners on the S&P 500, indicating a narrow, concentrated rally rather than broad market participation. Diverging views emerge on the outlook. BTIG warns the bounce has hit key resistance and recommends selling into strength, citing extreme volatility and historical parallels to past market tops. Conversely, Goldman Sachs and UBS believe the momentum unwind is nearing its end, suggesting it may be time to gradually add exposure, as positioning has been significantly reduced. They caution, however, that high volatility warrants a measured approach, potentially using defined-risk strategies. The upcoming earnings season, particularly reports from major tech firms like Alphabet, is seen as a critical test for the rally's sustainability. Simultaneously, bond markets flashed a warning, with yields rising partly due to spiking oil prices. Analysts note that if long-term Treasury yields break decisively higher, it could pose a significant headwind for equities, especially growth stocks.

marsbit48m ago

U.S. Tech Momentum Stocks Post Largest Single-Day Gain Ever, But Is the Plunge Over?

marsbit48m ago

U.S. Tech Momentum Stocks Record Largest Single-Day Gain Ever, but Has the Rout Ended?

U.S. tech momentum stocks staged a dramatic rebound on Tuesday, July 21st. Key momentum indices like the Morgan Stanley TMT Momentum Factor and Goldman Sachs' High Beta Momentum Long Index posted historic or near-historic single-day gains, fueled largely by semiconductor stocks. This sharp rally followed a severe three-day sell-off that saw momentum stocks plunge 33%, marking one of the steepest pullbacks since the dot-com bubble. Analysts attribute the bounce primarily to a short squeeze, as forced covering from over-leveraged traders, particularly in Asia, created a buying spiral. However, the rally's health is questioned due to weak market breadth—overall trading volume was low, and decliners outnumbered advancers in the S&P 500 despite the index's gain—suggesting a narrow, concentrated surge rather than broad recovery. Opinions on the sustainability diverge. BTIG strategists warn the rebound has hit key resistance levels, citing extreme volatility and historic stock dispersion as signs of an ongoing broader correction, and recommend selling into strength. Conversely, Goldman Sachs and UBS view the aggressive momentum unwinding as nearing its end, noting reduced positioning and a lack of new fundamental catalysts. They suggest the sell-off presents a selective opportunity to add exposure, albeit cautiously and gradually using defined-risk strategies. The immediate trajectory hinges on the ongoing earnings season, with market focus on Alphabet's capital expenditure guidance for AI investment clarity. Meanwhile, bond markets present a risk, with rising Treasury yields—potentially heading toward 5.5%—and widening credit spreads for mega-cap tech companies posing a threat to equity valuations. The combination of technical factors, earnings results, and macro conditions leaves the durability of the rebound in doubt.

链捕手51m ago

U.S. Tech Momentum Stocks Record Largest Single-Day Gain Ever, but Has the Rout Ended?

链捕手51m ago

Trading

Spot
活动图片