Bitcoin Could See 10% Jump, As Volatility Drops To 18-Month Low

newsbtcPublished on 2022-05-05Last updated on 2022-05-05

Abstract

After its third-largest weekly fall in over a year, the Bitcoin (BTC) price has finally began to rise. BTC's price has effectively rebounded from the important support level of $37,500,...

After its third-largest weekly fall in over a year, the Bitcoin (BTC) price has finally began to rise. BTC’s price has effectively rebounded from the important support level of $37,500, despite an impending Federal Reserve rate hike.
Bitcoin Poised For 10% Jump
Various analysts, like The Wolf of All Streets, Michael van de Poppe, and PlanB, are bullish on the bullish trend, with the Bitcoin price currently holding above $39,000.
In a tweet on May 4, on-chain data provider Santiment published historical data showing a 20% rally as a result of BTC transactions is negative at the same levels between February 16 and 22. The week’s Bitcoin Ratio of On-Chain Transactions Volume in Profit/Loss statistic is the third largest capitulation in a year.
As technicals improve, several analysts and traders forecast a price increase in the following days.
Michaal van de Poppe predicts that the price of Bitcoin (BTC) will rise from current levels. He stated,
“Bitcoin starts to look way better at this stage. Odds that the event tonight is a ‘Sell the rumour, Buy the News’ event are increasing.”
A prominent crypto trader, The Wolf Of All Streets, predicted a rebound in Bitcoin price as it breaks above the trend line. A big rise could be anticipated if the BTC price stabilizes over $39,000.

Bitcoin On-Chain Transactions Volume. Source: Santiment
According to PlanB, the original $55K S2F model, which was released in March 2019, appears to be tracking the Bitcoin price trend. He also expects Bitcoin to rise in value.
The price of Bitcoin (BTC) has regained over 5% in the previous 24 hours, stabilising near $39,000. Whales continue to accumulate at dips, resulting in a huge increase in trading volume. Furthermore, the BTC has avoided a drop below the critical support level. It suggests that a rally could happen in the next several days.
BTC Trades Sideways
BTC has been trading sideways over the past few days, with the price dropping below $40,000 on April 26. Although, after reaching the swing highs near $48,000, the price has already begun to drop. BTC retreated and lost 45 percent of its value. BTC sellers, on the other hand, are weary as the price trades sideways in a narrow range since April 25.

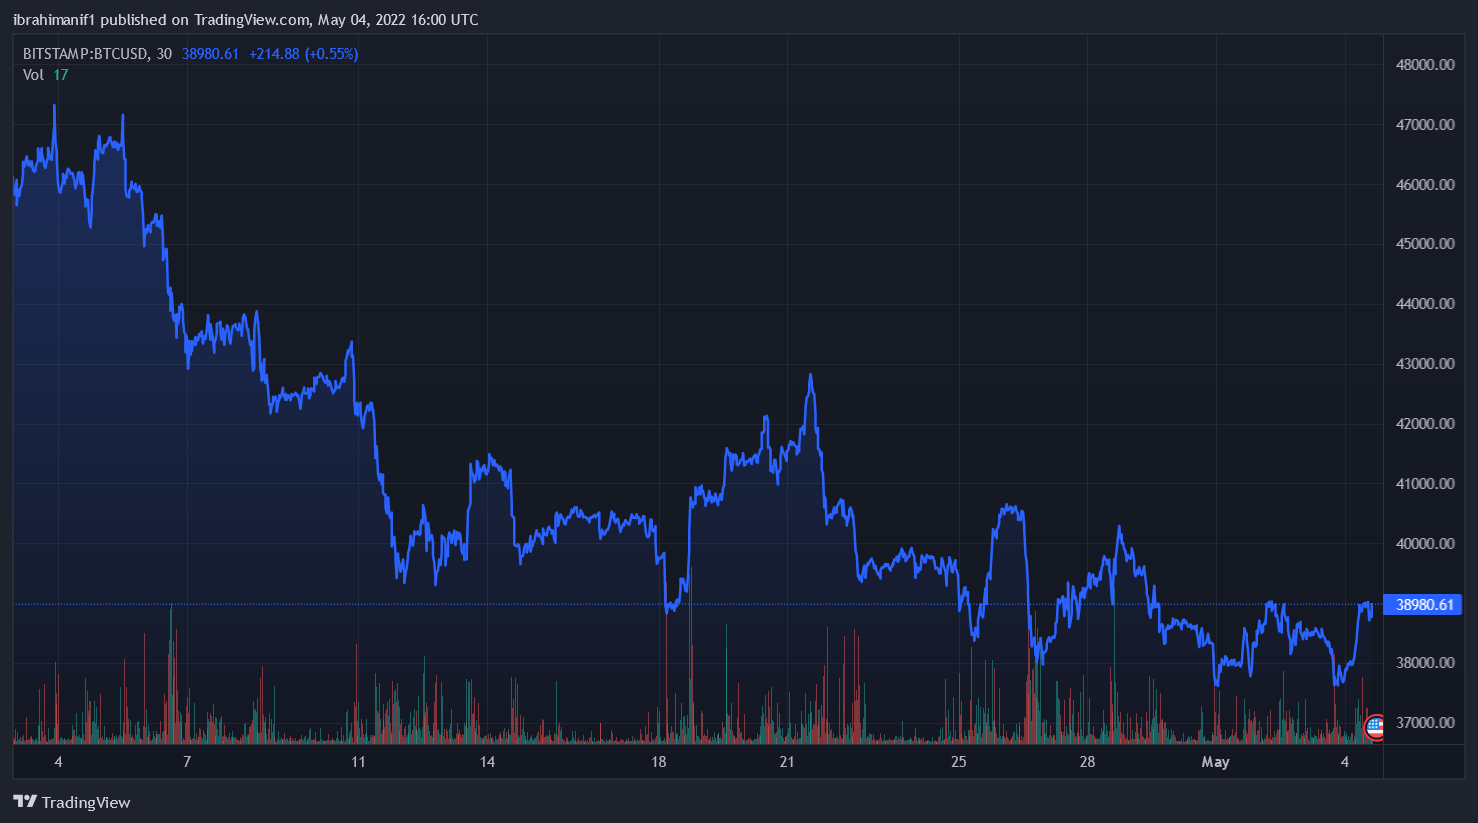
BTC/USD trades sideways. Source: TradingView
A daily close below the session’s low, on the other hand, would disprove the bullish price assumption. In that situation, $36,000 would be the lowest point on the downside.
BTC/USD is currently trading at $39,874, up 5.63 percent for the day as of publishing time. According to CoinMarketCap, the first cryptocurrency by market capitalization has a 24-hour trading volume of $35,528,442,016.
Suggested Reading | Will Bitcoin Shoot Over $40,000 — Or Drop To $35,000?
Volatility Drops
Bitcoin’s historical volatility is at 18-month lows, according to statistics released by the Buy Bitcoin Worldwide webpage. Its anticipated 60-day average value fell to 2.62%.
Bitcoin (BTC) volatility was last this low in November 2020, when the orange coin broke through $10,000 for the first time in this bullish cycle.

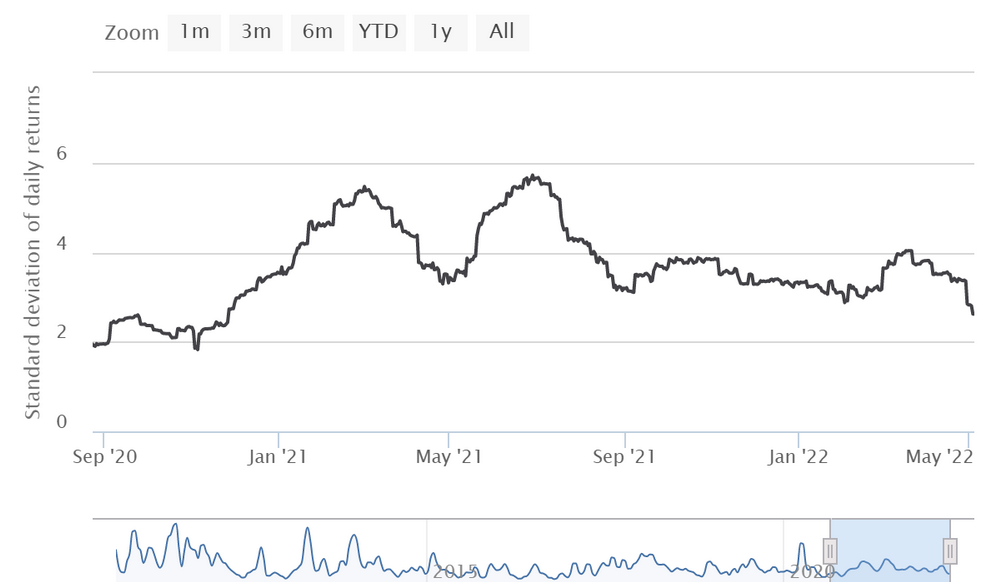
Image by Buy Bitcoin Worldwide
On April 27, 2022, thirty-day volatility reached a local low, but it is already showing signs of recovery.
The Bitcoin Volatility Index (BVOL), similar to the stock market’s VIX, shows how much Bitcoin’s price changes on a given day in relation to its previous price.
The most recent increase in Bitcoin (BTC) volatility occurred in July 2021, when the flagship cryptocurrency was twice as volatile over a 30-day period as it is now.

Related Reads

Why Is the World Nervous About Japan Raising Interest Rates?

In June 2026, the Bank of Japan raised its policy rate to 1%, marking its first hike to this level since 1995. While this rate remains low compared to global peers like the US and Europe, the move signals a profound shift for a nation that has been a global source of ultra-cheap funding for decades. Japan's long-standing near-zero or negative interest rates had facilitated massive "yen carry trades," where international investors borrowed low-cost yen to invest in higher-yielding assets worldwide, such as US tech stocks and emerging market bonds. This made Japan a critical, often overlooked, source of global liquidity. Japan's ultra-loose policy stemmed from structural challenges post-1990s asset bubble: aging demographics, chronic low inflation/deflation, and high public debt. Recent shifts, including sustained wage growth (exceeding 5% in recent years) and inflation consistently above the 2% target, have created a "wage-price spiral" possibility, prompting the policy normalization. The global market's concern lies not in the absolute rate but in the potential unwinding of the yen carry trade. As Japanese borrowing costs rise, the economics of these leveraged global investments change, potentially triggering deleveraging and capital outflows from risk assets. Market anxiety focuses on the end of a thirty-year consensus that Japan would perpetually provide cheap funding. Ultimately, the global impact will depend on the interplay with US monetary policy. While Japan is tightening, the significant interest rate differential with the US remains. The key future dynamic is whether simultaneous Japanese hikes and eventual US rate cuts will narrow this gap, forcing a major recalibration of global capital flows and asset pricing built on an era of abundant, cheap yen liquidity.

marsbit1h ago

Why Is the World Nervous About Japan Raising Interest Rates?

marsbit1h ago

Research Report Analysis: MRVL's Optical AI Booming, Why High Valuation Keeps Morgan Stanley's Star Analyst Sidelined?

Report Recap: MRVL Optical AI Boom - Why High Valuation Led Morgan Stanley's Star Analyst to Stay Neutral? Morgan Stanley analyst Joseph Moore maintained an "Equal-weight" (Neutral) rating on Marvell Technology (MRVL) on May 28, raising the price target from $172 to $195, below the trading price. This stance comes despite Marvell reporting a record quarter and significantly raising its full-year outlook (FY27 revenue ~$11.5B, up ~40%). Moore's neutral view is based on valuation. The $195 target implies ~40x CY2027 P/E. He contrasts MRVL with NVDA: both trade near ~$200, but Nvidia's forward EPS is more than double Marvell's. For MRVL's valuation to hold, it needs consistent earnings upgrades, proof of networking market share gains, or certainty on large-scale custom AI chip shipments—none of which are confirmed yet. Growth is driven by two pillars: **1) Optical Interconnect** (the faster runner): Moore raised FY27 growth expectations to >70%, with the optical module product line nearing a $1B annualized run rate. **2) Custom AI Chips** (the climber): Confidence in FY28 is growing, but a major new customer project only ramps in FY28, with no current revenue visibility. Key risks are the underperforming Storage, Enterprise, and legacy Networking segments. Moore acknowledges the real AI opportunity but believes the current price already reflects it. For the stock to work from here, investors need to see the optical business hit its targets, custom chips ramp as planned, and a recovery in the weaker business units.

marsbit2h ago

Research Report Analysis: MRVL's Optical AI Booming, Why High Valuation Keeps Morgan Stanley's Star Analyst Sidelined?

marsbit2h ago

qinbaFrank: Review and Outlook of the AI Computing Power Wave — From the Three Debates on NVIDIA to Optical Interconnect and SpaceX IPO, How is Capital Rotating?

**Summary: Retrospective and Outlook on the AI Computing Wave - A Framework for Capital Rotation** Based on a presentation by investor qinbaFrank, this analysis reviews the AI computing market trajectory since 2023 and outlines a forward-looking framework. **Key Phases and Market Debates:** The AI bull market progressed through three major debates: 1) The necessity of massive capital expenditure (late 2023). 2) The sustainability of tech giants' spending (early 2024-early 2025). 3) Potential overestimation of compute needs (early 2025). Consensus solidified in late 2025 as model capabilities and utility demonstrably improved. **Core Thesis: Penetration Rate Drives Commercialization.** Unlike the 2000 dot-com bubble, the current AI wave benefits from mature digital infrastructure, enabling faster adoption. The critical threshold is 10% penetration; surpassing it (with recent enterprise intent surveys showing ~18%) indicates entry into a rapid growth "golden period" where user scale and willingness to pay increase simultaneously. **AI vs. Internet: A Fundamental Difference.** While the internet enhanced connection efficiency, AI directly substitutes human cognition and labor. Once AI performance exceeds the "societal average" human level, its commercial value scales exponentially as payment shifts from human labor costs to AI service fees. **Investment Logic Evolution in the Compute Chain.** The focus has expanded from GPUs to a systemic re-rating of the entire hardware stack: storage/HBM, CPUs, interconnects, power, and advanced packaging. The framework is: **short-term "scarcity pricing," mid-term "upgrade pricing" (e.g., optical interconnects, power networks), and long-term "Physical AI" pricing** (edge computing, robotics). **Market Focus Shift and Adjustment Framework.** The market is transitioning from "hardware scarcity" to "commercialization validation." The ultimate anchor for the narrative is sustained high growth in model providers' Annual Recurring Revenue (ARR) and cloud business revenue, which justifies continued capital expenditure. Adjustments are categorized into three levels: * **L1 (Minor):** Driven by valuation compression or macro noise (e.g., single CPI print). Fundamentals intact. * **L2 (Moderate):** Triggered by significant macro events requiring risk repricing. Requires new data for confidence restoration. * **L3 (Major):** Involves a reset of the core industrial narrative or macro regime (e.g., AI commercialization growth stalling). The **crucial dividing line** is whether AI commercialization growth slows. Without a slowdown, pullbacks are likely L1/L2 "repricing" events. A genuine growth deceleration would signal an L2/L3 narrative reset. **Conclusion: A Foundational Civilizational Leap.** AI represents a foundational upgrade to "intelligence" itself—akin to humanity mastering fire—rather than a single-point industrial revolution. This底层能力跃迁 (underlying capability leap) will spawn successive waves of innovation (Agent, robotics, industry workflow重构). The journey will be波浪式的 (wavelike), driven by cycles of scarcity, technological upgrades, and远期兑现 (long-term realization).

marsbit2h ago

qinbaFrank: Review and Outlook of the AI Computing Power Wave — From the Three Debates on NVIDIA to Optical Interconnect and SpaceX IPO, How is Capital Rotating?

marsbit2h ago

Trading

Spot
Futures
活动图片