ETF关键节点将至,一窥交易数据背后的资金博弈信号

Odaily星球日报Published on 2024-01-02Last updated on 2024-01-02

Abstract

ETF 时间节点临近,链上及期货、期权等交易数据背后的动作与博弈,都极具指向意义。

原文作者:Frank,Foresight News

迈入 2024 年 1 月后,现货比特币 ETF 几乎成为短期内决定市场走向的主要叙事,在此背景之下,数据层面其实也成为了观察市场情绪与资金博弈的一个有效窗口。

本文旨在围绕期货和期权市场的未平仓合约规模、资金费率、行权日期与行权价分布、IV 等数据来一窥背后所透露出的资金博弈信号。

两个关键的时间节点

其中从消息层面看,主要时间节点有两个:

一方面,路透社上周末援引消息人士报道, 1 月 3 日 /4 日,美国证券交易委员会(SEC)可能提前批准一批现货 ETF 申请。

也即最快本周二 / 周三,美 SEC 可能就会官宣一些申请现货比特币 ETF 的发行人获准发行对应 ETF 股票。

ETF关键节点将至,一窥交易数据背后的资金博弈信号

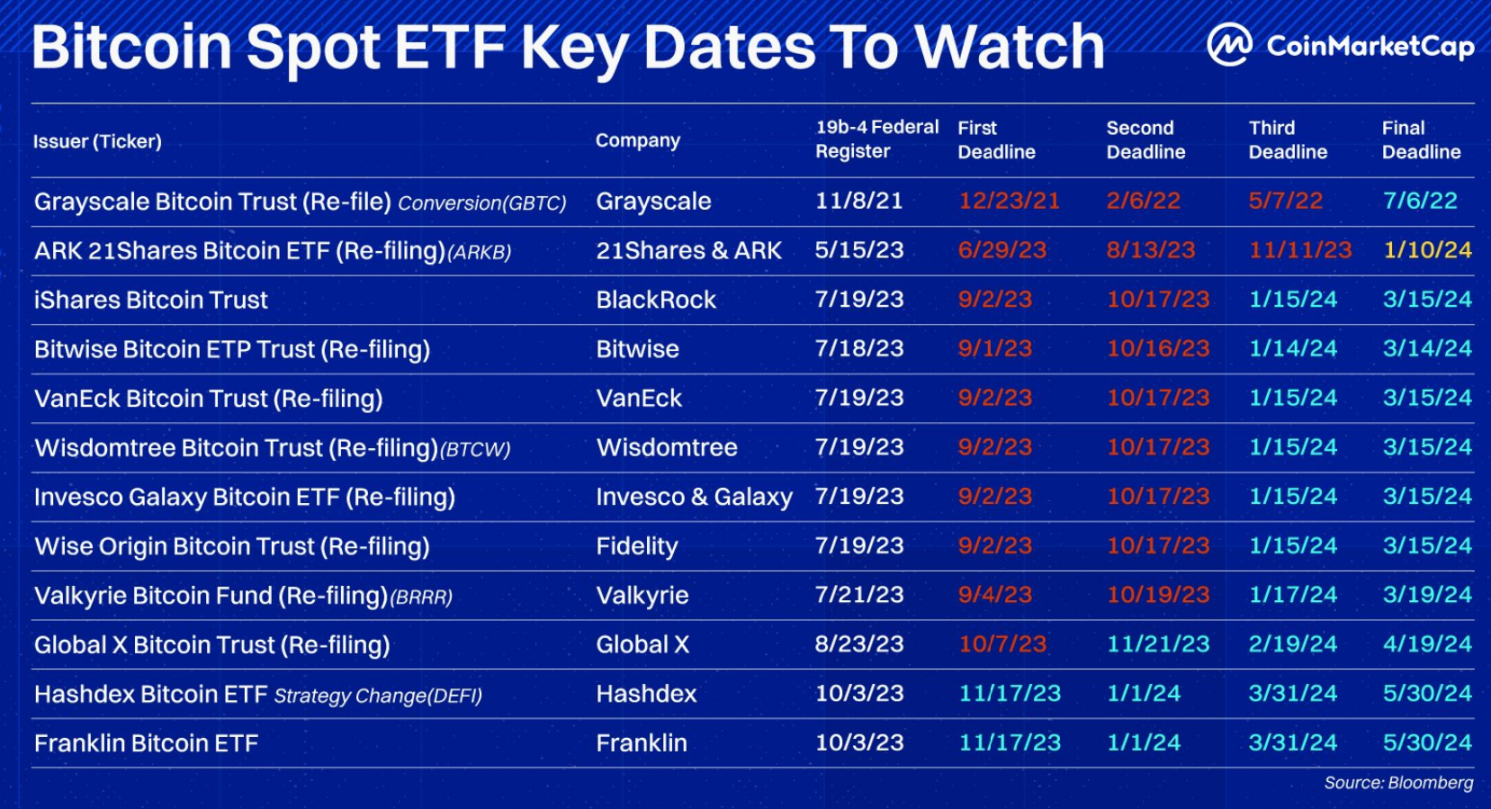
另一方面,按此前进度,最迟 1 月 10 日,美 SEC 就需要对 21 Shares/ARK 的现货比特币 ETF 申请作出决定,此后 1 月 14 日至 17 日也密集有 7 家迎来判决。

不过如果拖到 1 月 10 日当天,一般不排除美 SEC 再度推迟到 3 月中旬的最后时间窗口。

总的来看,1 月 3 日 /4 日, 1 月 10 日 -17 日,也是目前很多资金博弈的两个主要时间节点。

数据背后的资金博弈信号

比特币未平仓合约:无明显增长

Coinglass 数据显示,全网比特币期货合约未平仓头寸为 43.24 万枚 BTC(约合 196.88 亿美元)。

其中 CME 比特币合约未平仓头寸为 11.48 万枚 BTC(约合 52.15 亿美元),位列第一,币安比特币合约未平仓头寸为 10.32 万枚 BTC(约合 47 亿美元),位列第二。

ETF关键节点将至,一窥交易数据背后的资金博弈信号

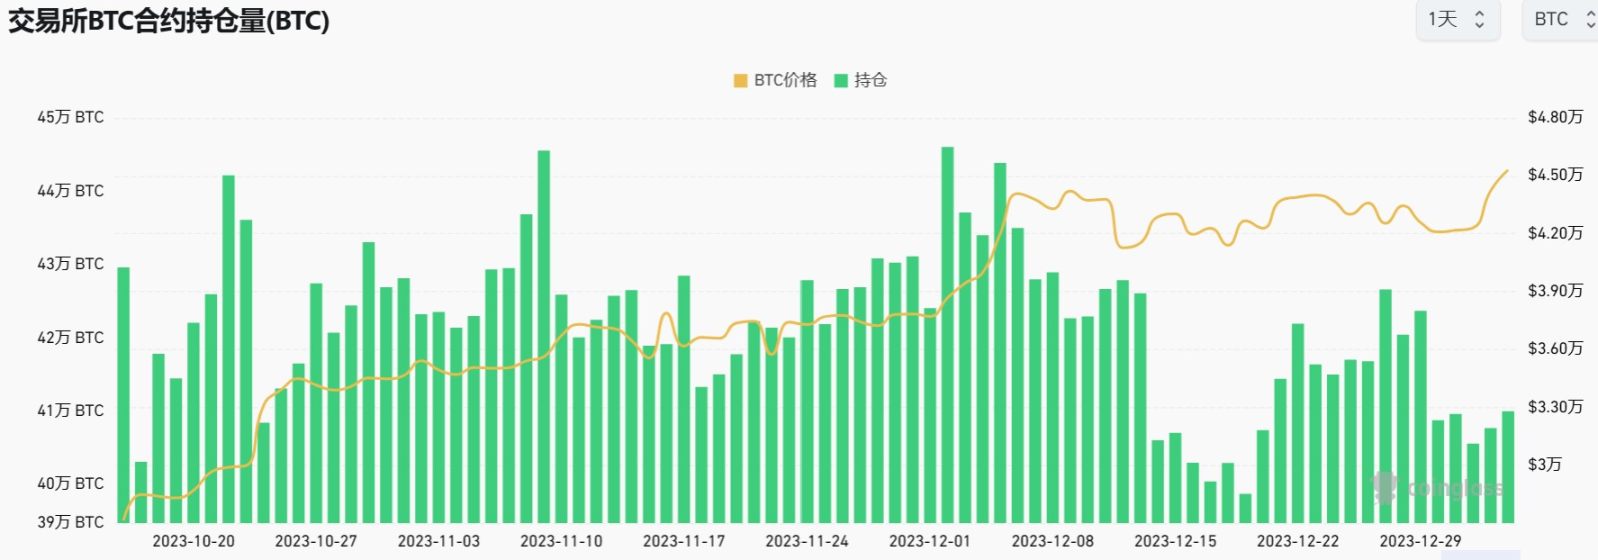
值得注意的是,从 12 月 30 日的年度交割日之后,近一周来比特币未平仓合约一直在 40.5 万枚至 41 万枚之间震荡,并无明显大额增长趋势 ,说明比特币期货市场对后市的博弈并不激烈。

永续合约资金费率:居高不下

与此同时,Coinglass 数据显示,BTC 和 ETH 的永续合约资金费率从 12 月 25 日开始,已连续一周处于年化 30% 以上水平——多头头寸持续支出相当于年化 30% 的巨额资金费,对行情突破上涨的未来预判较为坚定。

ETF关键节点将至,一窥交易数据背后的资金博弈信号

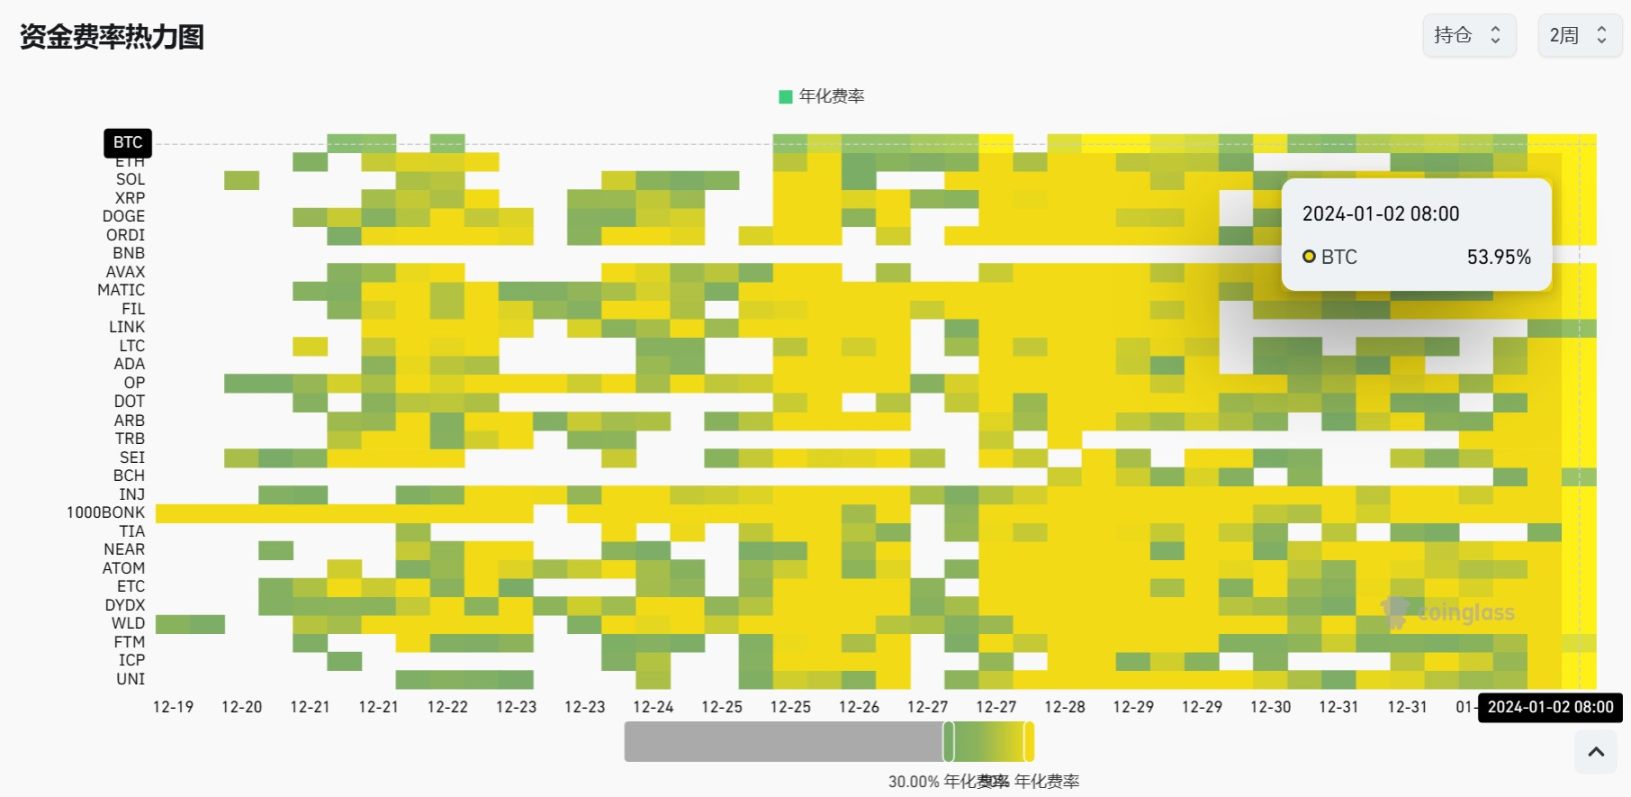
尤其是今天(1 月 2 日 00: 00)开始,资金费率更是双双站上年化 50% 以上,这意味着多头每天都在大量补贴空头,不断失血。

这也意味着后续 1 月 3 日 / 4 日、 1 月 10 日的关键节点上,一旦现货比特币 ETF 的消息不及预期,上涨势头无法突破,那多头就会失血过多,这部分不断支出大额资金费、坚定看涨的多头可能会迫于压力迅速平仓。

ETF关键节点将至,一窥交易数据背后的资金博弈信号

此前 12 月 9 日 - 10 日(周六、周日),就是如此——多头承受着 30% 以上的做多成本失血数天,且价格在周末两天迟迟未能突破,最终周一凌晨开启了三千刀级别的砸盘(推荐阅读《合约多头惨遭屠戮,「圣诞行情」何去何从?》)。

期权行权集中在对应时间点

Deribit 统计数据显示,按行权日期看,本月的比特币期权持仓集中在 1 月 5 日、 1 月 12 日、 1 月 26 日三天,且看涨期权(Call)均高于看跌期权(Put)。

其中 1 月 5 日、 1 月 12 日正好契合路透社传闻的 1 月 3 日 / 4 日出结果及 21 Shares/ARK 的结果出炉。

ETF关键节点将至,一窥交易数据背后的资金博弈信号

从行权价格上看,未平仓期权合约的行权价只要集中在 5 万美元,应当也是博弈现货比特币 ETF 一旦通过,至少能冲高至 5 万美元上方。

ETF关键节点将至,一窥交易数据背后的资金博弈信号

此外值得注意的是,Derbit 的 BTC 波动指数(DVOL)相比往年也逆势上涨,近 7 日来更是从 44% 左右上涨 50% ,达到 66% 附近——往年该时间段 DVOL 一直是稳步下降趋势,徘徊在 40% 区间。

ETF关键节点将至,一窥交易数据背后的资金博弈信号

小结

最近市面上在追踪一只 50 天买入近 18 亿美元加密资产的神秘巨鲸(参考阅读《50 天, 18 亿美元,本轮小牛行情的「发动机」浮出水面?》)—— 10 月 20 日至 12 月 9 日,该地址累计买入 17.6 亿美元加密资产,和市场上涨时间点完美契合。

值得注意的是, 12 月 28 日,该神秘地址在沉寂 20 天后再次出手,从 Tether 获取 5000 万 USDT,并转入 Kraken、Bitgo、Coinbase。无论该神秘地址背后究竟是谁, 18.1 亿美元的大手笔买入,本身就透露着重要的信号。

叠加现货比特币 ETF 的时间节点临近,这些链上及交易数据背后的动作与博弈,无疑都极具指向意义。 

Related Reads

Can You Make a Steady Profit by Blindly Following Polymarket's Pre-Game Win Probability to Bet on NBA Games?

**Can You Consistently Profit by Blindly Following Pre-Game Win Probabilities on Polymarket for NBA Games?** A backtest of the entire NBA 2025-26 regular season (1,096 games) was conducted to test the strategy of always betting $100 on the team with the higher pre-game win probability on Polymarket. The results show that this strategy is not profitable. The total amount wagered was $109,600, with a return of $107,545.20, resulting in a net loss of $2,054 and a Return on Investment (ROI) of -1.87%. This indicates that the market is highly efficient, and pre-game probabilities are accurately priced, leaving no simple arbitrage opportunity. In fact, blindly following the market would have been slightly less profitable than betting against it. However, a deeper analysis by team revealed significant differences. Certain teams consistently outperformed market expectations when they were favored to win: * Portland Trail Blazers (POR): 19% ROI * Philadelphia 76ers (PHI): 14% ROI * San Antonio Spurs (SAS): 12% ROI * Los Angeles Lakers (LAL): 11% ROI * Charlotte Hornets (CHA): 9% ROI In contrast, the market was highly efficient for the top-performing teams, offering minimal returns (e.g., Boston Celtics ROI: 4%, Denver Nuggets ROI: -5%). Results for the weakest teams were too inconsistent due to small sample sizes. The key finding is that team-specific factors, rather than the probability percentage itself, drive potential value, making a one-size-fits-all strategy ineffective.

Odaily星球日报14m ago

Can You Make a Steady Profit by Blindly Following Polymarket's Pre-Game Win Probability to Bet on NBA Games?

Odaily星球日报14m ago

Are Altcoins Soaring? Is the Bull Market Back?

Recent days have seen significant volatility in altcoins while Bitcoin remained relatively stable. Some low-market-cap tokens, with circulations under $20 million, surged by several hundred percent within days—without fundamental improvements, ecosystem breakthroughs, or new institutional inflows. This is not a true altseason. The Altseason Index stands at 34, and Bitcoin dominance is at 58.5%, indicating the market is still in a "Bitcoin season." The altcoin market cap has shrunk by ~40% since its peak in December 2024, falling to around $700 billion. This severe decline has made it cheaper for large holders to accumulate significant portions of circulating supply, enabling price manipulation. A case in point is SIREN, where a single entity allegedly controlled up to 88% of the circulating supply. Such concentration allows a small group to dictate price movements. Additionally, deeply negative funding rates (as low as -0.3% every 8 hours, annualized to -328%) force short sellers to pay high fees, accelerating liquidations and further fueling upward price spikes. On-chain activity, like a 97% weekly increase in BSC DEX volume, suggests excitement, but it is largely driven by existing capital, not new inflows. Institutional flows into altcoin ETFs (like those for Solana and XRP) have been weak or negative, indicating caution rather than rotation into altcoins. This rally is a signal of structural fragility, not broad bullish momentum. Until Bitcoin dominance falls significantly and new capital enters the altcoin space, these pumps are echoes of manipulation—not the return of a true bull market.

marsbit49m ago

Are Altcoins Soaring? Is the Bull Market Back?

marsbit49m ago

Trading

Spot
Futures
活动图片