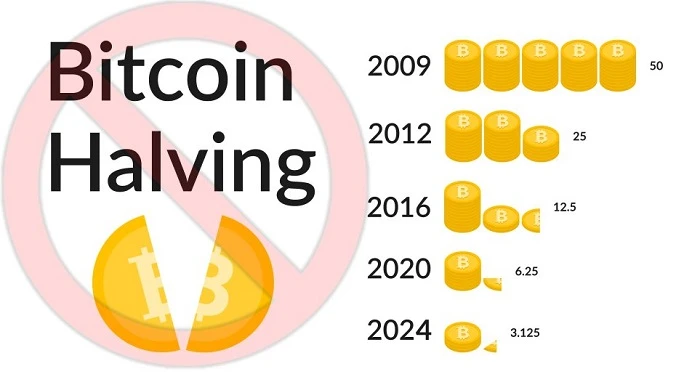
20张图,打破“比特币减半周期论”

Odaily星球日报Published on 2023-05-24Last updated on 2023-05-24

Abstract

随着比特币区块奖励接近其第四次减半,投资者正试图“抢滩”这个在历史上保持看涨的事件,不过比特币的价格涨幅是否真的与神奇的“ 4 年周期”相关呢?如果你真的相信这个所谓的循环周期,那么请做好这个概念将被颠覆的准备,因为这篇文章要证明比特币减半牛市周期其实只是“传说”。

随着比特币区块奖励接近其第四次减半,投资者正试图“抢滩”这个在历史上保持看涨的事件,不过比特币的价格涨幅是否真的与神奇的“ 4 年周期”相关呢?如果你真的相信这个所谓的循环周期,那么请做好这个概念将被颠覆的准备,因为这篇文章要证明比特币减半牛市周期其实只是“传说”。

认为“比特币每隔 4 年区块奖励减半是牛市主因”的人,可能是考虑到比特币价格逐渐减少的通胀压力——从概念上来说,这是有道理的,因为给矿工提供的比特币奖励越少,他们的抛售压力就越小。但是,倘若通过图表分析,或许会发现一丝“不一样”的端倪。

最近的比特币区块奖励减半发生在:

2020 年 5 月 11 日

2016 年 7 月 9 日

2012 年 11 月 12 日

而以下是比特币“触及”减半后历史最高点所需的天数:

2012 : 92 天

2016 年: 180 天

2020 年: 204 天
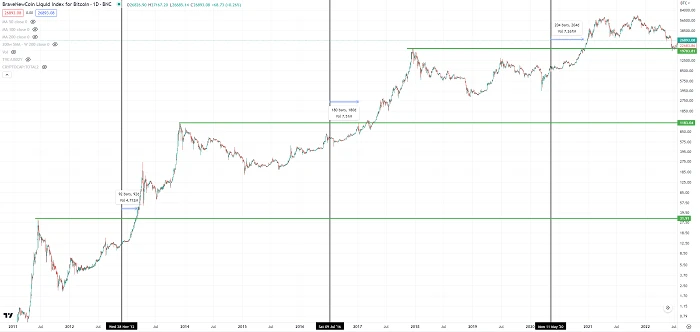
从上述数据集合中可以得出的第一个观察结果是:比特币区块减半后的价格升至新高的天数正在增加,分别是 92 天、 180 天,然后是 204 天。 但实际上,根据多年来的数据分析,比特币的价格周期时机并不能让人信服,反而其价格走势与道琼斯指数 (DJI)吻合度相对较高。
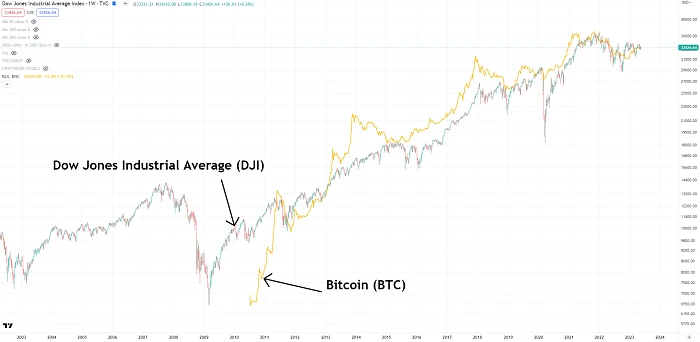
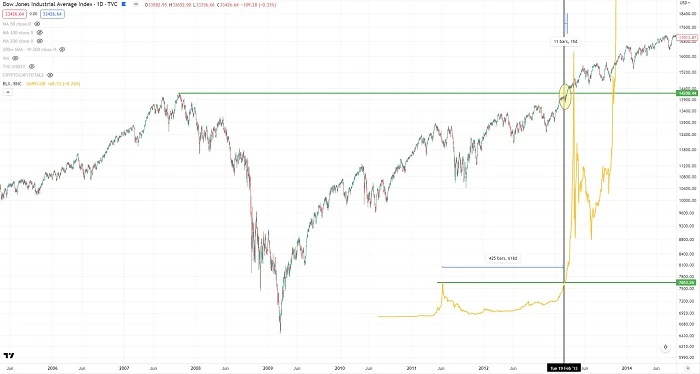
让我们从 2012 年开始,比特币区块奖励减半之后,过了 92 天价格创下了当时的历史新高,本次价格走高是在美国次贷金融危机后发送的,就在当时比特币价格创下新高之后的 15 天,道琼斯指数也创下历史新高。当时的熊市时间长达 618 天熊市,而比特币价格创下历史新高恰逢道琼斯指数突破金融危机峰值的时期。
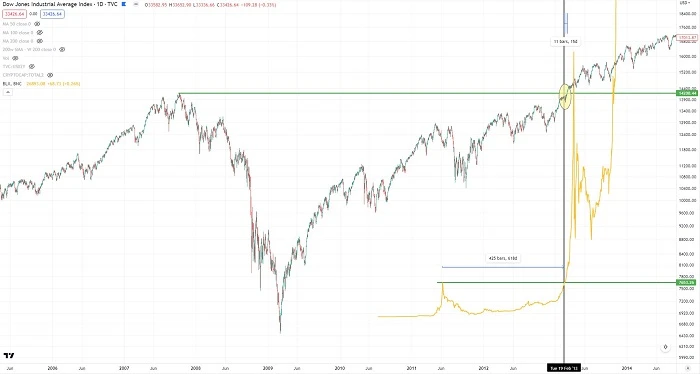
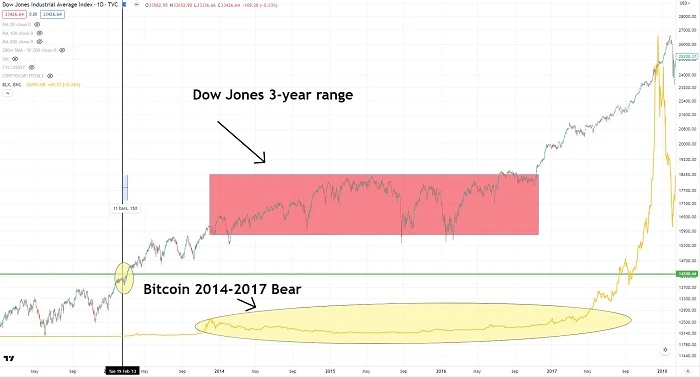
2013 的牛市许多人还记忆犹新,但随后比特币便进入了 2014-2016 年的漫长熊市。在此期间,道琼斯指数也在 15, 400 和 18, 300 之间的范围内徘徊震荡,而且出现了三次较大幅度的下跌(参见下图红框范围)。
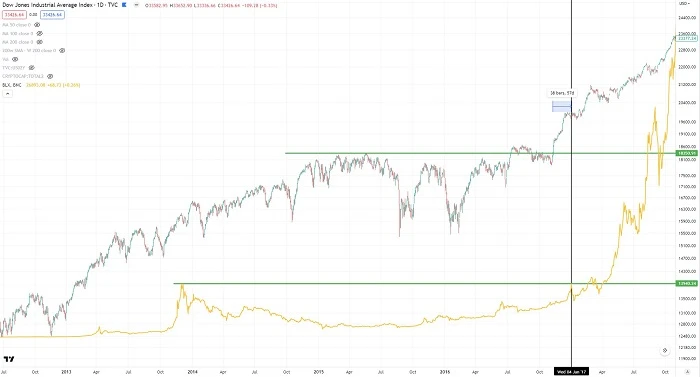
接下来让我们再看看 2016 年的情况,当时比特币区块奖励减半之后,过了 180 天其价格才创下当时的新高。值得一提的是,当时道琼斯指数也摆脱了低迷,而且同样创下历史新高,比特币这次突破历史高点的时间实在道琼斯指数离开 3 年熊市区间后的 57 天内创下的。
当时间来到一年之后的 2017 年,比特币价格和道琼斯工业平均指数的抛物线走势愈发相似,尽管这种同步趋势当时只维持了大约 42 天。
2017 年牛市之后出现了一个更复杂的模式,许多人将其视为是一个调整“区间(range)”或市场修正,并且形成了一个加宽的楔形形态(注:楔形形态是一种常见的价格修正结构,上升楔形是指价格经过一次大幅度下跌后产生的强烈技术性反弹,价格升至一定水平后又掉头下落,但回落点比前次高;下降楔形则正好相反,价格高点和低点形成一浪低于一浪之势,反弹高点逐渐下移。) 有趣的是,当时这种市场情况似乎更像是一种 “双击牛市旗形突破空头挤压回测 V 形底部”。
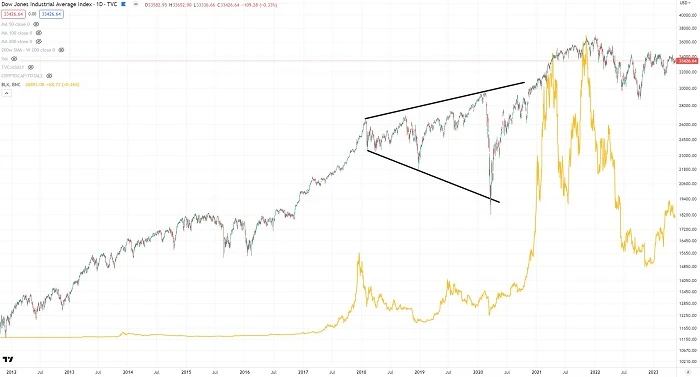
大多数相信比特币 4 年周期的人可能会辩解这是价格行为造成的,“如果没有 Covid, 2020 年 3 月的事情就永远不会发生。”

但问题是, 2020 年 3 月的加密市场暴跌是一个既定事实,尤其是当我们把 2013 年、以及 2017-2021 年数据拿出来对比(如下图所示)之后,即便是那些相信比特币区块奖励激发 4 年牛市周期的人也会承认这一点。
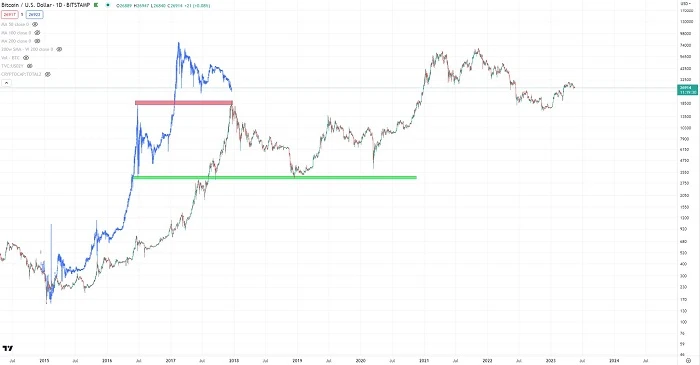
下面这张图,反映了比特币价格在 2017-2020 年的走势情况,后面将拆开分析。
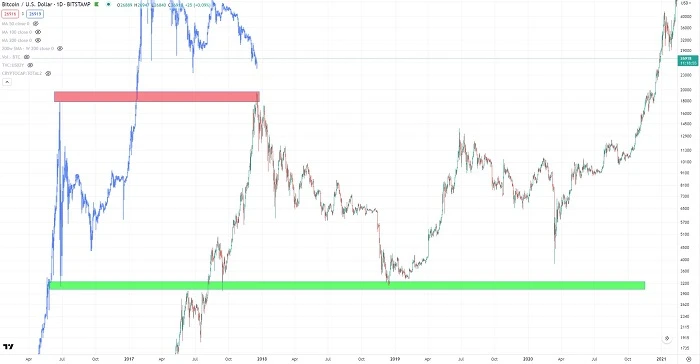
下图是 2013 年的比特币走势情况,可以看出当时比特币价格经历了暴跌、小幅反弹、重新累积、价格上涨这四个阶段。
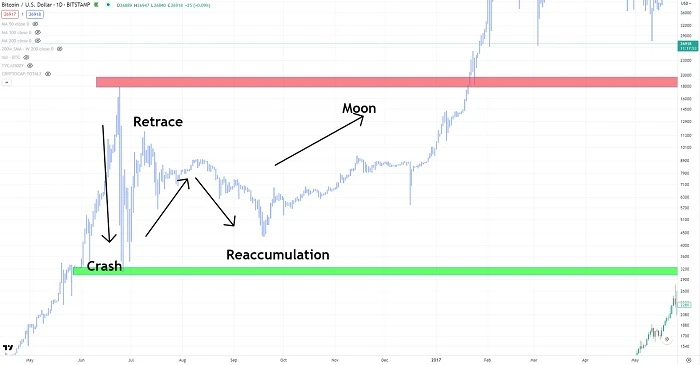
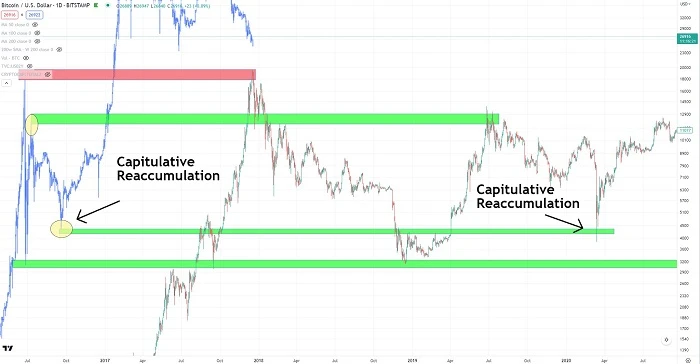
2017-2020 年期间,因为 Covid 引发的市场抛售开始出现,当时市场上也有一些投资者开始“捕获性重新积累(Capitulative Reaccumulation)”(注:捕获性重新累积是作者自创的一个词,可以看做是一种市场投降的情况。)
接下来让我们简短地回顾一下 Covid 期间道琼斯指数发生了哪些变化,实际上,有些变化是泡沫中的普遍现象,换句话说, 2020 年 3 月 Covid 引发的市场抛售震荡其实是正常的。
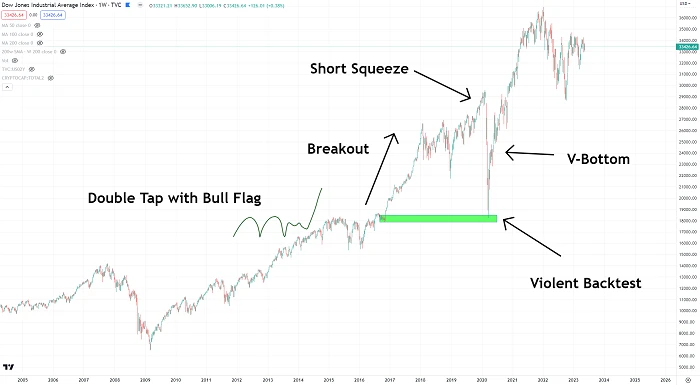
举个例子,如果我们回顾一下 2017 年以太坊的价格走势,可以看到类似的抛物线走势情况和 Covid 期间的加密市场也十分相似。
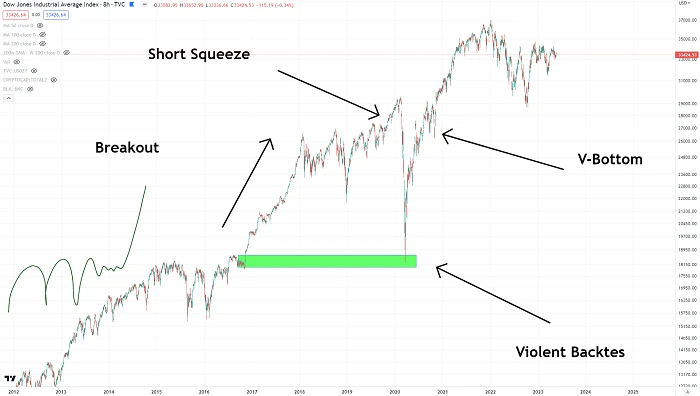
另一方面,同一时期内的道琼斯指数也在进行正常修正结构,对于一些不清楚经济概念的“小白”来说,他们可能会觉得是 Covid 造成的市场震荡,但如果回顾一下过去的历史走势就不难看出,情况并非如此。而这,也就是为什么有些人在 2020 年 3 月至 10 月期间恐慌抛售,而有些人则“抄底入场”赚的盆满钵满。
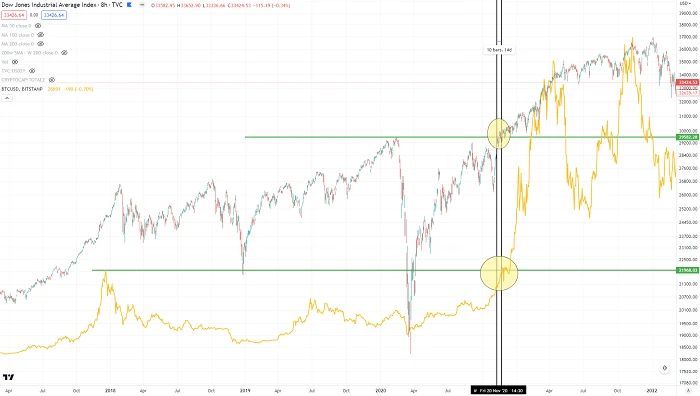
这里的一个关键点是 2018-2020 年期间的市场修正,当时比特币和道琼斯指数都没有做好“反弹”的准备。但是当道琼斯指数成功走出低迷,比特币在 14 天后也紧随其后——此时,发生在比特币区块奖励减半的 204 天后。

让我们再次回顾一下比特币价格触及历史新高的几个关键时间点:

2012 年:

- 比特币区块奖励减半后的第 92 天

- 距离道琼斯指数突破高点的 15 天后

2016 年:

- 比特币区块区块奖励减半后的第 180 天

- 距离道琼斯指数突破高点的 57 天后

2020 年:

- 比特币区块奖励减半后的第 204 天

- 距离道琼斯指数突破高点的 14 天后

随着比特币区块奖励减半,我们看到比特币价格走到高点的时间跨度分别是:+ 92 天、+ 180 天、然后是 + 204 天。而对于多年修正/合并后的道琼斯指数,我们看到比特币价格走到高点的时间跨度分别是:-15 天、+ 57 天,然后是 + 14 天。所以,哪一个看起来更相关?

加密市场里有一种观点并不受欢迎,那就是:比特币价格创新历史高点并不是因为区块奖励减半,而是依赖于股市创下的历史高点。

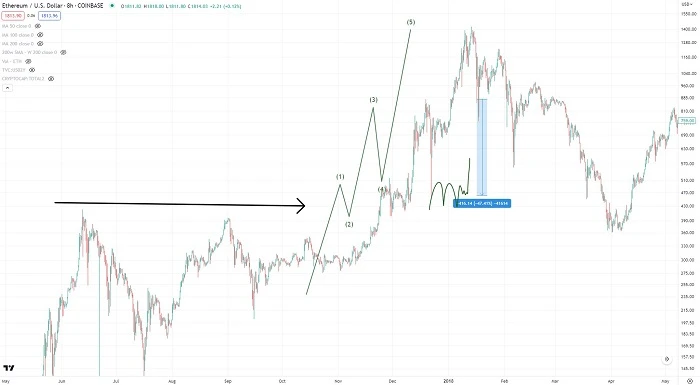
还记得上面提及的这张图表吗?道琼斯工业平均指数的走势,是不是和以太坊上的“双击突破空头挤压牛市旗背测试 V 底”有些相似呢?
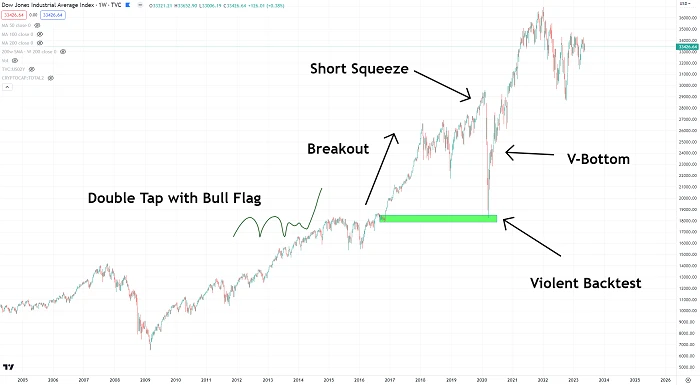
从技术上讲,剧烈的回测阶段其实就是艾略特波浪理论中的 Wave-4 。
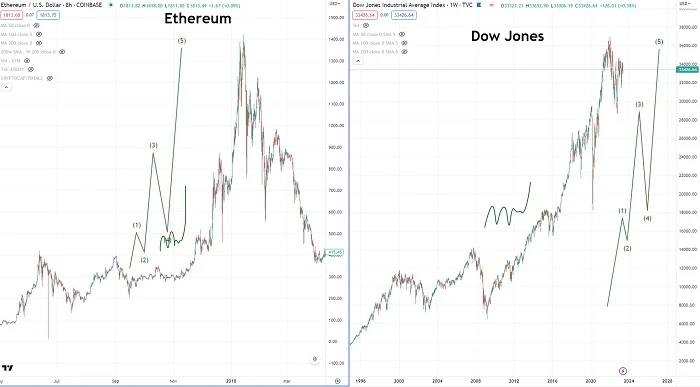
当我们看看以太坊旁边的道琼斯工业平均指数时……天啊……走势也太相似了吧。
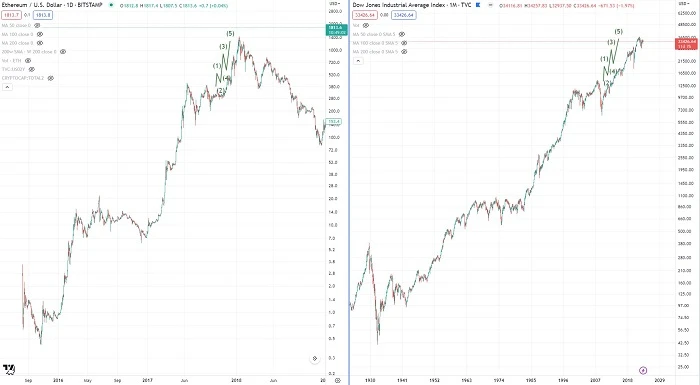
然后,当我们进一步缩小道琼斯指数,进一步缩小以太坊时……天啊……再次出现了相似的趋势。
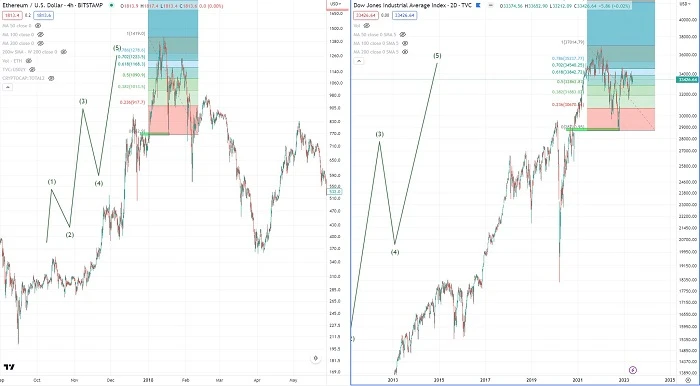
那么,现在道琼斯指数处于什么阶段呢?请参见下图。
总结

本文的重点是,比特币区块奖励从减半后到触及新的历史价格高点的时间跨度越来越大,相比之下,比特币的价格高点和道琼斯指数高点之间的时间快点则越来越小。之所以不相信比特币减半的 4 年牛市周期,是因为价格趋势其实和道琼斯指数结合的更加紧密,而比特币区块奖励减半也许只是“幸运时机”而已。

不仅如此,加密社区里之所以会出现“比特币也许不会再创历史新高”的想法,是因为 2013 年、 2017 年和 2021 年的牛市都发生在道琼斯指数爆发之后。所以现在的问题在于,道琼斯指数是否会再次爆发并触及新的历史高点——如果不会,好吧,正如我们从过去的市场周期中所看到的那样,比特币也许不会开始牛市。

Related Reads

Analyzing the Impact of AI on Economic Growth and Productivity

**Title: Analyzing AI's Impact on Economic Growth and Productivity** This article examines three contrasting views on AI's influence on economic growth and productivity. **The Optimistic View** posits that AI, especially through automating R&D ("recursive self-improvement"), could dramatically accelerate growth, even triggering a technological "singularity" with explosive, potentially infinite, economic expansion. **The Moderate/Mainstream View** acknowledges AI's productivity benefits but emphasizes significant real-world constraints that could limit its impact. These include: limited cost savings per task, structural ceilings on which jobs and industries are "exposed" to AI, adoption bottlenecks (e.g., compute, energy, regulatory hurdles), and the "weak link" effect where non-automatable tasks cap overall gains. Consequently, the realized AI dividend may be far lower than optimistic projections, with estimates typically ranging from 0.1% to 1.3% annual productivity growth. **The Pessimistic View** stems from two strands. The first aligns with the moderate view but applies extremely conservative assumptions about task exposure and efficiency gains, yielding minimal projected impact. The second introduces a demand-side critique: if AI primarily replaces rather than augments labor, it could depress labor's share of income, weaken consumer demand, and create a "demand trap" that ultimately stifles growth, unless offset by redistribution policies. **The authors' assessment** is nuanced: * **Short-term (1-2 years):** AI will support growth primarily through investment spending, not significant productivity gains. * **Medium-term (3-5 years):** Three potential paths emerge based on AI demand and bottleneck severity: 1. **"Optimistic Path":** High demand, few bottlenecks. Rapid productivity gains but risk of major job displacement and social conflict without redistribution. 2. **"Moderate Path" (most likely):** High demand but significant, surmountable bottlenecks. Leads to moderate productivity gains, financial market volatility (K-shaped returns), and sectoral job losses. 3. **"Pessimistic Path":** Low demand or severe bottlenecks. Minimal productivity and growth impact, triggering financial market corrections but allowing a smoother societal transition with less labor disruption. * **Long-term:** AI holds potential for a major productivity revolution and prosperity. The conclusion stresses that no path is smooth. Technologically "optimistic" outcomes could be socially detrimental, while "pessimistic" technological diffusion might be more socially stable. Policymakers must monitor developments and prepare balanced responses to manage economic, financial, and social sustainability.

marsbit17m ago

Analyzing the Impact of AI on Economic Growth and Productivity

marsbit17m ago

The New Cold War is a Tech Stock War

The New Cold War is a Tech Stock War The article argues that the contemporary geopolitical and economic rivalry between the US and China represents a "New Cold War," but one fundamentally fought through technology and financial markets, not physical barriers or conventional trade. Historically, US dominance was secured through financial systems. The Soviet Union, reliant on the rigid "Transferable Ruble," was ultimately undermined by its dependency on the US dollar for oil trade. Later, Japan's semiconductor challenge was countered not just by tariffs (e.g., Plaza Accord, 301 investigations) but by binding it to US Treasury bonds. China presents a more complex, "embedded" challenger. While it holds vast dollar reserves and US debt like Japan, its industrial base is stronger and more diversified than the Soviet Union's. Surviving the initial 2018 trade war phase, the conflict has evolved into a "tech-financial war." The core battlefield is now the stock market. US tech stocks (AI, semiconductors) are treated as sovereign assets, buoyed by bipartisan national will. China is pushing to strengthen its own financial markets to convert industrial strength into financial power and fund its tech ambitions. Companies like ChangXin (semiconductors), Moonshot AI, and DJI compete not just for market share but as financial proxies for their respective systems. The new paradigm is moving from globally efficient monopolies (Apple, Google) towards companies that achieve monopolistic profits within their respective geopolitical spheres. This competition over "pricing power" and financial valuation in segmented markets defines the current era, making the stock market the primary arena for this tech-centric struggle.

marsbit27m ago

The New Cold War is a Tech Stock War

marsbit27m ago

RWA Weekly: Ten European Financial Institutions Establish Tokenized Asset Cooperative; Ondo Launches New Execution Network Ondo Network

RWA Weekly: European Banks Form Tokenized Asset Cooperative; Ondo Launches New Execution Network Ondo Network Covering July 24-31, 2026, the RWA sector saw a steady on-chain total value locked (TVL) of $36.8 billion, with holder count hitting a record high. However, stablecoin transfer volumes fell sharply (~30%), indicating low on-chain settlement demand. Key regulatory moves include South Korea advancing stablecoin legislation and a push to scrap crypto taxes, Kenya lowering capital requirements for stablecoin issuers, and Zimbabwe approving seven projects for its crypto sandbox. In project developments, BIS-led Project Agorá successfully tested cross-border payments with tokenized funds across six currencies. Ten major European financial institutions formed the RL1 blockchain cooperative to build tokenized asset infrastructure. Other notable updates: Aviva launched a tokenized dollar liquidity fund on XRPL, POSCO International tokenized commercial invoices on Injective, and a Brazilian farmer used tokenized cattle as collateral for a loan. Additional progress includes BNY Mellon migrating its core transfer agent operations to blockchain, Securitize gaining SEC investment advisor registration, and Tether’s compliant stablecoin USA₮ launching on Celo. Ondo Finance introduced Ondo Network, a new execution layer focused on speed and privacy, moving away from its initial chain plans. An analysis highlights that despite the growing scale of on-chain RWAs (~$32B), approximately 90% remain underutilized in DeFi, pointing to a critical challenge in unlocking liquidity and fostering real-world application beyond mere issuance.

marsbit27m ago

RWA Weekly: Ten European Financial Institutions Establish Tokenized Asset Cooperative; Ondo Launches New Execution Network Ondo Network

marsbit27m ago

Trading

Spot
活动图片