How Does Current Bitcoin Rally Compare With Historical Ones?

newsbtcPublished on 2023-05-23Last updated on 2023-05-23

Abstract

Here's how the current Bitcoin rally stacks up against the previous ones in terms of the drawdowns it has experienced so far. The Current Bitcoin Rally Has Seen A Peak...

Here’s how the current Bitcoin rally stacks up against the previous ones in terms of the drawdowns it has experienced so far.
The Current Bitcoin Rally Has Seen A Peak Drawdown Of -18.6% So Far
In a recent tweet, the on-chain analytics firm Glassnode compared the latest Bitcoin rally with the ones seen throughout the entire history of the cryptocurrency.
Generally, rallies are compared using metrics like the percentage price uplifts recorded during them or the amount of time that they lasted (which may be measured in terms of the blocks produced, as is done when looking at cycles in terms of halvingsere, however, Glassnode has taken a different approach that provides a new perspective on these rallies.

The comparison basis between the price surges here is the drawdowns that each of them experienced across their spans. Note that these drawdowns aren’t to be confused with the cyclical drawdowns that are used to measure how the price has declined since the bull run top.
The drawdowns in question are the obstacles that the cryptocurrency encountered while the rallies were still ongoing, and are hence, those that the coin eventually managed to overcome.
Here is a chart that shows the degree of drawdowns that each of the historical bull markets experienced, and also where the current rally stands in comparison to them:

Bitcoin Bull Market Drawdowns


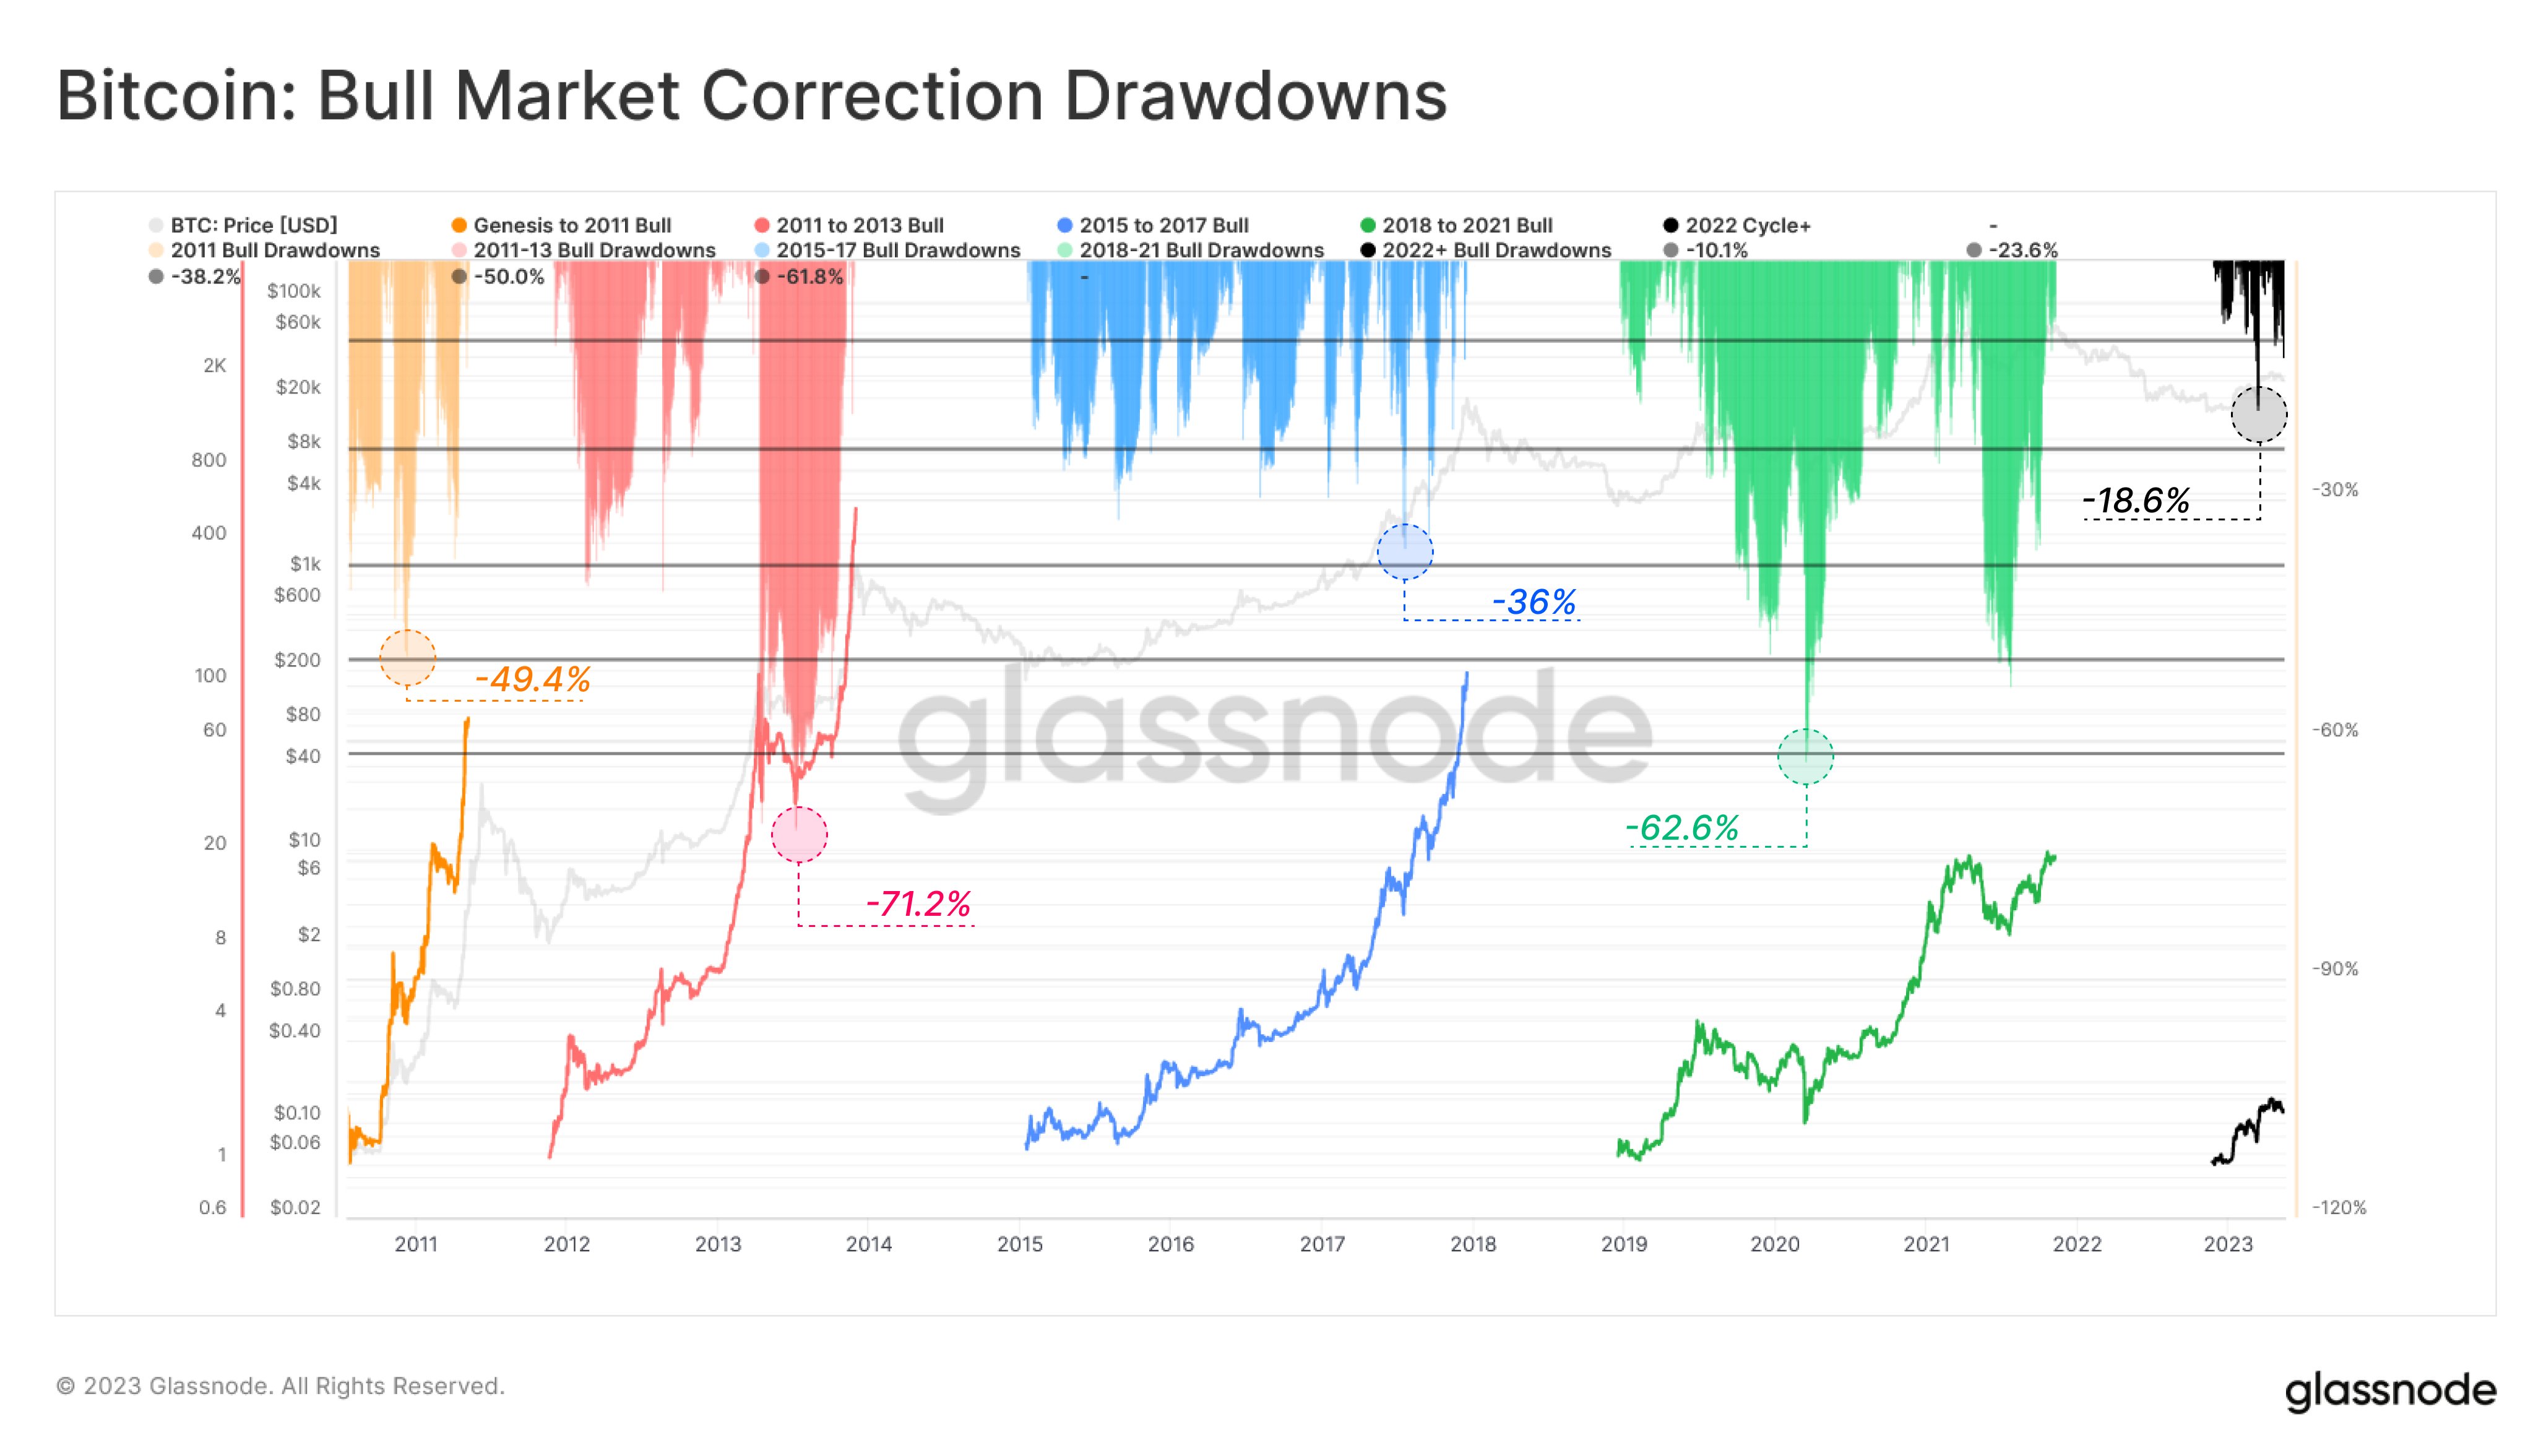
Looks like the value of the metric hasn't been too high for the latest rally so far | Source: Glassnode on Twitter
The five bull rallies here are as follows: genesis to 2011 (the very first rally), 2011-2013, 2015-2017, 2018-2021 (the last rally), and 2022 cycle+ (the ongoing one).
The analytics firm here has taken the bottom of each of the bear markets as the start of the next bull rallies. This means that parts of the cycle that some may not consider as part of the proper bull run are also included.
The main example of this would be the April 2019 rally, which is often considered its own thing but is clubbed with the last Bitcoin bull market in the above chart.
From the graph, it’s visible that the deepest drawdown that occurred during the first bull market measured around -49.4%. The next run, the 2011 to 2013 bull, experienced an even larger obstacle of a -71.2% plunge midway through it.
The next one (2015-2017) then only saw a drawdown of -36%, but the drawdown was again up at -62.6% for the run that followed it (that is, the latest bull market).
So far in the 2022+ Bitcoin bull market (which would only be considered a bull market at all if the November 2022 low was truly the cyclical bottom), the deepest drawdown observed so far is the March 2023 plunge of -18.6%.
Clearly, the drawdown seen in the current rally so far is significantly lesser than what the historical bull markets face. If the pattern of the past runs holds any weight at all, then this would mean that the current bull market should still have more potential to grow.
At the time of writing, Bitcoin is trading around $26,900, down 2% in the last week.

Bitcoin Price Chart


BTC has been moving sideways recently | Source: BTCUSD on TradingView
Featured image from iStock.com, charts from TradingView.com, Glassnode.com

Related Reads

Ethereum Foundation Interim Executive Director Speaks Out: What Is Our Mission?

The Ethereum Foundation's core mission is to ensure Ethereum remains a truly permissionless, censorship-resistant, private, and open infrastructure for large-scale, sovereign coordination. The article clarifies the EF's focus and dismisses irrelevant objectives, such as pursuing institutional popularity or short-term speculation. Its core work centers on eliminating systemic weaknesses. This involves fortifying Ethereum across multiple layers—protocol, access, user, and institutional—against exploitation, control, or surveillance. Key initiatives include minimizing harmful MEV and preventing privileged control over transaction flow, making unconditional privacy a foundational default, ensuring staking remains permissionless and decentralized, and strengthening user-facing access points to uphold autonomy. Concurrently, the EF aims to seize strategic opportunities. These include leading the transition to post-quantum cryptography, achieving a fully verifiable protocol stack, establishing Ethereum as private digital cash, integrating user-owned AI agents with personal wallets, and demonstrating that trusted-neutral infrastructure can competitively handle disintermediated coordination at an institutional scale. The article also addresses recent organizational changes, stating that personnel departures were due to strategic realignment, role fit, or natural evolution. It clarifies the approach to spin-outs, emphasizing that external funding will be provided only for work critical to the EF's mission that reduces Ethereum's dependency without creating new risks or mission drift. Ultimately, the EF is committed to building an enduring, neutral system that reshapes global coordination, focusing relentlessly on the principles of censorship resistance, openness, privacy, and sovereignty (CROP).

链捕手29m ago

Ethereum Foundation Interim Executive Director Speaks Out: What Is Our Mission?

链捕手29m ago

STRC 跌破面值,比特币财库实验进入下半场

The price of STRC, Strategy's dividend-paying preferred stock, has fallen below its $100 face value, triggering a re-evaluation of the "bitcoin treasury" corporate model. This highlights a critical tension: the company's asset base consists of high-volatility, non-cash-flow-generating Bitcoin, while its capital structure requires continuous cash payouts for dividends and interest. The decline of STRC signals that market pressure is shifting from asset price volatility to the pricing of the company's financing tools. Strategy's core model involves a three-step conversion: turning equity into Bitcoin exposure, converting Bitcoin holdings into capital market credit, and packaging non-yielding BTC into cash-paying securities like STRC. While Strategy holds a massive 847,363 BTC, the focus is now on cash flow mismatches. The company faces annual preferred stock dividend obligations of approximately $1.7 billion, far exceeding the cash flow from its legacy software business. Its ability to meet these obligations relies on continued access to capital markets. The market is now scrutinizing which of three potential costs becomes untenable first: rising dividend costs to attract investors, dilution costs from issuing more common stock, or the reputational cost of selling BTC—a move contrary to its "hodl" narrative. For the broader crypto market, a constrained Strategy means the potential loss of a predictable, narrative-driven marginal buyer for Bitcoin. The STRC discount serves as a reminder that the longevity of such models depends not just on Bitcoin's price, but also on financing windows, cash reserves, and investor willingness to pay a "trust premium" for the structure.

marsbit1h ago

STRC 跌破面值,比特币财库实验进入下半场

marsbit1h ago

Standard Chartered Bank’s 50-Fold Fantasy: Predicting AAVE to Reach $3,500

Standard Chartered Bank has issued an optimistic research report predicting that the AAVE token could surge 50-fold to $3,500 by 2030. This forecast is based on the projection that the total value locked (TVL) in DeFi will grow 37x to approximately $2.7 trillion, driven by stablecoin expansion and the tokenization of real-world assets (RWA). The bank's model links Aave's potential valuation directly to its protocol revenue, which is primarily driven by net interest margins. The report highlights Aave's current dominant position, noting it captures over 80% of the net earnings ("protocol retained earnings") in the lending sector while holding only about half of its TVL. It also points to the recent launch of the Aave V4 architecture and a healthy revenue stream of $142 million in 2025 as positive fundamentals. Grayscale's separate analysis, applying traditional valuation metrics like DCF, concluded AAVE is currently undervalued. However, the article notes significant challenges. Aave's peer-to-pool lending model suffers from inherent capital inefficiency, with an estimated $52 million annual "deadweight loss" due to idle funds needed for liquidity buffers. This structural flaw was exposed during the April KelpDAO exploit, which locked a WETH pool at 100% utilization for days. Emerging protocols like Morpho, with more efficient point-to-point models, are cited as growing competitive threats. In summary, while institutional forecasts paint a macro picture of massive growth fueled by RWA adoption, Aave's path forward hinges on addressing its core structural limitations and competitive pressures within the evolving DeFi lending landscape.

链捕手2h ago

Standard Chartered Bank’s 50-Fold Fantasy: Predicting AAVE to Reach $3,500

链捕手2h ago

Trading

Spot
Futures
活动图片