

Mr 420
2024/02/12 05:37
The situation might get dicey
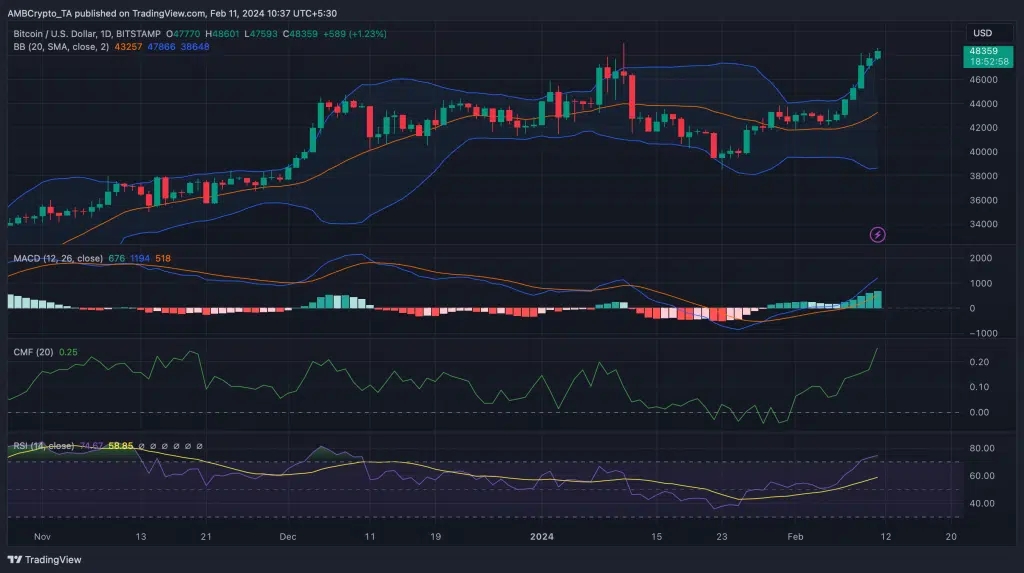
AMBCrypto then analyzed BTC’s daily chart to see what market indicators suggested. The MACD displayed a clear bullish advantage in the market.
The Chaikin Money Flow (CMF) also registered a sharp uptick, indicating that the king of crypto’s price might rally further. However, a few indicators told a different story.
For instance, BTC’s price had touched the upper limit of the Bollinger bands. The Relative Strength Index (RSI) entered the overbought zone.
This can increase selling pressure on the token, which, in turn, might put an end to its bull rally.
#HTX SmartEarn Debuts#Hit March's Interaction Leaderboard
2Share
All Comments0LatestHot
No records