Trading King
08/28 10:44
XLM Price Analysis
XLM Price Analysis
XLM’s price decline accelerated on August 19, when it broke below the $0.403–$0.405 support zone after a 1.75% intraday drop. This move coincided with trading volumes spiking to 52.17M XLM, triggering algorithmic sell orders.
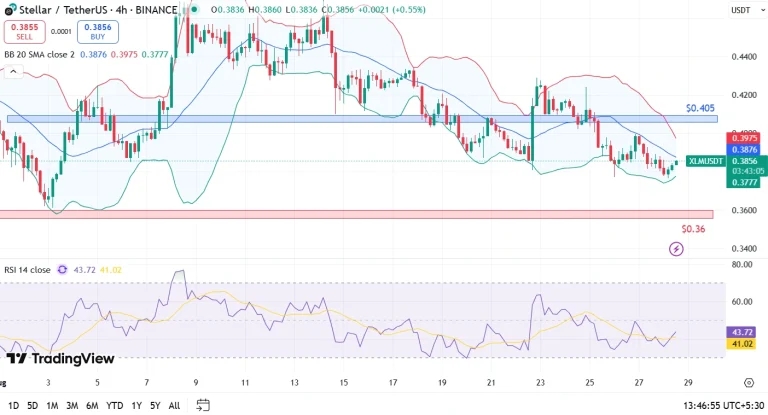
Talking about technical indicators, the MACD histogram at -0.00556 shows that downward momentum is still building. While the RSI at 35.41 signals oversold conditions, but no bullish divergence yet. If Stellar posts a daily close below $0.38, it could lead to cascade liquidations, pushing the price toward the next key support around $0.36.
On the upside, Stellar’s price would need to reclaim $0.39–$0.40 to neutralize immediate selling pressure. A strong close above this zone could open the door for a retest of $0.405–$0.42. But current indicators suggest consolidation or further decline is more likely in the short term.
All Comments0LatestHot